Download to read offline
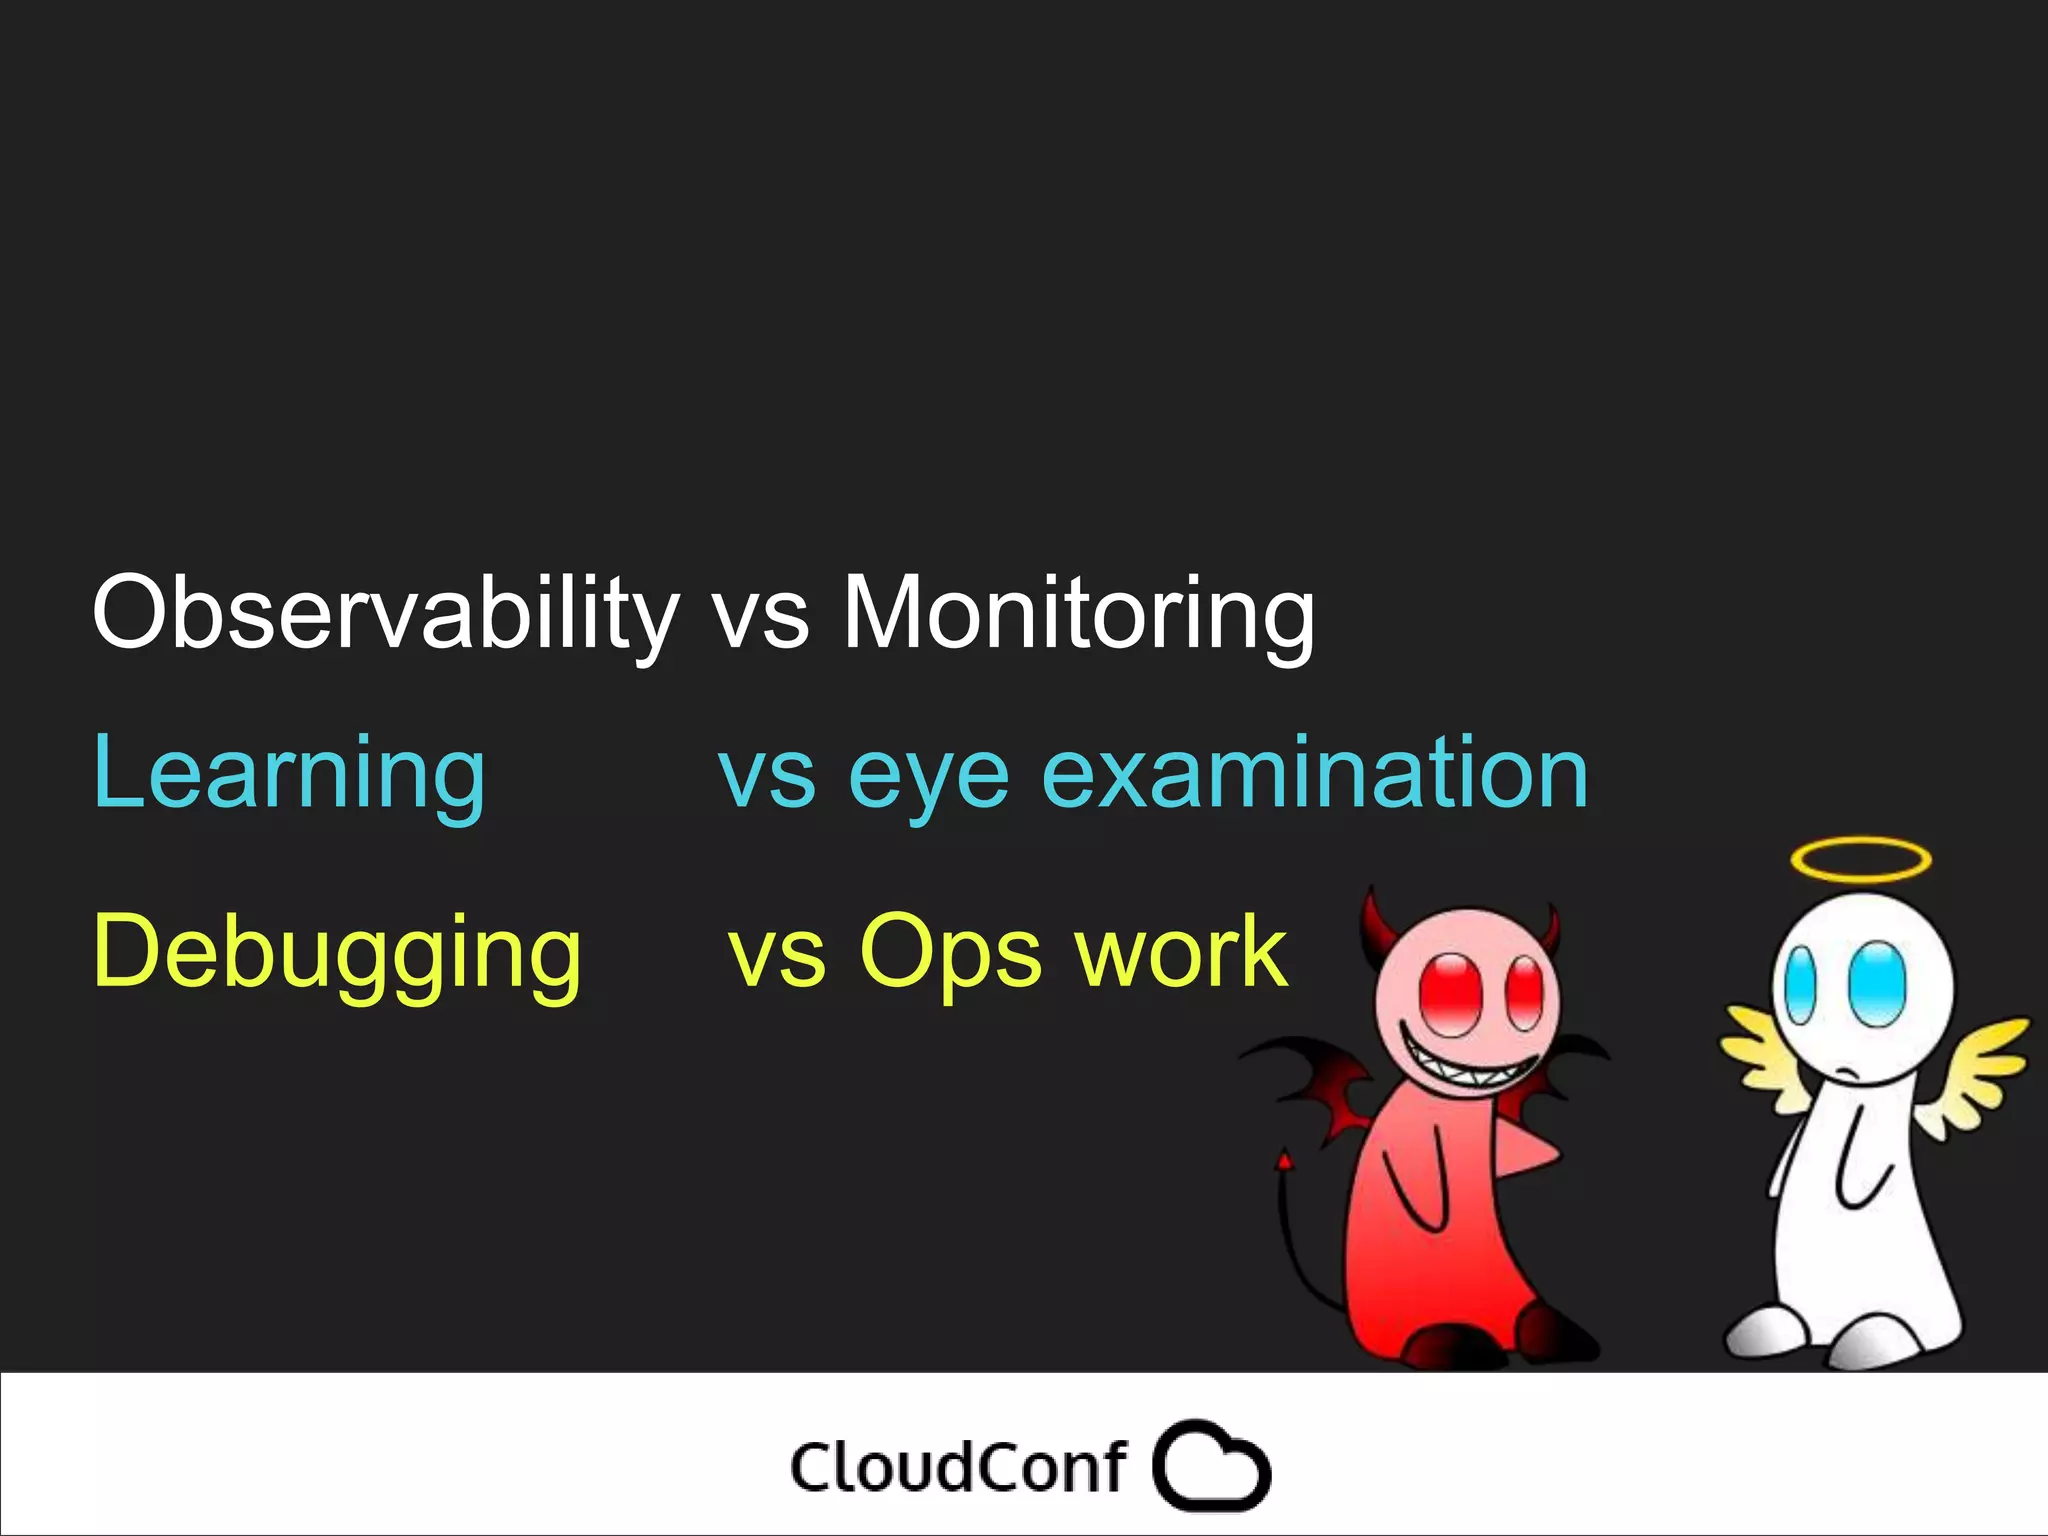
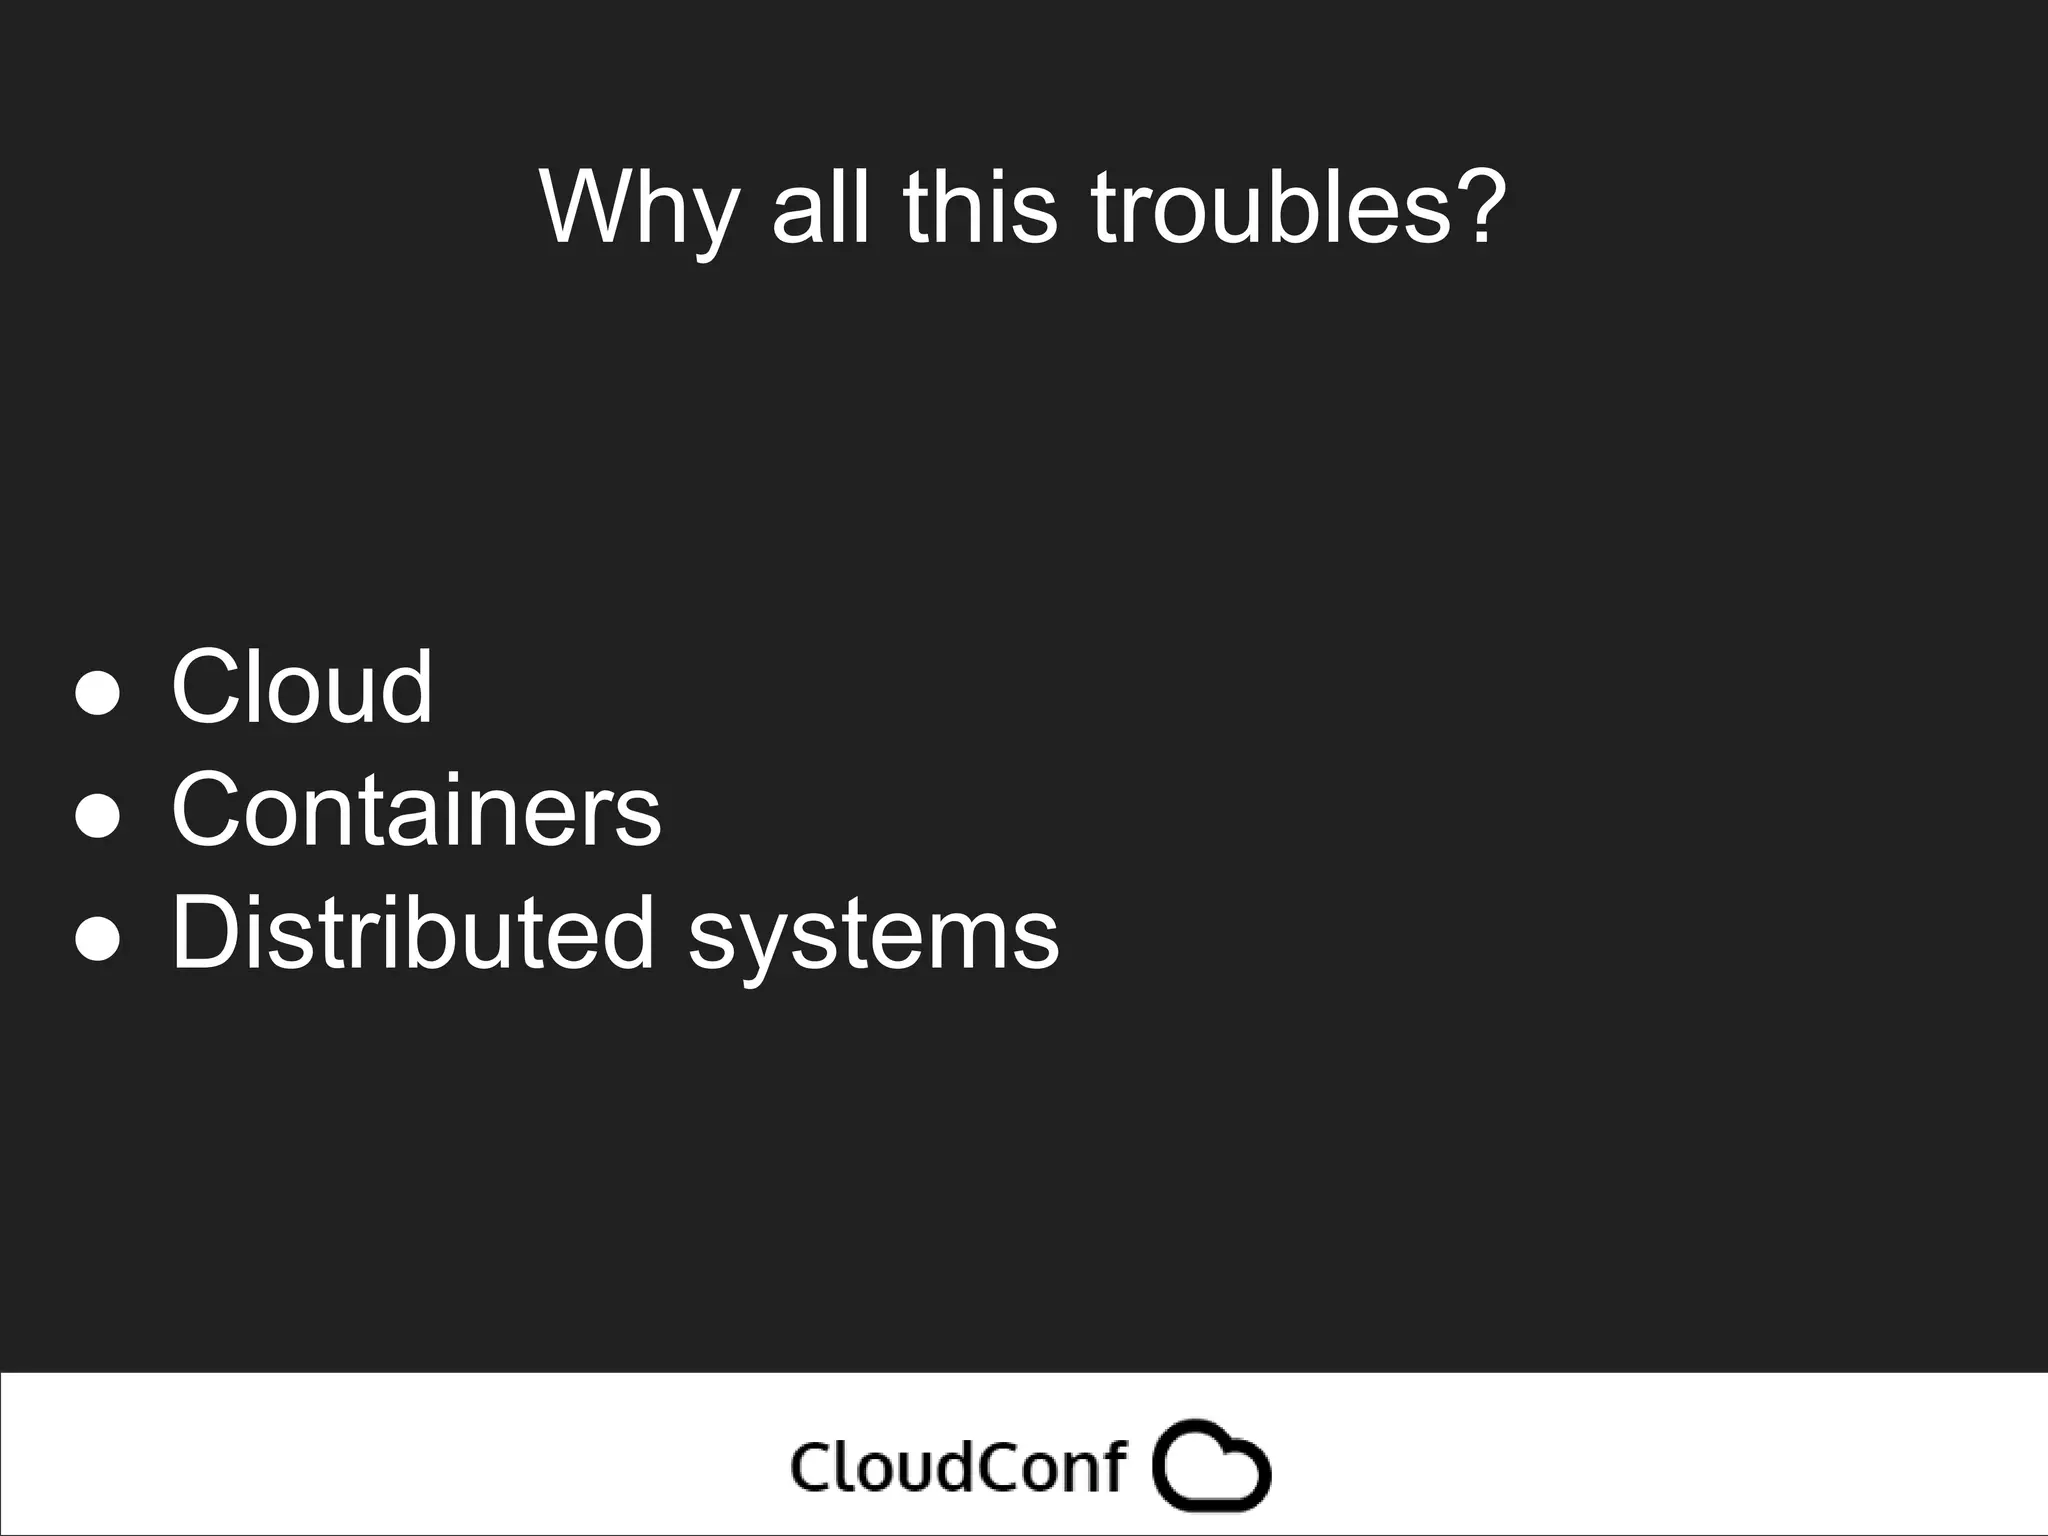

The document discusses the differences between observability and monitoring, emphasizing the importance of debugging and operational work. It highlights the need for teams to run their code and to utilize tools for better insights in cloud, containers, and distributed systems. The author includes references to their Twitter and blog for further information on the topic.


![Vibe Coding vs. Spec-Driven Development [Free Meetup]](https://cdn.slidesharecdn.com/ss_thumbnails/vibecodingvsspecdrivendevelopment-251209105622-43f455e7-thumbnail.jpg?width=640&height=640&fit=bounds)


