Artificial intelligence in the post-deep learning era
Ieso 2012-wr-atmosphere-and-hydrosphere
1. IESO 2012 Written TEST Atmosphere
Name_____________________________
Nationality _________________________
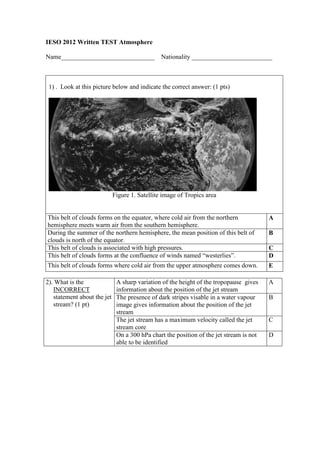
1) . Look at this picture below and indicate the correct answer: (1 pts)
Figure 1. Satellite image of Tropics area
This belt of clouds forms on the equator, where cold air from the northern
hemisphere meets warm air from the southern hemisphere.
During the summer of the northern hemisphere, the mean position of this belt of
clouds is north of the equator.
This belt of clouds is associated with high pressures.
This belt of clouds forms at the confluence of winds named “westerlies”.
This belt of clouds forms where cold air from the upper atmosphere comes down.
2). What is the
INCORRECT
statement about the jet
stream? (1 pt)
A sharp variation of the height of the tropopause gives
information about the position of the jet stream
The presence of dark stripes visable in a water vapour
image gives information about the position of the jet
stream
The jet stream has a maximum velocity called the jet
stream core
On a 300 hPa chart the position of the jet stream is not
able to be identified
A
B
C
D
E
A
B
C
D
2. Figure 2. Geopotential contours
.3). Figure 2 above illustrates the distribution of the geopotential contour
of the 500 hPa isobaric surface over Korea. (1 pt)
Select the best answer among the statements that describes the upper air
corectly
1. Pressure gradient forces act from point X towards point Y.
2. At point Z the wind blows from the west to the east.
3. The steeper the slope of the 500hPa isobaric surface the greater the
pressure gradient force
1
2
3
2 and 3
A
B
C
D
1 and 2
E
1 and 3
F
1,2, and 3 G
3. 4). The western coast of the southernmost part
of South America, to the west of the Andes,
is characterized by the presence of a rain
forest. As opposed to the area to the east of
the mountain chain which is a desert (the
Patagonia). Taking into account that winds
in the area blow most of the time from west
to east, how you could explain this
difference in vegetation? (1 pt)
In the Andes there are many
A
volcanoes that produce a lot of
ash that facilitates precipitation.
The rainfall mainly resulted
B
from mountain effect –
“orographic uplift”
Seasonal Monsoonal rainfall
C
Increased in water flow due to
the melting of glaciers
D
5). Choose the correct statement about the atmosphere near the equator (1 pt) :
A
(A) Cold and warm fronts are the dominant source of rainfall
(B) Diurnal variation is not important
(C) Typhoons often develop in this area
(D) The Tropopause temperature is colder than that of midlatitude regions
(E) The pressure gradient is important for weather analysis
B
C
D
E
1
2
Figure 3b
July
6). Figures 3a and 3b above illustrates the distribution of annual
average atmospheric pressure on the ground in January and July.
Select the best response from the following statements to describe
the given weather charts correctly. (1 pt)
B
3
C
2 and 3
Figure 3a
January
A
D
1 and 2
E
1 and 3
1. In the northern hemisphere Winter, high pressure develops
over the land area.
2. In January, high pressure develops over the land area in the 1,2, and 3
southern hemisphere.
3. There is less average variation in atmospheric pressure
between winter and summer in the northern hemisphere,
compared with the southern hemisphere.
F
G
4. 7). Match the following
statements with the right choices (1pt)
Put the letter of your
choice below
1. Which gas has the biggest variation in
space and time, and has strong influence
on the local weather?
A. CO2
B. CO
2. Which gas has the highest concentration
in the Earth’s atmosphere?
3. Which gas makes the largest contribution
to the greenhouse effect?
C. H2O
D. He
E. N2
4. Which gas’s anthropogenic concentration
change is contributing most to climate
change?
8). Clouds are classified according to height and form. High cloud
Which response best describes Altocumulus
Middle cloud
lenticularis? (1 pt)
Low cloud
Stratiform cloud
Cirriform cloud
A
B
C
D
E
Figure 4
Question number 9 and 10 refers to Figure 4 to the
left.
Figure 4 shows the vertical profile of mean global
air pressure starting from mean sea level and going
up to 50 km in altitude. Use the information from
Figure 4 to answer the following questions:
9). The term “Pressure” at the horizontal axis
is equivalent to ......... (1 pt)
Weight divided by Volume
Mass divided by Area
Density multiplied by
Temperature
Mass multiplied by Temperature
Force divided by Area
A
B
C
D
E
5. 10). According to Figure 4, The thickest layer
is ........ (1 pt)
101-110 hPa
A
501-510 hPa
B
701-710 hPa
1001-1010 hPa
C
D
11). Choose the correct answer (1 pt)
1 and 2 are true
1. Wind above the 1 km elevation generally blows
parallel to the pressure contour lines.
2. It always rains when a warm front is approaching.
3. Behind the cold front a northwest wind will blow. A
southeast winds will blow behind a warm front.
4. The fronts are expected to move towards the north.
5. The speed of the cold front is nearly the same as the
wind speed just behind front.
A
2 and 4 are true
1 and 3 are true
1 and 4 are true
1 and 5 are true
B
C
D
E
3 and 5 are true
4 and 5 are true
3 and 4 are true
F
G
H
12). The center of mass of the Earth’s atmosphere is (1pt):
A) a little less than halfway between the Earth’s surface and the outer
boundary of the atmosphere.
B) near the surface of the Earth.
C) near the outer boundary of the atmosphere.
D) near the center of Earth.
E) none of the above.
13). Look at the picture of the clouds in Figure 5 below
Figure 5
Which statement is correct ? (1pt)
The clouds are:
(A) associated with a vertical wind
shear
(B) formed due to a passage of a jet
plane (jet contrail)
(C) thunderstorm clouds
(D) a precursor of an earthquake
(E) cloud street
6. Calculation Problems
14).
Temperature
(0C)
10,0
12,0
14,0
16,0
18,0
20,0
22,0
24,0
26,0
28,0
30,0
Vapor Pressure
(X 103Pa)
1,23
1,40
1,60
1,81
2,06
2,34
2,65
2,99
3,36
3,78
4,24
The vapor pressure of water decreases as the
temperature decreases. If the amount of water
vapor in the air is kept constant as the air is
cooled, then the temperature would reach the
dew point, at which the partial pressure and
vapor pressure coincide and the vapor is
saturated.
If the air is cooled further, vapor condenses
to liquid until the partial pressure again equals
the vapor pressure at that temperature.
In the meteorological laboratory with the
room temperature 26.0 oC, a meteorologist
cools a metal can by gradually adding cold
water. When the can temperature reaches
16.0oC, water droplets form on the can’s
outside surface.
What is the relative humidity of the 26.0oC air in the room?
(show all your calculations) (3 pts)
Answer.
Relative humidity =
partial pressure of water vapor at temperature T
x 100 %
saturated vapor pressure of water at temperature T
The experiment shows that the dew point is 16.0oC, so the partial pressure of water
vapor at 26.0oC is equal to the vapor pressure at 16.0oC, which is 1.81×10³ Pa.
Thus the relative humidity =
1.81 × 10 3 Pa
× 100% = 0.539 × 100% = 53.9%
3.36 × 10 3 Pa
15). In a static atmosphere, the pressure change with height is governed by the
hydrostatic equation ∆p = ρg∆z.
In this equation:
g is the gravitational acceleration in m/s2 (g = 9.81 m/s2)
ρ is the air density in kg/m3
∆p is pressure difference in Pa (pascal)
∆z is the thickness of different height
When the mean air density between 1000 hPa to 500 hPa layer is 0.910 kg/m3,
calculate the height of 500 hPa level with the assumption that mean sea level pressure
is 1000 hPa
(show your calculations). (3 pts)
Answer:
1 hPa = 100 Pa = 100 kg/m/s2
7. ∆p = 1000 hPa – 500 hPa = 500 hPa = 50000 Pa
∆z = ∆p/(ρg)
∆p = ρg∆z
= 50000 Pa / (0.910 kg/m3 x 9.81 m/s2)
= 50000 Pa/(8.9271 kg/m2/ s2)
= 5600,9 m
Thus the hight of 500 hPa level is ≈ 5601 m
8. IESO 2012 Written TEST Hydrosphere
Name_____________________________
Nationality _________________________
Figure 1(a) vertical temperature profiles
Figure 1(b) time series of isothermal contours.
1). Figures 1(a) and 1(b) show growth and decay of the seasonal thermocline at 50°N,
145°W in the eastern North Pacific. The upper mixed layer, as seen in the upper
part of Figure 1(a) is a vertically mixed layer with nearly homogeneous water
temperature.
Referring the above figures 1(a) and 1(b), choose two right answers (2pts).
A. Variation of the mixed layer depth depends on the strength of the warm and cold
water currents.
B. Decreasing of the mixed layer thickness from winter to summer is due to the heat
increase from solar radiation and the decrease of mixing by weakening winds.
C. The main processes that cause the highest water temperature to occur in August
are due to the cold water runoff from the land and the decrease of mixed layer
thickness.
D. The depth of the mixed layer in November is deeper than in May. One of the
factors causing an increase in depth of the mixed layer in November is thermal
convection due to the surface cooling by heat loss.
All the right answers are: B, D
9. 2). Methane hydrates, also called fire ice, trap
methane molecules, and are found in enormous
quantities in the near subsurface of marine
sediments in many places. If the warming of
water melts the fire ice, and liberates the
methane molecules into the ocean water and
eventually into the atmosphere, what will the
effect on the global weather be: (2 pts)
3). Tide is the most periodic
phenomena in the sea
but the tidal range varies
every day. Choose the
two
INCORRECT
answers describing the
tidal phenomena (2 pts).
Decreasing the global
warming
Increasing the global
warming
It will not affect the global
warming
Increasing only the local
warming
A
B
C
D
Lunar tide is generated by the difference of
forces between the gravitational attraction force A
of the Moon and the centrifugal force by the
Earth’s rotation.
Tide generating forces (TGF) by the Sun is about B
46% of TGF by the Moon.
Tidal range is greater in the new and full moon
C
phases than in quarter moon phases.
Spring and neap tides are produced by the
D
superposition of diurnal and semi-diurnal tides.
High and low tides occur once or twice a day E
depending on the geographical locations on the
Earth.
4). Figure 2 below indicates the general pattern of ocean currents in the Pacific Ocean.
Figure 2
4.1) From Figure 2, what wind is responsible for the current at location A? (2pts)
(A) Polar Westerly Wind
(B) Southeasterly Trade Wind
(C) Westerly Wind
(D) Northeasterly Trade Wind
10. 4.2) From Figure 2, what is the name of current at location B? (2pts)
(A) South Equatorial Current
(B) Equatorial Counter Current
(C) North Equatorial Current
(D) North Pacific Current
4.3) Currents at locations A, B, C all belong to the geostrophic current. What are
the two major opposing forces that create the geostrophic currents? (2 pts)
(A) Wind stress
(B) Coriolis force
(C) Pressure gradient force
(D) Bottom friction
5) . (3 pts) Figure 3
The alpine river Isère, in France flows through the city of
Grenoble. Its drainage basin, as measured at this location,
has an area of 6x10⁹ m2. The mean density of the rocks in
this drainage basin is 2.5g/cm3. During the year 2004, the
Isère at Grenoble removed 3x10⁹ kg of material (dissolved
and solid). For the drainage basin, calculate the mean rate
of erosion in depth per year for 2004. Choose the correct
answer.
2 meters per year
A
1 meter per year
B
20 millimeters per year
2 millimeters per year
C
D
0.2 millimeter per year
E