Axa Assurance Maroc - Insurer Innovation Award 2024
Ieso 2012-pt-atmosphere
1. IESO 2012 Practical TEST Atmosphere
Name_____________________________
Nationality _________________________
Please give your answer just in this question sheet and give your plot in the Emagram
(Skew-T log-P) for question number 3.
1) Modelling an inversion
Material
• salted water (300g of salt per litre) at 5°C
• hot fresh water at 50°C
• tall beaker
• plastic film (useful for pouring hot water gently on top of cold salted
water without mixing it ; you get rid of the film gently after that)
• colour Tepid fresh water filled in small bottle at room temperature.
• a metal wire attached to the flask : useful for pushing down the small
bottle at the bottom of the beaker.
I) Pour cold, salted water in the beaker up to mid-height
II) Cover the water with the plastic sheet
III) Pour gently hot fresh water on the top of the filmed layer
of salted water, in order to avoid mixing the two water masses.
IV) Pull gently the film, avoiding turbulence.
V) Put the small bottle filled with colored tepid water at the bottom of the beaker (using the
wire) ; incline the opening of the bottle so as to let the colored water go out gently.
Questions
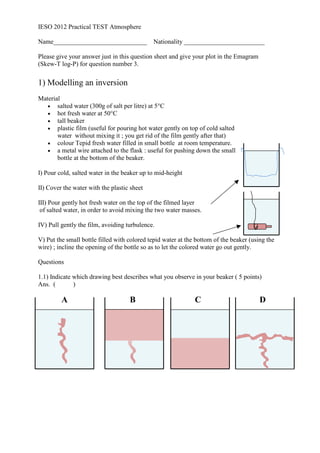
1.1) Indicate which drawing best describes what you observe in your beaker ( 5 points)
Ans. (
)
A
B
C
D
2. 1.2) Please indicate the relative densities of the 3 water masses
(HF : hot and fresh, CS : cold and salted, TF : Colour Tepid fresh) : ( 2 points)
Ans. (
)
A)
B)
C)
D)
density CS > density HF > density TF
density HF > density CS > density TF
density TF > density CS > density HF
density CS > density TF > density HF
2) Inversion in a valley
Inversion can be a problem when there is pollution. Let’s consider a valley with a polluting
factory in winter.
2.1) Associate each time of the day /weather condition below with one of the vertical
profiles of temperature A, B, and C in the small box ( 3 points)
900 hPa
950 hPa
1000 hPa
At the end of a
clear night
At the end of a
cloudy night
At the end of a
sunny day
Pressure
A
B
C
900 hPa
950 hPa
1000 hPa
Temperature
Temperature
Temperature
2.2) Draw the limit of the polluted layer on the valley profile above (if any) ( 2 points)
3. 3) Zonda (Foehn) wind
An emagram (Skew T Log-P-diagram in the US) is a thermodynamic diagram which allows
to predict how the state of a parcel of air changes when the parcel moves up or down. You
may kindly note that in those diagrams, isotherms (solid brown lines) are skewed towards the
right at 45°, so you must read temperature obliquely! Pressure/altitude is on the vertical axis.
We are going to apply it to the study of a famous Argentinian wind, blowing from the Andes :
Zonda wind.
Let’s consider a parcel of humid air arriving from the Pacific Ocean in Chile. At the altitude
of 200 meters, air pressure is 1000 hPa. The temperature of this parcel of air is then 15°C
(A point) and its mixing ratio (water content) is 6 g of water per kg of air.
4. 3.1) Plot this point (A point) on the emagram. Plot the dew point (DA) at this altitude
and indicate the dew point temperature. (1 point)
Ans.
West winds push this parcel of air up the Chilean slopes of the Andes. We will consider that
this move is adiabatic: the parcel of air does not exchange heat with the surrounding air and
cools just because its pressure decrease.
At some point, the air parcel will reach saturation and rain will start(B point).
3.2) Plot the point B up to which the rain starts (saturation) on the emagram and draw
the path between A and B. (1 point)
Now saturated air continue to move up the slope, until the summit of an Andean mountain
pass, at 2500 m (750 hPa).(C point)
3.3) Plot the point C giving the state of the parcel of air at 750 hPa, and draw the path
between B and C. ( 2 points)
Now the parcel will go down the argentinian slope of the Andes, until it arrives at
the altitude of 200 m (1000 hPa).(D point)
3.4) Plot the point D giving the state of the parcel of air at 1000 hPa, and draw the path
between C and D. Indicate the temperature and mixing ratio of the air in D.( 2 points)
Ans.
3.5) Choose how to describe the perception of the Zonda wind in Argentina (1 point)
(A) warm and humid
(B) cold and humid
(C) warm and dry
(D) cold and dry.
Ans.