SlideShare a Scribd company logo
1 of 67
Sir Richard Doll Seminar in Public Health and Epidemiology Oxford, May 18th2010 The Slideshare version of this presentation does not show animations. Please go to our website for the original file and additional audio material: http://sasi.group.shef.ac.uk/presentations/ Danny DorlingUniversity of Sheffield Worldmapping:how and where do 57 million people a year die?
Live and let die According to the Global Burden of Disease Study there are approximately 57 million people dying a year: 57,000,000 a year; 	these are 157,000 a day; 	or 2 persons dying every second. This presentation shows,why there is someone dying every half second; This presentation shows, how the world looks likewhen health, disease, and death are put onto maps; This presentation shows,how unequal health is distributed globally...
How healthy is the world?Mapping Health General overview
Public Health Spending 2228 billion PPP US$, $39,000 per death per year
Private Health Spending 1847 billion PPP US$, $4 for every $5 spent by the state
Physicians Working 9.56 million, one physician for every 6 deaths a year
Early Neonatal Mortality 3.01 million, one within 7 days of birth for every 3 physicians
HIV/AIDS Prevalence 29.22 million, one in every 200 people in the world
Malaria Cases 71.9 million, 7.5 cases per physician in the world
What are they all dying from?Mapping Causes of Death Grouped in three broad groups of causes Note: For technical reasons the following slides have been modified from their original version. The original presentation with full screen maps can be downloaded from our website at http://sasi.group.shef.ac.uk/presentations/
Preventable Deaths people who died from most preventable (communicable infections, maternal, perinatal and nutritional conditions) in one year
Cause of Death:Often Preventable Deaths 18,475,000 a year; 51,000 a day; one every 2 seconds...
Causes of Death(continued) Tuberculosis 1,570,000 a year; 4,301 a day; one every 20 seconds... Infectious and Parasitic Disease 10,988,000 a year; 30,000 a day; one every 3 seconds... STDs Excluding HIV 180,000 a year; 493 a day; one every 3 minutes... HIV/AIDS 2,920,000 a year; 8,000 a day; one every 11 seconds...
Causes of Death(continued) Chlamydia 9,415 a year; 26 a day; one every 56 minutes... Syphilis 157,000 a year; 430 a day; one every 3 minutes... Diarrhoea 1,871,000 a year; 5126 a day; one every 17 seconds... Gonorrhoea 959 a year; 3 a day; one every 9 hours...
Causes of Death(continued) Whooping Cough 294,000 a year; 805 a day; one every 2 minutes... Vaccine Preventable Deaths 1,121,000 a year; 3,071 a day; one every 28 seconds... Diphtheria 5,452 a year; 15 a day; one every 1½ hours... Tetanus 214,000 a year; 586 a day; one every 2½ minutes...
Causes of Death(continued) Measles 607,000 a year; 1,663 a day; one every 52 seconds... Polio 831 a year; 2 a day; one every 10½ hours... Hepatitus B 103,000 a year; 282 a day; one every 5 minutes... Meningitis 173,000 a year; 474 a day; one every 3 minutes...
Causes of Death(continued) Malaria 911,000 a year; 2,496 a day; one every 35 seconds... Hepatitus C 54,000 a year; 148 a day; one every 10 minutes... Sleeping sickness 48,000 a year; 132 a day; one every 11 minutes... Local Tropical Diseases 158,000 a year; 433 a day; one every 3 minutes...
Causes of Death(continued) Schistosomiasis 44,000 a year; 121 a day; one every 12 minutes... Chagas Disease 15,000 a year; 41 a day; one every 35 minutes... Elephantiasis 417 a year; one every 21 hours... Leishmaniasis 51,000 a year; 140 a day; one every 10 minutes...
Causes of Death(continued) Dengue 19,000 a year; 52 a day; one every 28 minutes... Leprosy 6,168 a year; 17 a day; one every 1½ hours... Intestinal Worm Infection 12,000 a year; 33 a day; one every 44 minutes... Japanese Encephalitis 14,000 a year; 38 a day; one every 38 minutes...
Causes of Death(continued) Whipworm Infection 3,019 a year; 8 a day; one every 3 hours... Roundworm Infection 3,410 a year; 9 a day; one every 2½ hours... All Respiratory Infection Deaths 4,026,000 a year; 11,030 a day; one every 8 seconds... Hookworm Disease 2,941 a year; 8 a day; one every 3 hours...
Causes of Death(continued) Nose and Throat Infection 76,000 a year; 208 a day; one every 7 minutes... Pneumonia 3,947,000 a year; 10,814 a day; one every 8 seconds... Deaths of Women from Pregnancy 510,000 a year; 1397 a day; one every minute... Ear Infection 3,596 a year; 10 a day; one every 2½ hours...
Causes of Death(continued) Low Birth Weight Related 1,271,000 a year; 3,482 a day; one every 25 seconds... Deaths of Babies from Childbirth 2,465,000 a year; 6,753 a day; one every 13 seconds... All Nutritional Deficiences Deaths 485,000 a year; 1,329 a day; one every 65 seconds... Birth Injury Related 725,000 a year; 1,986 a day; one every 44 seconds...
Causes of Death(continued) Vitamin A Deficiency 23,000 a year; 63 a day; one every 23 minutes... Deaths from Starvation 260,000 a year; 712 a day; one every 2 minutes... Iodine Deficiency 6,536 a year; 18 a day; one every 80 minutes... Iron Deficiency Anaemia 137,000 a year; 375 a day; one every 4 minutes...
Causes of Death(continued) All Cancer Deaths 7,145,000 a year; 19,575 a day; one every 4 seconds... Non-Communicable Illnesses 33,630,000 a year; 92,137 a day; one every second... Throat Cancer 450,000 a year; 1,233 a day; one every 70 seconds... Mouth Cancer 318,000 a year; 871 a day; one every 99 seconds...
Causes of Death(continued) Bowel Cancer 624,000 a year; 1,710 a day; one every 50 seconds... Stomach Cancer 857,000 a year; 2,348 a day; one every 37 seconds... Pancreas Cancer 231,000 a year; 633 a day; one every 2 minutes... Liver Cancer 623,000 a year; 1,707 a day; one every 50 seconds...
Causes of Death(continued) Skin Cancer 66,000 a year; 181 a day; one every 8 minutes... Lung Cancer 1,248,000 a year; 3,419 a day; one every 25 seconds... Cancer of the Cervix 239,000 a year; 655 a day; one every 2 minutes... Breast Cancer 478,000 a year; 1,310 a day; one every 66 seconds...
Causes of Death(continued) Ovary Cancer 135,000 a year; 370 a day; one every 4 minutes... Cancer of the Uterus 71,000 a year; 195 a day; one every 7 minutes... Bladder Cancer 179,000 a year; 490 a day; one every 3 minutes... Prostate Cancer 269,000 a year; 737 a day; one every 2 minutes...
Causes of Death(continued) Leukaemia 265,000 a year; 726 a day; one every 2 minutes... Lymphoma 334,000 a year; 915 a day; one every 94 seconds... Diabetes 987,000 a year; 2,704 a day; one every 32 seconds... Other Tumour Deaths 149,000 a year; 408 a day; one every 3½ minutes...
Causes of Death(continued) Brain Disorder 1,112,000 a year; 3,047 a day; one every 28 seconds... Endocrine and other disorders 242,000 a year; 663 a day; one every 2 minutes... Manic-depression 733 a year; 2 a day; one every 12 hours... Depression Related 13,000 a year; 36 a day; one every 40 minutes...
Causes of Death(continued) Epilepsy 125,000 a year; 342 a day; one every 4 minutes... Schizophrenia 23,000 a year; 63 a day; one every 23 minutes... Dementias 396,000 a year; 1,085 a day; one every 80 seconds... Alcohol Use Disorders 91,000 a year; 249 a day; one every 6 minutes...
Causes of Death(continued) Multiple Sclerosis 16,000 a year; 44 a day; one every 33 minutes... Parkinson Disease 99,000 a year; 271 a day; one every 5 minutes... Post Traumatic Stress Disorder 56 a year; one every 6½ days... Drug Use Disorders 86,000 a year; 236 a day; one every 6 minutes...
Causes of Death(continued) Glaucoma 102 a year; one every 86 days... Eye and Ear Disease 3,249 a year; 9 a day; one every 2½ hours... Rheumatic Heart Disease 329,000 a year; 901 a day; one every 96 seconds... All Cardiovascular Disease Deaths 16,778,000 a year; 45,963 a day; one every 2 seconds...
Causes of Death(continued) Heart Attack 7,219,000 a year; 19,778 a day; one every 4 seconds... Stroke 5,536,000 a year; 15,167 a day; one every 6 seconds... Inflammatory Heart Disease 405,000 a year; 1,110 a day; one every 78 seconds... Hypertensive Heart Disease 914,000 a year; 2,504 a day; one every 35 seconds...
Causes of Death(continued) Chronic Bronchitis 2,766,000 a year; 7,578 a day; one every 11 seconds... Respiratory Disease 3,722,000 a year; 10,197 a day; one every 9 seconds... Digestive Tract Diseases 1,973,000 a year; 5,405 a day; one every 16 seconds... Asthma 241,000 a year; 660 a day; one every 2 minutes...
Causes of Death(continued) Cirrhosis Of The Liver 789,000 a year; 2,162 a day; one every 40 seconds... Peptic Ulcer Disease 265,000 a year; 726 a day; one every 2 minutes... Genitourinary Tract Diseases 849,000 a year; 2,326 a day; one every 37 seconds... Appendicitis 22,000 a year; 60 a day; one every 24 minutes...
Causes of Death(continued) Deaths from enlarged Prostate 32,000 a year; 88 a day; one every 16 minutes... Kidney Disease 678,000 a year; 1,858 a day; one every 47 seconds... All Musculoskeletal Disease Deaths 106,000 a year; 290 a day; one every 5 minutes... Skin Disease 69,000 a year; 189 a day; one every 7½ minutes...
Causes of Death(continued) Osteoarthritis 4,736 a year; 13 a day; one every 111 minutes... Rheumatoid Arthritis 25,000 a year; 68 a day; one every 21 minutes... Oral Conditions 1,608 a year; 4 a day; one every 5½ hours... Birth Defects 494,000 a year; 1,353 a day; one every 64 seconds...
Causes of Death(continued) All Accidental Deaths 3,560,000 a year; 9,753 a day; one every 9 seconds... All Injury Deaths 5,183,000 a year; 14,200 a day; one every 6 seconds... Accidental Poisoning 352,000 a year; 964 a day; one every 90 seconds... Road Traffic Accident 1,195,000 a year; 3,274 a day; one every 26 seconds...
Causes of Death(continued) Deaths from Fires 312,000 a year; 855 a day; one every 101 seconds... Deaths from Falls 393,000 a year; 1,077 a day; one every 80 seconds... Other Accidental Injury Deaths 925,000 a year; 2,534 a day; one every 34 seconds... Deaths from Drowning 384,000 a year; 1,052 a day; one every 82 seconds...
Causes of Death(continued) Suicide 878,000 a year; 2,405 a day; one every 36 seconds... All Non-accidental Deaths 1,622,000 a year; 4,444 a day; one every 19 seconds... War 171,000 a year; 468 a day; one every 3 minutes... Murder 560,000 a year; 1,534 a day; one every 56 seconds...
War Deaths people who died from war in one year
When are they all dying?Mapping the Age of Death Sorted from oldest to youngest people
Age of Death: 100+ 92,585 deaths; 254 per day; one every 341 seconds...
Age of Death: 95-99 484,416 deaths; 1,327 per day; one every 65 seconds...
Age of Death: 90-94 1,563,557 deaths; 4,284 per day; one every 20 seconds...
Age of Death: 85-89 3,144,797 deaths; 8,616 per day; one every 10 seconds...
Age of Death: 80-84 4,381,231 deaths; 12,003 per day; one every 7 seconds...
Age of Death: 75-79 5,410,001 deaths; 14,822 per day; one every 6 seconds...
Age of Death: 70-74 5,416,482 deaths; 14,840 per day; one every 6 seconds...
Age of Death: 65-69 4,548,376 deaths; 12,461 per day; one every 7 seconds...
Age of Death: 60-64 3,615,847 deaths; 9,906 per day; one every 9 seconds...
Age of Death: 55-59 2,802,369 deaths; 7,678 per day; one every 11 seconds...
Age of Death: 50-54 2,412,379 deaths; 6,609 per day; one every 13 seconds...
Age of Death: 45-49 2,098,466 deaths; 5,749 per day; one every 15 seconds...
Age of Death: 40-44 1,788,164 deaths; 4,899 per day; one every 18 seconds...
Age of Death: 35-39 1,652,503 deaths; 4,527 per day; one every 19 seconds...
Age of Death: 30-34 1,606,806 deaths; 4,402 per day; one every 20 seconds...
Age of Death: 25-29 1,496,071 deaths; 4,099 per day; one every 21 seconds...
Age of Death: 20-24 1,273,937 deaths; 3,490 per day; one every 25 seconds...
Age of Death: 15-19 870,915 deaths; 2,386 per day; one every 36 seconds...
Age of Death: 10-14 536,950 deaths; 1,471 per day; one every 59 seconds...
Age of Death: 5-9 863,022 deaths; 2,364 per day; one every 37 seconds...
Age of Death: 1-4 2,556,272  deaths; 7004 per day; one every 12 seconds...
Age of Death: Infants (aged under 1) 8,142,016 deaths; 22,307 per day; one every 4 seconds...
From Map to Cartogram Infant Mortality
World maps by the Worldmapper team Slides and animations by Benjamin Hennig Slides available on http://sasi.group.shef.ac.uk/presentations/ 	For a definition of all the causes and the data see www.worldmapper.org New estimates on causes of death are due to be released by the end of 2010 in the Global Burden of Diseases, Injuries, and Risk Factors Study http://www.globalburden.org Credits
World maps by the Worldmapper team Slides and animations by Benjamin Hennig Slides available on http://sasi.group.shef.ac.uk/presentations/ Infant mortality in affluent countries at the end of the nineteenth century rose as charitable giving rose. Mortality then fell as public anger at social injustice was converted into political change.  Political change which then used medical knowledge.  References Dorling, D. (2007). Worldmapper: The human anatomy of a small planet. PLoS Medicine 4(1), 13-18. Dorling, D. and Barford, A. (2007). Shaping the world to illustrate inequalities in health. Bulletin of the World Health Organisation, 85(11), 821-900. Dorling, D. and Barford, A. (2007). The shape of global causes of death. International Journal of Health Geographies, 6(48).  Credits

More Related Content

Similar to Worldmapping: how and where do 57 million people a year die?

Making visible global injustice in health: mapping the causes of 57 million d...
Making visible global injustice in health: mapping the causes of 57 million d...Making visible global injustice in health: mapping the causes of 57 million d...
Making visible global injustice in health: mapping the causes of 57 million d...Danny Dorling
 
Classification of insecticide based on mode of action.pdf
Classification of insecticide based on mode of action.pdfClassification of insecticide based on mode of action.pdf
Classification of insecticide based on mode of action.pdfAsbinKatwal
 
Sepsis - Process and Scale - Daniels
Sepsis - Process and Scale - DanielsSepsis - Process and Scale - Daniels
Sepsis - Process and Scale - Danielsintensivecaresociety
 
Geriatric Rheumatology
Geriatric RheumatologyGeriatric Rheumatology
Geriatric RheumatologyChung-Han Yang
 
Sante barley
Sante barleySante barley
Sante barleyEXACTRDD
 

Similar to Worldmapping: how and where do 57 million people a year die? (9)

Making visible global injustice in health: mapping the causes of 57 million d...
Making visible global injustice in health: mapping the causes of 57 million d...Making visible global injustice in health: mapping the causes of 57 million d...
Making visible global injustice in health: mapping the causes of 57 million d...
 
Classification of insecticide based on mode of action.pdf
Classification of insecticide based on mode of action.pdfClassification of insecticide based on mode of action.pdf
Classification of insecticide based on mode of action.pdf
 
Presentation
PresentationPresentation
Presentation
 
Smoking Feature
Smoking FeatureSmoking Feature
Smoking Feature
 
Bettakultcha
BettakultchaBettakultcha
Bettakultcha
 
Sepsis - Process and Scale - Daniels
Sepsis - Process and Scale - DanielsSepsis - Process and Scale - Daniels
Sepsis - Process and Scale - Daniels
 
Geriatric Rheumatology
Geriatric RheumatologyGeriatric Rheumatology
Geriatric Rheumatology
 
Aizat. Smoking Kills.
Aizat. Smoking Kills.Aizat. Smoking Kills.
Aizat. Smoking Kills.
 
Sante barley
Sante barleySante barley
Sante barley
 

More from Danny Dorling

Has the UK Reached Peak Inequality?
Has the UK Reached Peak Inequality?Has the UK Reached Peak Inequality?
Has the UK Reached Peak Inequality?Danny Dorling
 
7 New Maps of the World
7 New Maps of the World7 New Maps of the World
7 New Maps of the WorldDanny Dorling
 
Mapping the UK election(s) of 2015 - what was done and did it work?
Mapping the UK election(s) of 2015 - what was done and did it work?Mapping the UK election(s) of 2015 - what was done and did it work?
Mapping the UK election(s) of 2015 - what was done and did it work?Danny Dorling
 
Injustice - Why Social Inequality Still Persists
Injustice - Why Social Inequality Still PersistsInjustice - Why Social Inequality Still Persists
Injustice - Why Social Inequality Still PersistsDanny Dorling
 
Theories of Potential and the Creation of Inequality
Theories of Potential and the Creation of InequalityTheories of Potential and the Creation of Inequality
Theories of Potential and the Creation of InequalityDanny Dorling
 
Inequality and Empathy
Inequality and EmpathyInequality and Empathy
Inequality and EmpathyDanny Dorling
 
The Population of the UK, Chapter 10
The Population of the UK, Chapter 10The Population of the UK, Chapter 10
The Population of the UK, Chapter 10Danny Dorling
 
The Population of the UK, Chapter 9
The Population of the UK, Chapter 9The Population of the UK, Chapter 9
The Population of the UK, Chapter 9Danny Dorling
 
The Population of the UK, Chapter 8
The Population of the UK, Chapter 8The Population of the UK, Chapter 8
The Population of the UK, Chapter 8Danny Dorling
 
The Population of the UK, Chapter 6
The Population of the UK, Chapter 6The Population of the UK, Chapter 6
The Population of the UK, Chapter 6Danny Dorling
 
The Population of the UK, Chapter 5
The Population of the UK, Chapter 5The Population of the UK, Chapter 5
The Population of the UK, Chapter 5Danny Dorling
 
The Population of the UK, Chapter 4
The Population of the UK, Chapter 4The Population of the UK, Chapter 4
The Population of the UK, Chapter 4Danny Dorling
 
The Population of the UK, Chapter 3
The Population of the UK, Chapter 3The Population of the UK, Chapter 3
The Population of the UK, Chapter 3Danny Dorling
 
The Population of the UK, Chapter 2
The Population of the UK, Chapter 2The Population of the UK, Chapter 2
The Population of the UK, Chapter 2Danny Dorling
 
The Population of the UK, Chapter 1
The Population of the UK, Chapter 1The Population of the UK, Chapter 1
The Population of the UK, Chapter 1Danny Dorling
 
Roads, Casualties and Public Health: the Open Sewers of the 21st Century
Roads, Casualties and Public Health: the Open Sewers of the 21st CenturyRoads, Casualties and Public Health: the Open Sewers of the 21st Century
Roads, Casualties and Public Health: the Open Sewers of the 21st CenturyDanny Dorling
 

More from Danny Dorling (20)

Has the UK Reached Peak Inequality?
Has the UK Reached Peak Inequality?Has the UK Reached Peak Inequality?
Has the UK Reached Peak Inequality?
 
Cultural Geography
Cultural GeographyCultural Geography
Cultural Geography
 
Peak inequality
Peak inequalityPeak inequality
Peak inequality
 
Social Inequalities
Social InequalitiesSocial Inequalities
Social Inequalities
 
7 New Maps of the World
7 New Maps of the World7 New Maps of the World
7 New Maps of the World
 
Mapping the UK election(s) of 2015 - what was done and did it work?
Mapping the UK election(s) of 2015 - what was done and did it work?Mapping the UK election(s) of 2015 - what was done and did it work?
Mapping the UK election(s) of 2015 - what was done and did it work?
 
Injustice - Why Social Inequality Still Persists
Injustice - Why Social Inequality Still PersistsInjustice - Why Social Inequality Still Persists
Injustice - Why Social Inequality Still Persists
 
Theories of Potential and the Creation of Inequality
Theories of Potential and the Creation of InequalityTheories of Potential and the Creation of Inequality
Theories of Potential and the Creation of Inequality
 
Inequality and Empathy
Inequality and EmpathyInequality and Empathy
Inequality and Empathy
 
Inequality
InequalityInequality
Inequality
 
The Population of the UK, Chapter 10
The Population of the UK, Chapter 10The Population of the UK, Chapter 10
The Population of the UK, Chapter 10
 
The Population of the UK, Chapter 9
The Population of the UK, Chapter 9The Population of the UK, Chapter 9
The Population of the UK, Chapter 9
 
The Population of the UK, Chapter 8
The Population of the UK, Chapter 8The Population of the UK, Chapter 8
The Population of the UK, Chapter 8
 
The Population of the UK, Chapter 6
The Population of the UK, Chapter 6The Population of the UK, Chapter 6
The Population of the UK, Chapter 6
 
The Population of the UK, Chapter 5
The Population of the UK, Chapter 5The Population of the UK, Chapter 5
The Population of the UK, Chapter 5
 
The Population of the UK, Chapter 4
The Population of the UK, Chapter 4The Population of the UK, Chapter 4
The Population of the UK, Chapter 4
 
The Population of the UK, Chapter 3
The Population of the UK, Chapter 3The Population of the UK, Chapter 3
The Population of the UK, Chapter 3
 
The Population of the UK, Chapter 2
The Population of the UK, Chapter 2The Population of the UK, Chapter 2
The Population of the UK, Chapter 2
 
The Population of the UK, Chapter 1
The Population of the UK, Chapter 1The Population of the UK, Chapter 1
The Population of the UK, Chapter 1
 
Roads, Casualties and Public Health: the Open Sewers of the 21st Century
Roads, Casualties and Public Health: the Open Sewers of the 21st CenturyRoads, Casualties and Public Health: the Open Sewers of the 21st Century
Roads, Casualties and Public Health: the Open Sewers of the 21st Century
 

Recently uploaded

Beyond the EU: DORA and NIS 2 Directive's Global Impact
Beyond the EU: DORA and NIS 2 Directive's Global ImpactBeyond the EU: DORA and NIS 2 Directive's Global Impact
Beyond the EU: DORA and NIS 2 Directive's Global ImpactPECB
 
The basics of sentences session 2pptx copy.pptx
The basics of sentences session 2pptx copy.pptxThe basics of sentences session 2pptx copy.pptx
The basics of sentences session 2pptx copy.pptxheathfieldcps1
 
Advanced Views - Calendar View in Odoo 17
Advanced Views - Calendar View in Odoo 17Advanced Views - Calendar View in Odoo 17
Advanced Views - Calendar View in Odoo 17Celine George
 
PROCESS RECORDING FORMAT.docx
PROCESS      RECORDING        FORMAT.docxPROCESS      RECORDING        FORMAT.docx
PROCESS RECORDING FORMAT.docxPoojaSen20
 
psychiatric nursing HISTORY COLLECTION .docx
psychiatric  nursing HISTORY  COLLECTION  .docxpsychiatric  nursing HISTORY  COLLECTION  .docx
psychiatric nursing HISTORY COLLECTION .docxPoojaSen20
 
Accessible design: Minimum effort, maximum impact
Accessible design: Minimum effort, maximum impactAccessible design: Minimum effort, maximum impact
Accessible design: Minimum effort, maximum impactdawncurless
 
Z Score,T Score, Percential Rank and Box Plot Graph
Z Score,T Score, Percential Rank and Box Plot GraphZ Score,T Score, Percential Rank and Box Plot Graph
Z Score,T Score, Percential Rank and Box Plot GraphThiyagu K
 
Nutritional Needs Presentation - HLTH 104
Nutritional Needs Presentation - HLTH 104Nutritional Needs Presentation - HLTH 104
Nutritional Needs Presentation - HLTH 104misteraugie
 
Activity 01 - Artificial Culture (1).pdf
Activity 01 - Artificial Culture (1).pdfActivity 01 - Artificial Culture (1).pdf
Activity 01 - Artificial Culture (1).pdfciinovamais
 
ICT Role in 21st Century Education & its Challenges.pptx
ICT Role in 21st Century Education & its Challenges.pptxICT Role in 21st Century Education & its Challenges.pptx
ICT Role in 21st Century Education & its Challenges.pptxAreebaZafar22
 
An Overview of Mutual Funds Bcom Project.pdf
An Overview of Mutual Funds Bcom Project.pdfAn Overview of Mutual Funds Bcom Project.pdf
An Overview of Mutual Funds Bcom Project.pdfSanaAli374401
 
Key note speaker Neum_Admir Softic_ENG.pdf
Key note speaker Neum_Admir Softic_ENG.pdfKey note speaker Neum_Admir Softic_ENG.pdf
Key note speaker Neum_Admir Softic_ENG.pdfAdmir Softic
 
fourth grading exam for kindergarten in writing
fourth grading exam for kindergarten in writingfourth grading exam for kindergarten in writing
fourth grading exam for kindergarten in writingTeacherCyreneCayanan
 
Presentation by Andreas Schleicher Tackling the School Absenteeism Crisis 30 ...
Presentation by Andreas Schleicher Tackling the School Absenteeism Crisis 30 ...Presentation by Andreas Schleicher Tackling the School Absenteeism Crisis 30 ...
Presentation by Andreas Schleicher Tackling the School Absenteeism Crisis 30 ...EduSkills OECD
 
1029 - Danh muc Sach Giao Khoa 10 . pdf
1029 -  Danh muc Sach Giao Khoa 10 . pdf1029 -  Danh muc Sach Giao Khoa 10 . pdf
1029 - Danh muc Sach Giao Khoa 10 . pdfQucHHunhnh
 
Seal of Good Local Governance (SGLG) 2024Final.pptx
Seal of Good Local Governance (SGLG) 2024Final.pptxSeal of Good Local Governance (SGLG) 2024Final.pptx
Seal of Good Local Governance (SGLG) 2024Final.pptxnegromaestrong
 
Unit-IV- Pharma. Marketing Channels.pptx
Unit-IV- Pharma. Marketing Channels.pptxUnit-IV- Pharma. Marketing Channels.pptx
Unit-IV- Pharma. Marketing Channels.pptxVishalSingh1417
 
APM Welcome, APM North West Network Conference, Synergies Across Sectors
APM Welcome, APM North West Network Conference, Synergies Across SectorsAPM Welcome, APM North West Network Conference, Synergies Across Sectors
APM Welcome, APM North West Network Conference, Synergies Across SectorsAssociation for Project Management
 

Recently uploaded (20)

Beyond the EU: DORA and NIS 2 Directive's Global Impact
Beyond the EU: DORA and NIS 2 Directive's Global ImpactBeyond the EU: DORA and NIS 2 Directive's Global Impact
Beyond the EU: DORA and NIS 2 Directive's Global Impact
 
Advance Mobile Application Development class 07
Advance Mobile Application Development class 07Advance Mobile Application Development class 07
Advance Mobile Application Development class 07
 
The basics of sentences session 2pptx copy.pptx
The basics of sentences session 2pptx copy.pptxThe basics of sentences session 2pptx copy.pptx
The basics of sentences session 2pptx copy.pptx
 
Advanced Views - Calendar View in Odoo 17
Advanced Views - Calendar View in Odoo 17Advanced Views - Calendar View in Odoo 17
Advanced Views - Calendar View in Odoo 17
 
PROCESS RECORDING FORMAT.docx
PROCESS      RECORDING        FORMAT.docxPROCESS      RECORDING        FORMAT.docx
PROCESS RECORDING FORMAT.docx
 
psychiatric nursing HISTORY COLLECTION .docx
psychiatric  nursing HISTORY  COLLECTION  .docxpsychiatric  nursing HISTORY  COLLECTION  .docx
psychiatric nursing HISTORY COLLECTION .docx
 
Accessible design: Minimum effort, maximum impact
Accessible design: Minimum effort, maximum impactAccessible design: Minimum effort, maximum impact
Accessible design: Minimum effort, maximum impact
 
Z Score,T Score, Percential Rank and Box Plot Graph
Z Score,T Score, Percential Rank and Box Plot GraphZ Score,T Score, Percential Rank and Box Plot Graph
Z Score,T Score, Percential Rank and Box Plot Graph
 
Nutritional Needs Presentation - HLTH 104
Nutritional Needs Presentation - HLTH 104Nutritional Needs Presentation - HLTH 104
Nutritional Needs Presentation - HLTH 104
 
Activity 01 - Artificial Culture (1).pdf
Activity 01 - Artificial Culture (1).pdfActivity 01 - Artificial Culture (1).pdf
Activity 01 - Artificial Culture (1).pdf
 
ICT Role in 21st Century Education & its Challenges.pptx
ICT Role in 21st Century Education & its Challenges.pptxICT Role in 21st Century Education & its Challenges.pptx
ICT Role in 21st Century Education & its Challenges.pptx
 
An Overview of Mutual Funds Bcom Project.pdf
An Overview of Mutual Funds Bcom Project.pdfAn Overview of Mutual Funds Bcom Project.pdf
An Overview of Mutual Funds Bcom Project.pdf
 
Mattingly "AI & Prompt Design: Structured Data, Assistants, & RAG"
Mattingly "AI & Prompt Design: Structured Data, Assistants, & RAG"Mattingly "AI & Prompt Design: Structured Data, Assistants, & RAG"
Mattingly "AI & Prompt Design: Structured Data, Assistants, & RAG"
 
Key note speaker Neum_Admir Softic_ENG.pdf
Key note speaker Neum_Admir Softic_ENG.pdfKey note speaker Neum_Admir Softic_ENG.pdf
Key note speaker Neum_Admir Softic_ENG.pdf
 
fourth grading exam for kindergarten in writing
fourth grading exam for kindergarten in writingfourth grading exam for kindergarten in writing
fourth grading exam for kindergarten in writing
 
Presentation by Andreas Schleicher Tackling the School Absenteeism Crisis 30 ...
Presentation by Andreas Schleicher Tackling the School Absenteeism Crisis 30 ...Presentation by Andreas Schleicher Tackling the School Absenteeism Crisis 30 ...
Presentation by Andreas Schleicher Tackling the School Absenteeism Crisis 30 ...
 
1029 - Danh muc Sach Giao Khoa 10 . pdf
1029 -  Danh muc Sach Giao Khoa 10 . pdf1029 -  Danh muc Sach Giao Khoa 10 . pdf
1029 - Danh muc Sach Giao Khoa 10 . pdf
 
Seal of Good Local Governance (SGLG) 2024Final.pptx
Seal of Good Local Governance (SGLG) 2024Final.pptxSeal of Good Local Governance (SGLG) 2024Final.pptx
Seal of Good Local Governance (SGLG) 2024Final.pptx
 
Unit-IV- Pharma. Marketing Channels.pptx
Unit-IV- Pharma. Marketing Channels.pptxUnit-IV- Pharma. Marketing Channels.pptx
Unit-IV- Pharma. Marketing Channels.pptx
 
APM Welcome, APM North West Network Conference, Synergies Across Sectors
APM Welcome, APM North West Network Conference, Synergies Across SectorsAPM Welcome, APM North West Network Conference, Synergies Across Sectors
APM Welcome, APM North West Network Conference, Synergies Across Sectors
 

Worldmapping: how and where do 57 million people a year die?

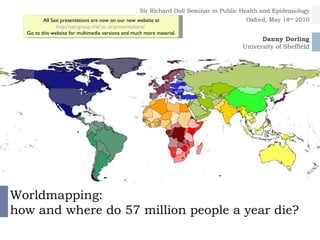
  • 1. Sir Richard Doll Seminar in Public Health and Epidemiology Oxford, May 18th2010 The Slideshare version of this presentation does not show animations. Please go to our website for the original file and additional audio material: http://sasi.group.shef.ac.uk/presentations/ Danny DorlingUniversity of Sheffield Worldmapping:how and where do 57 million people a year die?
  • 2. Live and let die According to the Global Burden of Disease Study there are approximately 57 million people dying a year: 57,000,000 a year; these are 157,000 a day; or 2 persons dying every second. This presentation shows,why there is someone dying every half second; This presentation shows, how the world looks likewhen health, disease, and death are put onto maps; This presentation shows,how unequal health is distributed globally...
  • 3. How healthy is the world?Mapping Health General overview
  • 4. Public Health Spending 2228 billion PPP US$, $39,000 per death per year
  • 5. Private Health Spending 1847 billion PPP US$, $4 for every $5 spent by the state
  • 6. Physicians Working 9.56 million, one physician for every 6 deaths a year
  • 7. Early Neonatal Mortality 3.01 million, one within 7 days of birth for every 3 physicians
  • 8. HIV/AIDS Prevalence 29.22 million, one in every 200 people in the world
  • 9. Malaria Cases 71.9 million, 7.5 cases per physician in the world
  • 10. What are they all dying from?Mapping Causes of Death Grouped in three broad groups of causes Note: For technical reasons the following slides have been modified from their original version. The original presentation with full screen maps can be downloaded from our website at http://sasi.group.shef.ac.uk/presentations/
  • 11. Preventable Deaths people who died from most preventable (communicable infections, maternal, perinatal and nutritional conditions) in one year
  • 12. Cause of Death:Often Preventable Deaths 18,475,000 a year; 51,000 a day; one every 2 seconds...
  • 13. Causes of Death(continued) Tuberculosis 1,570,000 a year; 4,301 a day; one every 20 seconds... Infectious and Parasitic Disease 10,988,000 a year; 30,000 a day; one every 3 seconds... STDs Excluding HIV 180,000 a year; 493 a day; one every 3 minutes... HIV/AIDS 2,920,000 a year; 8,000 a day; one every 11 seconds...
  • 14. Causes of Death(continued) Chlamydia 9,415 a year; 26 a day; one every 56 minutes... Syphilis 157,000 a year; 430 a day; one every 3 minutes... Diarrhoea 1,871,000 a year; 5126 a day; one every 17 seconds... Gonorrhoea 959 a year; 3 a day; one every 9 hours...
  • 15. Causes of Death(continued) Whooping Cough 294,000 a year; 805 a day; one every 2 minutes... Vaccine Preventable Deaths 1,121,000 a year; 3,071 a day; one every 28 seconds... Diphtheria 5,452 a year; 15 a day; one every 1½ hours... Tetanus 214,000 a year; 586 a day; one every 2½ minutes...
  • 16. Causes of Death(continued) Measles 607,000 a year; 1,663 a day; one every 52 seconds... Polio 831 a year; 2 a day; one every 10½ hours... Hepatitus B 103,000 a year; 282 a day; one every 5 minutes... Meningitis 173,000 a year; 474 a day; one every 3 minutes...
  • 17. Causes of Death(continued) Malaria 911,000 a year; 2,496 a day; one every 35 seconds... Hepatitus C 54,000 a year; 148 a day; one every 10 minutes... Sleeping sickness 48,000 a year; 132 a day; one every 11 minutes... Local Tropical Diseases 158,000 a year; 433 a day; one every 3 minutes...
  • 18. Causes of Death(continued) Schistosomiasis 44,000 a year; 121 a day; one every 12 minutes... Chagas Disease 15,000 a year; 41 a day; one every 35 minutes... Elephantiasis 417 a year; one every 21 hours... Leishmaniasis 51,000 a year; 140 a day; one every 10 minutes...
  • 19. Causes of Death(continued) Dengue 19,000 a year; 52 a day; one every 28 minutes... Leprosy 6,168 a year; 17 a day; one every 1½ hours... Intestinal Worm Infection 12,000 a year; 33 a day; one every 44 minutes... Japanese Encephalitis 14,000 a year; 38 a day; one every 38 minutes...
  • 20. Causes of Death(continued) Whipworm Infection 3,019 a year; 8 a day; one every 3 hours... Roundworm Infection 3,410 a year; 9 a day; one every 2½ hours... All Respiratory Infection Deaths 4,026,000 a year; 11,030 a day; one every 8 seconds... Hookworm Disease 2,941 a year; 8 a day; one every 3 hours...
  • 21. Causes of Death(continued) Nose and Throat Infection 76,000 a year; 208 a day; one every 7 minutes... Pneumonia 3,947,000 a year; 10,814 a day; one every 8 seconds... Deaths of Women from Pregnancy 510,000 a year; 1397 a day; one every minute... Ear Infection 3,596 a year; 10 a day; one every 2½ hours...
  • 22. Causes of Death(continued) Low Birth Weight Related 1,271,000 a year; 3,482 a day; one every 25 seconds... Deaths of Babies from Childbirth 2,465,000 a year; 6,753 a day; one every 13 seconds... All Nutritional Deficiences Deaths 485,000 a year; 1,329 a day; one every 65 seconds... Birth Injury Related 725,000 a year; 1,986 a day; one every 44 seconds...
  • 23. Causes of Death(continued) Vitamin A Deficiency 23,000 a year; 63 a day; one every 23 minutes... Deaths from Starvation 260,000 a year; 712 a day; one every 2 minutes... Iodine Deficiency 6,536 a year; 18 a day; one every 80 minutes... Iron Deficiency Anaemia 137,000 a year; 375 a day; one every 4 minutes...
  • 24. Causes of Death(continued) All Cancer Deaths 7,145,000 a year; 19,575 a day; one every 4 seconds... Non-Communicable Illnesses 33,630,000 a year; 92,137 a day; one every second... Throat Cancer 450,000 a year; 1,233 a day; one every 70 seconds... Mouth Cancer 318,000 a year; 871 a day; one every 99 seconds...
  • 25. Causes of Death(continued) Bowel Cancer 624,000 a year; 1,710 a day; one every 50 seconds... Stomach Cancer 857,000 a year; 2,348 a day; one every 37 seconds... Pancreas Cancer 231,000 a year; 633 a day; one every 2 minutes... Liver Cancer 623,000 a year; 1,707 a day; one every 50 seconds...
  • 26. Causes of Death(continued) Skin Cancer 66,000 a year; 181 a day; one every 8 minutes... Lung Cancer 1,248,000 a year; 3,419 a day; one every 25 seconds... Cancer of the Cervix 239,000 a year; 655 a day; one every 2 minutes... Breast Cancer 478,000 a year; 1,310 a day; one every 66 seconds...
  • 27. Causes of Death(continued) Ovary Cancer 135,000 a year; 370 a day; one every 4 minutes... Cancer of the Uterus 71,000 a year; 195 a day; one every 7 minutes... Bladder Cancer 179,000 a year; 490 a day; one every 3 minutes... Prostate Cancer 269,000 a year; 737 a day; one every 2 minutes...
  • 28. Causes of Death(continued) Leukaemia 265,000 a year; 726 a day; one every 2 minutes... Lymphoma 334,000 a year; 915 a day; one every 94 seconds... Diabetes 987,000 a year; 2,704 a day; one every 32 seconds... Other Tumour Deaths 149,000 a year; 408 a day; one every 3½ minutes...
  • 29. Causes of Death(continued) Brain Disorder 1,112,000 a year; 3,047 a day; one every 28 seconds... Endocrine and other disorders 242,000 a year; 663 a day; one every 2 minutes... Manic-depression 733 a year; 2 a day; one every 12 hours... Depression Related 13,000 a year; 36 a day; one every 40 minutes...
  • 30. Causes of Death(continued) Epilepsy 125,000 a year; 342 a day; one every 4 minutes... Schizophrenia 23,000 a year; 63 a day; one every 23 minutes... Dementias 396,000 a year; 1,085 a day; one every 80 seconds... Alcohol Use Disorders 91,000 a year; 249 a day; one every 6 minutes...
  • 31. Causes of Death(continued) Multiple Sclerosis 16,000 a year; 44 a day; one every 33 minutes... Parkinson Disease 99,000 a year; 271 a day; one every 5 minutes... Post Traumatic Stress Disorder 56 a year; one every 6½ days... Drug Use Disorders 86,000 a year; 236 a day; one every 6 minutes...
  • 32. Causes of Death(continued) Glaucoma 102 a year; one every 86 days... Eye and Ear Disease 3,249 a year; 9 a day; one every 2½ hours... Rheumatic Heart Disease 329,000 a year; 901 a day; one every 96 seconds... All Cardiovascular Disease Deaths 16,778,000 a year; 45,963 a day; one every 2 seconds...
  • 33. Causes of Death(continued) Heart Attack 7,219,000 a year; 19,778 a day; one every 4 seconds... Stroke 5,536,000 a year; 15,167 a day; one every 6 seconds... Inflammatory Heart Disease 405,000 a year; 1,110 a day; one every 78 seconds... Hypertensive Heart Disease 914,000 a year; 2,504 a day; one every 35 seconds...
  • 34. Causes of Death(continued) Chronic Bronchitis 2,766,000 a year; 7,578 a day; one every 11 seconds... Respiratory Disease 3,722,000 a year; 10,197 a day; one every 9 seconds... Digestive Tract Diseases 1,973,000 a year; 5,405 a day; one every 16 seconds... Asthma 241,000 a year; 660 a day; one every 2 minutes...
  • 35. Causes of Death(continued) Cirrhosis Of The Liver 789,000 a year; 2,162 a day; one every 40 seconds... Peptic Ulcer Disease 265,000 a year; 726 a day; one every 2 minutes... Genitourinary Tract Diseases 849,000 a year; 2,326 a day; one every 37 seconds... Appendicitis 22,000 a year; 60 a day; one every 24 minutes...
  • 36. Causes of Death(continued) Deaths from enlarged Prostate 32,000 a year; 88 a day; one every 16 minutes... Kidney Disease 678,000 a year; 1,858 a day; one every 47 seconds... All Musculoskeletal Disease Deaths 106,000 a year; 290 a day; one every 5 minutes... Skin Disease 69,000 a year; 189 a day; one every 7½ minutes...
  • 37. Causes of Death(continued) Osteoarthritis 4,736 a year; 13 a day; one every 111 minutes... Rheumatoid Arthritis 25,000 a year; 68 a day; one every 21 minutes... Oral Conditions 1,608 a year; 4 a day; one every 5½ hours... Birth Defects 494,000 a year; 1,353 a day; one every 64 seconds...
  • 38. Causes of Death(continued) All Accidental Deaths 3,560,000 a year; 9,753 a day; one every 9 seconds... All Injury Deaths 5,183,000 a year; 14,200 a day; one every 6 seconds... Accidental Poisoning 352,000 a year; 964 a day; one every 90 seconds... Road Traffic Accident 1,195,000 a year; 3,274 a day; one every 26 seconds...
  • 39. Causes of Death(continued) Deaths from Fires 312,000 a year; 855 a day; one every 101 seconds... Deaths from Falls 393,000 a year; 1,077 a day; one every 80 seconds... Other Accidental Injury Deaths 925,000 a year; 2,534 a day; one every 34 seconds... Deaths from Drowning 384,000 a year; 1,052 a day; one every 82 seconds...
  • 40. Causes of Death(continued) Suicide 878,000 a year; 2,405 a day; one every 36 seconds... All Non-accidental Deaths 1,622,000 a year; 4,444 a day; one every 19 seconds... War 171,000 a year; 468 a day; one every 3 minutes... Murder 560,000 a year; 1,534 a day; one every 56 seconds...
  • 41. War Deaths people who died from war in one year
  • 42. When are they all dying?Mapping the Age of Death Sorted from oldest to youngest people
  • 43. Age of Death: 100+ 92,585 deaths; 254 per day; one every 341 seconds...
  • 44. Age of Death: 95-99 484,416 deaths; 1,327 per day; one every 65 seconds...
  • 45. Age of Death: 90-94 1,563,557 deaths; 4,284 per day; one every 20 seconds...
  • 46. Age of Death: 85-89 3,144,797 deaths; 8,616 per day; one every 10 seconds...
  • 47. Age of Death: 80-84 4,381,231 deaths; 12,003 per day; one every 7 seconds...
  • 48. Age of Death: 75-79 5,410,001 deaths; 14,822 per day; one every 6 seconds...
  • 49. Age of Death: 70-74 5,416,482 deaths; 14,840 per day; one every 6 seconds...
  • 50. Age of Death: 65-69 4,548,376 deaths; 12,461 per day; one every 7 seconds...
  • 51. Age of Death: 60-64 3,615,847 deaths; 9,906 per day; one every 9 seconds...
  • 52. Age of Death: 55-59 2,802,369 deaths; 7,678 per day; one every 11 seconds...
  • 53. Age of Death: 50-54 2,412,379 deaths; 6,609 per day; one every 13 seconds...
  • 54. Age of Death: 45-49 2,098,466 deaths; 5,749 per day; one every 15 seconds...
  • 55. Age of Death: 40-44 1,788,164 deaths; 4,899 per day; one every 18 seconds...
  • 56. Age of Death: 35-39 1,652,503 deaths; 4,527 per day; one every 19 seconds...
  • 57. Age of Death: 30-34 1,606,806 deaths; 4,402 per day; one every 20 seconds...
  • 58. Age of Death: 25-29 1,496,071 deaths; 4,099 per day; one every 21 seconds...
  • 59. Age of Death: 20-24 1,273,937 deaths; 3,490 per day; one every 25 seconds...
  • 60. Age of Death: 15-19 870,915 deaths; 2,386 per day; one every 36 seconds...
  • 61. Age of Death: 10-14 536,950 deaths; 1,471 per day; one every 59 seconds...
  • 62. Age of Death: 5-9 863,022 deaths; 2,364 per day; one every 37 seconds...
  • 63. Age of Death: 1-4 2,556,272 deaths; 7004 per day; one every 12 seconds...
  • 64. Age of Death: Infants (aged under 1) 8,142,016 deaths; 22,307 per day; one every 4 seconds...
  • 65. From Map to Cartogram Infant Mortality
  • 66. World maps by the Worldmapper team Slides and animations by Benjamin Hennig Slides available on http://sasi.group.shef.ac.uk/presentations/ For a definition of all the causes and the data see www.worldmapper.org New estimates on causes of death are due to be released by the end of 2010 in the Global Burden of Diseases, Injuries, and Risk Factors Study http://www.globalburden.org Credits
  • 67. World maps by the Worldmapper team Slides and animations by Benjamin Hennig Slides available on http://sasi.group.shef.ac.uk/presentations/ Infant mortality in affluent countries at the end of the nineteenth century rose as charitable giving rose. Mortality then fell as public anger at social injustice was converted into political change. Political change which then used medical knowledge. References Dorling, D. (2007). Worldmapper: The human anatomy of a small planet. PLoS Medicine 4(1), 13-18. Dorling, D. and Barford, A. (2007). Shaping the world to illustrate inequalities in health. Bulletin of the World Health Organisation, 85(11), 821-900. Dorling, D. and Barford, A. (2007). The shape of global causes of death. International Journal of Health Geographies, 6(48). Credits

Editor's Notes

  1. Worldmapping: how and where do 57 million people a year die?Lecture by Danny DorlingSir Richard Doll Seminar in Public Health and EpidemiologyOxford, May 18th 2010Slides created by Benjamin Hennig