1. A
s regional interconnections among water
supply systems increase statewide in
order to meet potable water demands, a
greater understanding of water quality issues is
needed. The Peace River Manasota Regional
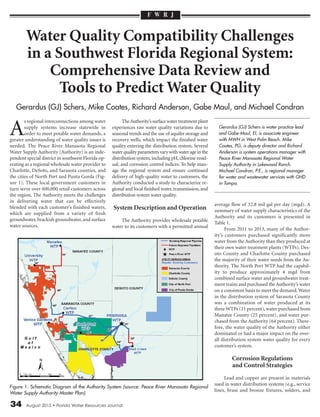
Water Supply Authority (Authority) is an inde-
pendent special district in southwest Florida op-
erating as a regional wholesale water provider to
Charlotte, DeSoto, and Sarasota counties, and
the cities of North Port and Punta Gorda (Fig-
ure 1). These local government customers in
turn serve over 600,000 retail customers across
the region. The Authority meets the challenges
in delivering water that can be effectively
blended with each customer’s finished waters,
which are supplied from a variety of fresh
groundwater, brackish groundwater, and surface
water sources.
TheAuthority’ssurfacewatertreatmentplant
experiences raw water quality variations due to
seasonal trends and the use of aquifer storage and
recovery wells, which impact the finished water
quality entering the distribution system. Several
waterqualityparametersvarywithwaterageinthe
distribution system,including pH,chlorine resid-
ual, and corrosion control indices. To help man-
age the regional system and ensure continued
delivery of high-quality water to customers, the
Authority conducted a study to characterize re-
gional and local finished water, transmission, and
distribution system water quality.
System Description and Operation
The Authority provides wholesale potable
water to its customers with a permitted annual
average flow of 32.8 mil gal per day (mgd). A
summary of water supply characteristics of the
Authority and its customers is presented in
Table 1.
From 2011 to 2013, many of the Author-
ity’s customers purchased significantly more
water from the Authority than they produced at
their own water treatment plants (WTPs). Des-
oto County and Charlotte County purchased
the majority of their water needs from the Au-
thority. The North Port WTP had the capabil-
ity to produce approximately 4 mgd from
combined surface water and groundwater treat-
ment trains and purchased the Authority’s water
on a consistent basis to meet the demand.Water
in the distribution system of Sarasota County
was a combination of water produced at its
three WTPs (11 percent), water purchased from
Manatee County (25 percent), and water pur-
chased from the Authority (64 percent). There-
fore, the water quality of the Authority either
dominated or had a major impact on the over-
all distribution system water quality for every
customer’s system.
Corrosion Regulations
and Control Strategies
Lead and copper are present in materials
used in water distribution systems (e.g., service
lines, brass and bronze fixtures, solders, and
Water Quality Compatibility Challenges
in a Southwest Florida Regional System:
Comprehensive Data Review and
Tools to Predict Water Quality
Gerardus (GJ) Schers, Mike Coates, Richard Anderson, Gabe Maul, and Michael Condran
Gerardus (GJ) Schers is water practice lead
and Gabe Maul, EI, is associate engineer
with MWH in West Palm Beach. Mike
Coates, PG, is deputy director and Richard
Anderson is system operations manager with
Peace River Manasota Regional Water
Supply Authority in Lakewood Ranch.
Michael Condran, P.E., is regional manager
for water and wastewater services with GHD
in Tampa.
F W R J
Figure 1. Schematic Diagram of the Authority System (source: Peace River Manasota Regional
Water Supply Authority Master Plan).
34 August 2015 • Florida Water Resources Journal
2. fluxes). The U.S. Environmental Protection
Agency (EPA) Lead and Copper Rule, or LCR [1]
established action levels (ALs) for lead and cop-
per of 0.015 and 1.3 mg/L, respectively, at the
90th percentile level. Three typical strategies can
be used for corrosion control [2, 3]:
1. Calcium hardness adjustment (calcium car-
bonate precipitation)
2. Alkalinity and pH adjustment (carbonate
passivation)
3. Corrosion inhibitor treatment (inhibitor pas-
sivation)
Calcium hardness adjustment involves the
addition of a calcium source,such as calcium hy-
droxide (Ca[OH]2), calcium chloride (CaCl2), or
calcium bicarbonate (Ca[HCO3]2),to precipitate
calcium carbonate as a protective film on the in-
side of the pipe. A second strategy involving an
increase in alkalinity and pH can be used to form
a passivating metal carbonate film on the pipe
interior through the addition of chemicals such
as soda ash, sodium bicarbonate, and caustic
soda. Both of these corrosion control strategies
are monitored through the calcium carbonate
equilibrium, based on the pH needed to main-
tain a calcium carbonate precipitation potential
(CCPP) of 4-10 mg/L as CaCO3.A third strategy
consists of adding a corrosion inhibitor, such as
phosphate. Divalent lead reacts with orthophos-
phate and forms a passivating lead orthophos-
phate film on the pipe interior. Orthophosphate
appears to be most effective when the system pH
is maintained within the range of 7.2 to 7.8, with
increased phosphate precipitation metals like
calcium above pH values of 7.8 [2]. Orthophos-
phate addition is beneficial for copper corrosion
control, but a higher orthophosphate dose and
residual are required, compared to lead corro-
sion control.
The Authority and City of North Port ad-
just alkalinity and pH as a corrosion control
strategy and monitor the effectiveness through
calcium carbonate equilibrium. Desoto County
and Charlotte County purchased the majority
of finished water from the Authority, so these
systems also relied on a calcium carbonate equi-
librium approach to corrosion control. Sarasota
County dosed a phosphate-based corrosion in-
hibitor at each WTP and, therefore, the calcium
carbonate equilibrium is not relevant.
Nitrification, an undesirable microbial
process in the distribution system, can promote
biofilm and decrease the disinfectant residual.
Biofilm grows when organisms feed off nutri-
ents in the drinking water, producing hydrogen
ions that consume alkalinity and drop the pH.
Systems with chloramine secondary disinfec-
tants would benefit from keeping the pH above
8.0 to limit chloramine decay (Figure 2) and
avoid dichloramines. They also would benefit
from maintaining a total chlorine residual of 2.0
mg/L or greater, which is generally regarded as
the level below which a system may begin to ex-
perience nitrification and biofilm growth [4, 5, 6].
Systems with chloramine secondary disinfec-
tants and phosphate corrosion inhibitors com-
promise between the two competing pH ranges.
Finished Water Quality
Characterization
Data from 2011 through 2013 were col-
lected and analyzed for disinfection residuals,
pH, hardness, alkalinity, calcium carbonate
equilibrium, organic content, inorganic ions,
and corrosion inhibitors. The water quality data
sources included monthly operating reports, an-
nual Safe Drinking Water Act reporting (for pri-
mary and secondary contaminants), summaries
of treatment facilities, routine lead and copper
monitoring, disinfection byproduct (DBP) re-
porting, and total coliform and pH sampling in
the distribution network. The Authority and its
customers used chloramines as the secondary
disinfectant residual. A spreadsheet calculation
tool developed by Trussell Technologies was
used to estimate CCPP based on given water
quality [7]. A summary table of finished water
quality of the Authority and its customers is
provided in Table 2.
Table 1. Summary of Water Supply Characteristics of the Authority and its Customers
Figure 2.
Distribution Diagram
for Chloramine
Species with pH
(source: Palin, 1950).
Continud on page 36
Florida Water Resources Journal • August 2015 35
3. 36 August 2015 • Florida Water Resources Journal
The Peace River Manasota Regional Water
Supply Authority Water Treatment Plant
The mineralization levels in the Authority’s
raw water varied seasonally, which resulted in
seasonally variable finished water. Total hard-
ness and total dissolved solids (TDS) were
higher during summer months and lower dur-
ing winter months. The finished water total or-
ganic carbon (TOC) varied between 3.9 and 5.2
mg/L. The combined chlorine residual was
maintained near the maximum residual disin-
fectant level (MRDL) of 4.0 mg/L. No additional
phosphate-based corrosion control chemical
was used. The water quality parameters that sig-
nificantly affected CCPP are presented over time
as monthly averages in Figure 3.
Total hardness, on a monthly average, fluc-
tuated between 180 mg/L as CaCO3 in the sum-
mer and 140 mg/L as CaCO3 in the winter; note
that this is opposite to raw water hardness,
which can be explained by the average detention
time of six months in the raw water reservoirs.
Alkalinity was between 40 and 50 mg/L as
CaCO3. Finished water pH levels were fairly
consistent between 8.0 and 8.3. Langelier Index
(LI) and CCPP values were calculated using the
water quality based on monthly averages (Fig-
ure 4). Overall CCPP trends coincided with sea-
sonal variations in hardness and TDS and varied
from -0.9 to 0.8 mg/L as CaCO3. Levels dropped
below 0 mg/L as CaCO3 during periods of low
hardness levels. Therefore, the Authority’s fin-
ished water typically was neutral with respect to
corrosion, but slight seasonal variations were
observed.
North Port Water Treatment Plant
The City of North Port used both surface
water and brackish groundwater reverse osmo-
sis (RO) treatment trains. In the City’s surface
water source (Myakkahatchee Creek), the fin-
ished water mineralization varied seasonally as
a result of similar raw water mineralization
trends (Figure 5).
In contrast to the Authority’s seasonal
trends, the North Port WTP finished water had
higher mineralization in the winter and lower
mineralization in the summer. Total hardness
fluctuated between approximately 70 to 470
mg/L as CaCO3 in the period of review (2011 to
2013). The addition of a brackish groundwater
RO system in March 2013 helped the City to de-
crease TDS, hardness, and TOC by blending
treated flows from the surface water treatment
and RO treatment processes.. The combination
of seasonally variable water quality and water
sources resulted in variable corrosion indices in
the final blended water (Figure 6). The CCPP,
based on monthly averages, ranged from -5.1 to
24.6 mg/L as CaCO3.
Sarasota County Carlton Water Treatment
Plant
Finished water quality from the electro-
dialysis reversal (EDR) system was more consis-
tent than finished water from a surface water
system because the product water quality could
be controlled by setting a target conductivity.
Based on the calculated conductivity levels, TDS
in the treated water ranged from 350 to 400
mg/L; calcium, magnesium, and sulfate concen-
trations were the major constituents of TDS.
Caustic soda was used to adjust the pH of the
treated water to 7.5-8.0. The finished water was
slightly aggressive based on calculated CCPP
values, but a 50/50 poly/orthophosphate blend
was used for corrosion control. Chloramine lev-
Figure 3. Variations in Alkalinity, Hardness, Total Dissolved Solids, and pH in Peace River Mana-
sota Regional Water Supply Authority Water Treatment Plant Finished Water Based on Average
Monthly Values.
Figure 4. Variations in Corrosion Indices in Peace River Manasota Regional Water Supply Au-
thority Water Treatment Plant Finished Water Based on Average Monthly Values.
Continued from page 35
Continud on page 38
4. 38 August 2015 • Florida Water Resources Journal
els in the finished water were maintained be-
tween 4.8 and 6.8 mg/L. Alkalinity levels were
around 45 mg/L as CaCO3, which provided a
moderate buffering capacity in the finished
water.
Sarasota County University Water Treatment
Plant
The brackish groundwater was treated with
acidification with carbon dioxide,degasification,
and disinfection prior to blending with Manatee
County finished water, typically in a 5:1 ratio,
with Manatee County water as the major com-
ponent. The TDS concentrations in the ground-
water were approximately 1,100 mg/L, but the
TDS was diluted down in the blended product.
The University wellfield compliance point was
downstream of the blending point, so detailed
treated water quality data of the University WTP
were not available. The main constituents of the
TDS in the groundwater were sulfate (at 700
mg/L), calcium (at 195 mg/L as CaCO3), and
magnesium (at 95 mg/L as CaCO3). The County
used chloramines for secondary disinfection,
with typical levels between 3.5 and of 4.5 mg/L.
Alkalinity levels were typically 60 mg/L as
CaCO3.A 50/50 poly/orthophosphate blend was
used for corrosion control.
Sarasota County Venice Gardens Water Treat-
ment Plant
Brackish groundwater was withdrawn from
10 production wells to feed multiple single-stage
RO trains. Finished water TDS concentrations
ranged from 350 to 375 mg/L from the RO sys-
tem. The County bypassed approximately 5 per-
cent of the RO feed flow to remineralize the RO
permeate. Also here, a 50/50 poly/orthophos-
phate blend was used for corrosion control.
Chloramines were dosed for secondary disin-
fection, with typical levels of 4.0 to 4.5 mg/L.Al-
kalinity levels were around 20 mg/L as CaCO3
which provided limited buffering capacity in the
finished water.
Distribution Water Quality
Characterization
Distribution water quality data were ob-
tained from monthly operating reports, lead and
copper sampling, DBPs, and total coliform sam-
pling in the distribution networks. All lead and
copper results were significantly below the ALs
(Figure 7).All systems dosed combined chlorine
at levels close to or just above the MRDL of 4.0
mg/L. In addition, each customer operated chlo-
rine booster stations in the distribution systems.
All utilities reported concentrations of total tri-
halomethanes (TTHMs) and haloacetic acids
Figure 5. Seasonal Variation of Total Dissolved Solids, Hardness, Alkalinity, and pH in Surface
Water Treatment Train in the City of North Port Water Treatment Plant Finished Water.
Figure 6. Variations in Corrosion Indices in North Port Water Treatment Plant Finished Water Based
on Average Monthly Values.
Table 2. Range of Finished Water Quality of the Authority and its Customers in 2011-2013.
Continued from page 36
5. Florida Water Resources Journal • August 2015 39
(HAA5) at less than 51 µg/L and 40 µg/L, re-
spectively. These concentrations were below the
respective maximum contaminant levels (MCLs)
of 80 µg/L and 60 µg/L, respectively.
Several systems used blending of several
water supply sources to help meet system goals
that can include meeting flow demands and off-
setting water quality that may exceed goals from
one or more sources. For example, brackish
groundwater sources that were treated with
membrane processes, such as reverse osmosis,
might be used for blending to decrease TDS of
a water source that has a higher TDS.
Peace River System
Residual chloramine levels dropped from
4.0 mg/L at the WTP to around 3.3 to 3.7 mg/L
at the delivery points with the Authority's cus-
tomers, showing a chloramine decay of approx-
imately 0.5 mg/L within hours. The level and
speciation of minerals in water, including pH
levels, do not change significantly between WTP
and distribution system sample points. As a
wholesale provider, the Authority only meas-
ured lead and copper in the finished water, and
levels were below ALs.
Charlotte County
Charlotte County purchased approxi-
mately 95 percent of its potable water from the
Authority; the remainder was produced at the
Burnt Store WTP for an isolated service area.
The County’s distribution system is extensive
and has low-flow zones with long hydraulic res-
idence time (i.e., water age of multiple days),
which resulted in significant chloramine decay.
The distribution of total chlorine residual sam-
ples in the Charlotte County system compared
to the Authority’s finished water shows that the
County maintained a residual greater than 0.8
mg/L in 90 percent of samples in 2013 (Figure
8a). The County managed this issue by execut-
ing a flushing program. The pH distribution of
the Charlotte County system and the Author-
ity’s finished water showed that, in all samples
taken in 2013, the median (i.e., 50 percentile)
pH drop in the distribution system was 0.5
units, from 8.1 to 7.6 (Figure 8b). Using the me-
dian pH value of 7.6, the CCPP of the water in
the distribution system was calculated to be -2.6
mg/L as CaCO3 compared to 0.1 mg/L as CaCO3
in the Authority’s finished water. The possible
reasons for pH drops in the distribution systems
were explained earlier and include chloramine
decay, biofilm growth, and nitrification.
City of North Port
The City of North Port purchased and
blended water from the Authority routinely
Figure 7. Lead and Copper 90th Percentile Concentrations in the Distribution Systems of the Au-
thority and its Customers (Charlotte County was not available).
Figure 8. Percentile Distribution in Charlotte County Distribution System of (a) Total Chlorine Resid-
ual and (b) pH.
Figure 9. Percentile Distribution in North Port Distribution System of (a) Total Chlorine Residual and
(b) pH.
(a)
(a)
(b)
(b)
Continud on page 40
6. 40 August 2015 • Florida Water Resources Journal
with production from its own surface water and
brackish water RO treatment plants. The distri-
bution of total chlorine residual samples in the
North Port system, compared to the Authority’s
finished water, shows that the City maintained a
residual greater than 1.0 mg/L in 90 percent of
samples in 2013 (Figure 9a). The pH of the
North Port distribution system water was, as ex-
pected, in between the pH of City of North Port
and the Authority’s finished waters (Figure 9b).
The calculated CCPP of the distribution system
water ranged from -7.5 to 1.6 mg/L as CaCO3.
In 2013, the City modified the pressures at
the remote booster pump stations to create bet-
ter blending of North Port WTP water with the
Authority’s water, which improved the CCPP in
the distribution system compared to North Port
WTP finished water. The distribution system
was designed for build-out conditions, and with
the large numbers of residential lots remaining
undeveloped, the system experienced long hy-
draulic residence time. Similarly to Charlotte
County, the City managed this issue by execut-
ing a flushing program.
To predict the water quality in the distri-
bution system under varying operation regimes,
a spreadsheet was developed to combine water
quality parameters for given blending scenarios.
Four blending scenarios with North Port and
the Authority finished water are summarized in
Figure 10. The following operation scenarios
were modeled using average monthly values:
1. Only North Port surface water and ground-
water blended, current ratio (4:1 blending
ratio)
2. North Port blend from Scenario 1 with cur-
rent Authority allocation added (4:2:1
SW:PR:GW)
3. Blending from Scenario 2 with groundwater
treatment train flow doubled (2:1:1
SW:PR:GW)
4. Blending from Scenario 2 with one quarter
of surface water flow (1:2:1 SW:PR:GW)
The figure presents average finished water
quality from each of the three sources that sup-
ply the North Port system. Each blending sce-
nario shows the weighted average of selected
water quality parameters based on the stated
blending ratios (blended pH was calculated
using a weighted average of the hydrogen con-
centration). Lastly, blending ratios were calcu-
lated using finished water quality for the months
that experienced the minimum and maximum
CCPP values.
The calculated CCPP values were 6.5, -11.7,
and 0 on average in 2012 for the North Port sur-
face water, North Port groundwater treatment
train, and the Authority’s water, respectively.
Blending scenarios showed a CCPP range of be-
tween -5.7 and -2.4 mg/L as CaCO3, on average.
The CCPP in each scenario is below the recom-
mended guideline of 4 to 10 mg/L as CaCO3.
Sarasota County
The Sarasota County distribution system
receives water from the County’s three WTPs,
Manatee County, and the Authority. Manatee
County water is blended at the University Well-
field WTP in the north part of the service area,
and Authority water is blended at Carlton WTP
in the southeast part of the service area; the
Venice WTP serves a small part of the southwest
service area. The distribution of total chlorine
residual samples in the Sarasota County System
shows that the County maintained a residual
greater than 1.8 mg/L in 90 percent of samples
in 2013 (Figure 11a). From sample points taken
in 2013, the median pH residual decreased ap-
proximately 0.2 units (from 8.0 to 7.8) in the
distribution system (Figure 11b). The County
(a) (b)
Continued from page 39
Figure 10. Summary Graphic of Blending Scenarios for City of North Port.
Figure 11. Percentile Distribution in Sarasota County Distribution System of (a) Total Chlorine Resid-
ual and (b) pH.
7. Florida Water Resources Journal • August 2015 41
managed chloramine decay and a decrease in
pH with a flushing program using autoflushers.
Two blending scenarios for Sarasota
County and Peace River are summarized in Fig-
ure 12. The blending ratios included 10:1 and
5:1 from the Authority to Carlton WTP water
that reflected operational regimes in 2013. The
CCPP values varied from -1.0 to -0.2 mg/L as
CaCO3 for all blending scenarios, but the slight
corrosiveness of the water toward lead and cop-
per was effectively controlled by a phosphate-
based corrosion inhibitor. The average and
range of pH values of the different blend sce-
narios are shown, as well as the recommended
pH ranges for phosphate and chloramines.
Calcium Carbonate Precipitation
Potential Comparison
A summary of CCPP values in the finished
and distribution waters of the Authority and its
customers is presented in Table 3. None of the
systems produced finished water with a CCPP
in the recommended range of 4 to 10 mg/L as
CaCO3. The finished water of the Authority var-
ied between -0.9 and 0.8 mg/L as CaCO3, which
is close to equilibrium conditions with respect
to calcium carbonate equilibrium. Similarly to
the Authority, finished water from the North
Port WTP surface water treatment train varied
considerably with respect to calcium carbonate
equilibrium as a result of varying mineralization
in the finished water. The CCPP, on a monthly
average basis, varied only about 2 mg/L as
CaCO3 in the Authority’s finished water, but
varied about 24 mg/L as CaCO3 in North Port
WTP surface-water finished water. Based on all
blending scenarios, distribution system water in
the North Port system ranged from moderately
corrosive to slightly supersaturated. Charlotte
County purchased the most water from the Au-
thority, but the pH decrease in the distribution
system made the water moderately corrosive.
The corrosiveness of Sarasota County finished
water was managed by corrosion inhibitors in
the finished water and distribution system.
Calcium Carbonate Precipitation
Potential Blending Model
Although the previous graphics were useful
in calculating CCPP for a given blending ratio,
a visual analysis was needed to convey a more
intuitive understanding of the water quality
variations for a range of blending ratios. A
CCPP blending model was created to predict the
water quality of blended water from two sources
for an average, minimum, and maximum case.
Example charts (Figures 13a and 13b) show
CCPP for all possible blending combinations of
Carlton WTP and the Authority WTP finished
waters, and North Port WTP and the Authority
WTP finished waters, using average, minimum,
and maximum total hardness water quality data
based on monthly averages.
The shaded area of the graph shows the op-
erational range of blending that was used in
2013. The graph was combined with the CCPP
spreadsheet to calculate the predicted corro-
siveness of the modeled blended water quality.
After the water quality of each water source is
entered, the graph calculates the blended water
quality at several different blending ratios, and
graphs them using a PivotChart. For instance,
when the blend ratio between North Port WTP
and Peace River WTP increases (moving to left
in Figure 13b) the finished water may become
slightly more corrosive in terms of CCPP. This
may be corrected at the North Port WTP by dos-
ing additional caustic soda in the blended water
to create slightly higher pH values to maintain
CCPP values in the recommended range.
The model has the potential to be used as a
predictive tool for operational decision making.
Scenarios of theoretical water quality set points
can be entered to predict blended water quality
and verify possible treatment changes to main-
tain optimal distribution water quality with
CCPP values within the recommended range.
Predictive water quality would be valuable to the
Authority and its customers in several situations
when the parties either:
1. Modify the water blend ratio due to opera-
tional and maintenance needs, such as pip-
ing and valve rehabilitation and replacement
requiring partial shutdowns.
2. Modify the water blend ratio due to water
production needs and changing demands.
3. Add a new source or interconnection.
4. Observe a (sudden) change in water quality
in one or more water sources.
Conclusions
Water quality compatibility was evaluated
in the finished water, transmission, and distri-
bution systems of the Authority and its cus-
tomers. For period 2011-2013, water quality
parameters, including pH, chloramine residu-
als, DBPs, lead, copper, and calculated CCPP
values, were analyzed in each system and water
quality models were developed for several ap-
plicable blending scenarios. The data analysis
Figure 12. Summary Graphic of Blending Scenarios for Sarasota County.
Table 3. Calcium Carbonate Precipitation Potential Comparison Summary of Finished
and Distribution Waters of the Authority and its Customers Based on Monthly Averages.
Continud on page 42
8. 42 August 2015 • Florida Water Resources Journal
supports the following conclusions:
1. The ability of Charlotte County, DeSoto
County, Sarasota County, and the City of
North Port to meet typical water supply goals
is highly dependent on the Authority’s oper-
ations and water quality because the Author-
ity supplies a major portion of the water in
these systems.
2. The Authority, City of North Port, Charlotte
County, and Desoto County relied on a cal-
cium carbonate equilibrium approach for
corrosion control, while Sarasota County
dosed phosphate-based corrosion control in-
hibitors.
3. Finished water hardness and TDS of the sur-
face water treatment plants varied seasonally
due to variations in mineralization of the raw
water. Total hardness levels varied by ap-
proximately 50 mg/L as CaCO3 in the Au-
thority WTP finished water and varied by
approximately 400 mg/L as CaCO3 in North
Port WTP finished water. The seasonal
changes in calcium hardness, alkalinity, and
pH resulted in variable CCPP values in the
finished waters.
4. Water treatment plants with brackish
groundwater sources in North Port and Sara-
sota County had more consistent finished
water quality (independent of the season)
and lower TDS values when blended with
surface water, but the calculated CCPP val-
ues suggested slightly corrosive water.
5. Although the CCPP values in the finished
water of the utilities were slightly outside of
the recommended CCPP range of 4 to 10
mg/L as CaCO3, all utilities measured lead
and copper concentrations that were well
below the ALs, regardless of corrosion con-
trol strategy. Also, levels of DBPs were in
compliance with regulatory standards in the
distribution systems.
6. Chloramine was typically dosed at or near
the MRDL of 4.0 mg/L and each customer’s
system had several chloramine booster sta-
tions. Customers use flushing programs to
control water age, creating significant water
losses. The median pH value decreased from
8.1 to about 7.7 to 7.8 in each distribution
system, and the 10th percentile of chloramine
residual ranged from 0.8 to 1.8 mg/L. Calcu-
lated CCPP values of water in the distribu-
tion systems indicated water that ranged
from moderately corrosive (-7.4 mg/L as
CaCO3) to slightly supersaturated (1.0 mg/L
as CaCO3).
7. The CCPP blending models were created as
predictive distribution water quality tools to
actively plan for events in the distribution
system, including maintenance work and
change in water demands, which may modify
the water blend ratios, add a new source or
interconnection, or cause a (sudden) change
in water quality of one or more sources.
References
1. EPA, Lead and Copper Rule (1991).
2. AWWA, Manual M58, Internal Corrosion
Control in Water Distribution Systems
(2011).
3. EPA, Office of Groundwater and Drinking
Water: Revised Guidance Manual for Select-
ing Lead and Copper Control Strategies
(2003).
4. EPA, Office of Groundwater and Drinking
Water: Nitrification (2002).
5. EPA, Guidance Manual, Alternative Disin-
fectants and Oxidants, Chapter 6 Chlo-
ramines (1999).
6. Geo. Clifford White, Handbook of Chlori-
nation and Alternative Disinfectants, 4th
Edition (1998).
7. Trussell Technologies, CaCO3 Indices Mod-
eling Spreadsheet (2009).
Figure 13a. Examples of Results of Dynamic Water Quality Blending Analysis for Carlton Water
Treatment Plant.
Figure 13b. Examples of Results of Dynamic Water Quality Blending Analysis for North Port Water
Treatment Plant.
Continued from page 41
![fluxes). The U.S. Environmental Protection
Agency (EPA) Lead and Copper Rule, or LCR [1]
established action levels (ALs) for lead and cop-
per of 0.015 and 1.3 mg/L, respectively, at the
90th percentile level. Three typical strategies can
be used for corrosion control [2, 3]:
1. Calcium hardness adjustment (calcium car-
bonate precipitation)
2. Alkalinity and pH adjustment (carbonate
passivation)
3. Corrosion inhibitor treatment (inhibitor pas-
sivation)
Calcium hardness adjustment involves the
addition of a calcium source,such as calcium hy-
droxide (Ca[OH]2), calcium chloride (CaCl2), or
calcium bicarbonate (Ca[HCO3]2),to precipitate
calcium carbonate as a protective film on the in-
side of the pipe. A second strategy involving an
increase in alkalinity and pH can be used to form
a passivating metal carbonate film on the pipe
interior through the addition of chemicals such
as soda ash, sodium bicarbonate, and caustic
soda. Both of these corrosion control strategies
are monitored through the calcium carbonate
equilibrium, based on the pH needed to main-
tain a calcium carbonate precipitation potential
(CCPP) of 4-10 mg/L as CaCO3.A third strategy
consists of adding a corrosion inhibitor, such as
phosphate. Divalent lead reacts with orthophos-
phate and forms a passivating lead orthophos-
phate film on the pipe interior. Orthophosphate
appears to be most effective when the system pH
is maintained within the range of 7.2 to 7.8, with
increased phosphate precipitation metals like
calcium above pH values of 7.8 [2]. Orthophos-
phate addition is beneficial for copper corrosion
control, but a higher orthophosphate dose and
residual are required, compared to lead corro-
sion control.
The Authority and City of North Port ad-
just alkalinity and pH as a corrosion control
strategy and monitor the effectiveness through
calcium carbonate equilibrium. Desoto County
and Charlotte County purchased the majority
of finished water from the Authority, so these
systems also relied on a calcium carbonate equi-
librium approach to corrosion control. Sarasota
County dosed a phosphate-based corrosion in-
hibitor at each WTP and, therefore, the calcium
carbonate equilibrium is not relevant.
Nitrification, an undesirable microbial
process in the distribution system, can promote
biofilm and decrease the disinfectant residual.
Biofilm grows when organisms feed off nutri-
ents in the drinking water, producing hydrogen
ions that consume alkalinity and drop the pH.
Systems with chloramine secondary disinfec-
tants would benefit from keeping the pH above
8.0 to limit chloramine decay (Figure 2) and
avoid dichloramines. They also would benefit
from maintaining a total chlorine residual of 2.0
mg/L or greater, which is generally regarded as
the level below which a system may begin to ex-
perience nitrification and biofilm growth [4, 5, 6].
Systems with chloramine secondary disinfec-
tants and phosphate corrosion inhibitors com-
promise between the two competing pH ranges.
Finished Water Quality
Characterization
Data from 2011 through 2013 were col-
lected and analyzed for disinfection residuals,
pH, hardness, alkalinity, calcium carbonate
equilibrium, organic content, inorganic ions,
and corrosion inhibitors. The water quality data
sources included monthly operating reports, an-
nual Safe Drinking Water Act reporting (for pri-
mary and secondary contaminants), summaries
of treatment facilities, routine lead and copper
monitoring, disinfection byproduct (DBP) re-
porting, and total coliform and pH sampling in
the distribution network. The Authority and its
customers used chloramines as the secondary
disinfectant residual. A spreadsheet calculation
tool developed by Trussell Technologies was
used to estimate CCPP based on given water
quality [7]. A summary table of finished water
quality of the Authority and its customers is
provided in Table 2.
Table 1. Summary of Water Supply Characteristics of the Authority and its Customers
Figure 2.
Distribution Diagram
for Chloramine
Species with pH
(source: Palin, 1950).
Continud on page 36
Florida Water Resources Journal • August 2015 35](data:image/gif;base64,R0lGODlhAQABAIAAAAAAAP///yH5BAEAAAAALAAAAAABAAEAAAIBRAA7)