1. 24 August 2016 • Florida Water Resources Journal
T
he City of West Palm Beach (City)
plans to upgrade its 47-mil-gal-per-
day (mgd) conventional surface water
treatment plant (WTP) treatment train by
adding a new ultraviolet (UV) disinfection
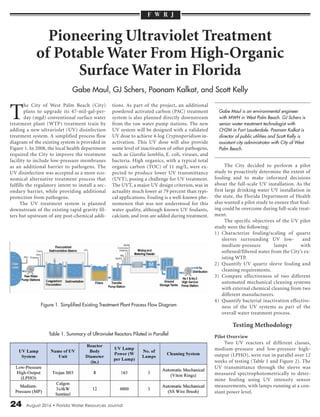
treatment system. A simplified process flow
diagram of the existing system is provided in
Figure 1. In 2008, the local health department
required the City to improve the treatment
facility to include low-pressure membranes
as an additional barrier to pathogens. The
UV disinfection was accepted as a more eco-
nomical alternative treatment process that
fulfills the regulatory intent to install a sec-
ondary barrier, while providing additional
protection from pathogens.
The UV treatment system is planned
downstream of the existing rapid gravity fil-
ters but upstream of any post-chemical addi-
tions. As part of the project, an additional
powdered activated carbon (PAC) treatment
system is also planned directly downstream
from the raw water pump stations. The new
UV system will be designed with a validated
UV dose to achieve 4-log Cryptosporidium in-
activation. This UV dose will also provide
some level of inactivation of other pathogens,
such as Giardia lamblia, E. coli, viruses, and
bacteria. High organics, with a typical total
organic carbon (TOC) of 11 mg/L, were ex-
pected to produce lower UV transmittance
(UVT), posing a challenge for UV treatment.
The UVT, a major UV design criterion, was in
actuality much lower at 79 percent than typi-
cal applications. Fouling is a well-known phe-
nomenon that was not understood for this
water quality, although known UV foulants,
calcium, and iron are added during treatment.
The City decided to perform a pilot
study to proactively determine the extent of
fouling and to make informed decisions
about the full-scale UV installation. As the
first large drinking water UV installation in
the state, the Florida Department of Health
also wanted a pilot study to ensure that foul-
ing could be overcome during full-scale treat-
ment.
The specific objectives of the UV pilot
study were the following:
1) Characterize fouling/scaling of quartz
sleeves surrounding UV low- and
medium-pressure lamps with
softened/filtered water from the City’s ex-
isting WTP.
2) Quantify UV quartz sleeve fouling and
cleaning requirements.
3) Compare effectiveness of two different
automated mechanical cleaning systems
with external chemical cleaning from two
different manufacturers.
4) Quantify bacterial inactivation effective-
ness of the UV systems as part of the
overall water treatment process.
Testing Methodology
Pilot Overview
Two UV reactors of different classes,
medium-pressure and low-pressure high-
output (LPHO), were run in parallel over 12
weeks of testing (Table 1 and Figure 2). The
UV transmittance through the sleeve was
measured spectrophotometrically to deter-
mine fouling using UV intensity sensor
measurements, with lamps running at a con-
stant power level.
Pioneering Ultraviolet Treatment
of Potable Water From High-Organic
Surface Water in Florida
Gabe Maul, GJ Schers, Poonam Kalkat, and Scott Kelly
Gabe Maul is an environmental engineer
with MWH in West Palm Beach. GJ Schers is
senior water treatment technologist with
CH2M in Fort Lauderdale. Poonam Kalkat is
director of public utilities and Scott Kelly is
assistant city administrator with City of West
Palm Beach.
F W R J
Figure 1. Simplified Existing Treatment Plant Process Flow Diagram
Table 1. Summary of Ultraviolet Reactors Piloted in Parallel
2. Florida Water Resources Journal • August 2016 25
Feed water for the UV reactors was
pumped from the filtered water flume using
a self-priming centrifugal pump and split
into two parallel UV reactors (Figure 3). The
UV reactor effluents were pumped back into
the main process at the filter influent chan-
nel. The chlorine injection point used in
phase 2 was located before the UV influent
pump and the first sample point.
Flow rates were set to match the 4-log
Cryptosporidium dose in accordance with the
full-scale design and assuming 80 percent
UVT. The LPHO unit was only validated using
the older German DVGW standard to the 3-
log inactivation dose, and was assumed to be
conservative enough to be equivalent to 4-log
inactivation of the newer Ultraviolet Disin-
fection Guidance Manual from the U.S. Envi-
ronmental Protection Agency (EPA). The flow
rate was maintained and the maximum power
level was set throughout the pilot operation.
The UV dose was allowed to drop as fouling
and lamp aging occurred in order to use the
UV intensity decline to measure fouling.
This mode of operation is contrary to
full-scale operation where lamp power would
be increased to compensate for changes in
fouling, lamp aging, and UVT to maintain
the required UV dose. The UV operation was
divided into two phases: phase 1 without
cleaning, and phase 2 without cleaning but
with free chlorine pretreatment (Table 2).
Phase 2 was originally planned to include
regular cleaning at different time intervals,
but was changed when fouling was discov-
ered to be low.
Data Collection and Analytical Methods
The UV sleeve fouling, water quality, UV
intensity readings, metal concentrations in
acid used to clean fouled sleeves, and micro-
bial activity before and after the UV reactors
were recorded during the pilot operation.
Sleeve fouling was measured with offline UV
transmittance measurements using an Agi-
lent Cary 60 UV-Vis spectrophotometer op-
tics bench (Figure 3b). The three sleeves from
each UV reactor were removed, rinsed with
deionized (DI) water and left to air dry, then
measured along with a spare reference sleeve
of both types on the optics bench on a bi-
weekly basis. A fouling factor (FF) was calcu-
lated for each sleeve measurement using the
following equation:
FF = (Tmeasurement /Treference)0.5
Where Tmeasurement is the UV trans-
mittance (percent) through the sleeve and
Treference is the UV transmittance (percent)
(a) (b)
(a) Low-Pressure High-Output and (b) Medium-Pressure
(a) (b)
(a) Ultraviolet Pilot Setup and (b) Cary 60 Optics Bench for Measurement of the Ultraviolet Sleeve
Table 2. Schedule of Testing Phases
Figure 4. Ultraviolet Intensity Sensor Measurements for Low-Pressure High-Output ReactorContinued on page 26
Figure 2. Photos of Installed Ultraviolet Pilot Reactors
Figure 3. Pilot Testing Photos
3. 26 August 2016 • Florida Water Resources Journal
through a spare reference sleeve as measured
on the optics bench.
Bacterial activity was tested at five dif-
ferent locations at the water treatment plant
using three tests:
1. Colilert - total coliform and E. coli pres-
ence/absence
2. MI Agar - colony counts of total coliform
and E. coli
3. Heterotrophic plate counts (HPC) - colony
counts of total heterotrophic bacteria
At the end of phases 1 and 2, one sleeve
from each reactor from each UV system was
rinsed with 12 percent phosphoric acid and
analyzed for metals. The impact of PAC pre-
treatment of raw water on the UVT of settled
and filtered water was simulated using jar tests.
Results: Ultraviolet Intensity
Sensor Measurements
The UV intensity sensor measurements
over the course of the UV pilot operation for
the LPHO reactor and medium-pressure
(MP) reactor are provided in Figures 4 and 5,
respectively. Both LPHO and MP reactor UV
intensity decreased steadily during phase 1,
and decreased at a greater rate during phase
2. At the beginning of phase 2, there was a
sharp increase in UV intensity of both reac-
tors. One possible explanation for the in-
crease in UV intensity could be biofilm
removal of the pilot with the free chlorine
clean and subsequent free chlorine residual
through the reactors (biogrowth in the pump
and piping was suspected as detailed in the
discussion section under phase 1).
Results: Phase 1 Sleeve
Fouling – No Cleaning
Average values of fouling factors of the
sleeves from MP and LPHO reactors are sum-
marized over phase 1 in Figure 6.
The average fouling factors of both sys-
tems remained above 97 percent over 1000
lamp hours during phase-1 operation, which
indicates low fouling. Lamp hours in the
graph have been adjusted by subtracting the
burn-in period hours for each reactor of ap-
proximately 85 hours. At the end of the burn-
in period, all sleeves were to be cleaned
according to vendor recommendation with
Lime-A-Way and denatured alcohol; however,
the cleaning left a residue that was recorded
as a drop in UV transmittance on the optics
bench as shown on the first data point. This
method of cleaning was discontinued after
Figure 5. Ultraviolet Intensity Sensor Measurements for Medium-Pressure Reactor
Figure 6. Ultraviolet Reactor Sleeve Fouling for Phase 1 – No Cleaning
Note: Error bars represent the standard deviation of the three sleeve fouling factors. After the measurement at
540 lamp hours without cleaning, one sleeve from each reactor broke and was replaced. Therefore, the sleeve
measurements after 540 hours are shown as the average of the remaining two sleeves and do not show stan-
dard deviations.
Figure 7. Ultraviolet Reactor Sleeve Fouling for Phase 2 – No Cleaning
Continued from page 25
4. Florida Water Resources Journal • August 2016 27
the initial cleaning at the end of the burn-in
period; instead, the sleeves were completely
replaced after phase 1. Flow decreased slowly,
day to day, on the LPHO unit, and valves were
adjusted twice to compensate, indicating a
possible increase in headloss in the pipes.
Results: Phase 2 Sleeve
Fouling – No Cleaning with
Free Chlorine Pretreatment
Average values of fouling factors of the
three sleeves of MP and LPHO reactors are
summarized over the course of phase 2 in
Figure 7.
The average fouling factor of the MP sys-
tem remained above 98 percent after 540
hours, while the average fouling factor of the
LPHO system decreased to approximately 86
percent after 540 hours without cleaning. The
LPHO sleeves were more fouled toward the
end that was closer to the reactor inlet as
measured using the optics bench.
Results: Fouling Characterization
Concentrations of some known foulants
in the feed water to the UV reactors were:
• Iron ~220 µg/L
• Total hardness 115 mg/L as calcium car-
bonate (CaCO3)
• TOC 6.5 mg/L
In the acid rinsate of LPHO and MP
sleeves, absolute concentrations were meas-
ured at the end of phase 1 and phase 2, as
well as the blank, which are presented in Fig-
ure 8. The exact absolute concentrations were
not important, but the relative magnitude of
concentrations show that the acid rinsate
measured from the sleeves was significantly
greater than the blank.
The major metal foulants measured in
the acid rinsate of fouled sleeves in phase 1
were primarily iron (~40 percent) and zinc,
followed by aluminum, and copper to a lesser
extent (Figure 9). The major metal foulant
measured in the acid rinsate of fouled sleeves
in phase 2 was iron (~75 percent), and the re-
mainder foulants were zinc and copper on
the MP sleeves, and calcium on the LPHO
sleeves (Figure 10).
Results: Powdered Activated
Carbon Jar Testing
The UVT of settled water after pretreat-
ment with PAC ranging from 0 to 40 mg/L is
presented in Figure 11. It increased about 1
Figure 8. Concentrations of Metals in the Acid Rinsate
Note: The blank was measured in phase 2 only. The 6 percent phosphoric acid was used as acid rinsate in phase
1, and 12 percent phosphoric acid was used in phase 2.
Continued on page 28
Figure 10. Foulant Characterization on the Sleeve Acid Rinsate – End of Phase 2
(a) MP (b) LPHO
(a) MP (b) LPHO
Figure 9. Foulant Characterization on the Sleeve Acid Rinsate – End of Phase 1
5. 28 August 2016 • Florida Water Resources Journal
percent with 10 mg/L PAC and about 2.5 per-
cent with 40 mg/L PAC on unfiltered water.
Results: Cleaning
Method Comparison
The UV transmittance measurements
taken before and after the sleeves were
cleaned are presented in Figure 12. The
‘Fouled’ column shows fouling factors of
sleeves operated without cleaning for ap-
proximately 1000 hours and 600 hours for
phases 1 and 2, respectively. The mechanical
clean for the LPHO unit malfunctioned dur-
ing phase 1, so only approximately one-third
of the sleeve was cleaned. Fouling factors of
‘fouled’ sleeves were similar between LPHO
sleeves (e.g., T1 and T2) and similar between
MP sleeves (e.g., C1 and C2).
Sleeve UV transmittance was improved
by acid rinsing between 0 and 10.7 percent
and changed by mechanical cleaning by -0.6
to 6.9 percent. In all cases, except the phase-
1 MP mechanical clean, acid rinsing im-
proved sleeve UV transmittance more than
mechanical cleaning. None of the cleanings
improved sleeve UV transmittance to the
same UV transmittance of the reference
sleeve (100 percent fouling factor).
Results: Microbiological Testing
The MI agar testing results at various
places in the WTP process train are graphed
in Figures 13 and 14 for E. coli and total col-
iform, respectively.
In general, the number of colony form-
ing units (CFU) of total coliform and E. coli
decreased as the water progressed through the
treatment process. E. coli was absent in all
samples measured after the UV reactor, and
undefined (where a colony was not found
during a test that tested <100 mL of sample)
in all samples after the raw water. Total col-
iform was present in measurable quantities in
the raw water, decreased in the flume sample,
and then increased in the UV influent pump
sample. Total coliform was measured after the
UV reactors at 3 CFU/100mL or less on three
separate days at the end of phase 1 and the be-
ginning of phase 2. The HPC results at the
various sampling locations in the plant are
provided in Figure 15.
The HPC results from MP and LPHO
UV reactor effluent water were significantly
less than the samples obtained from other lo-
cations in the full-scale plant. The data
showed higher HPC in the UV influent pump
Figure 12. Comparison of Ultraviolet Sleeve Cleaning Methods
Figure 13. MI E. coli Test Results
Note: Undefined values varied depending upon the volume of the sample tested: 7/28: <10 CFU/100mL; 8/4
- 8/25 : <5 CFU/100mL: 9/8 - 9/22: <2 CFU/100mL.
Figure 11. Settled Water Turbidity at Various Powdered Activated Carbon Pretreatment Doses
Continued on page 30
Continued from page 27
6. 30 August 2016 • Florida Water Resources Journal
location than the flume during phase 1 and a
step decrease in HPC at the UV influent after
chlorination began in phase 2 to below 1000
CFU/mL. Log reduction over the UV reactors
was 1-log to 2-log of plate counts of bacteria,
which are not the same as true log inactiva-
tion. The HPC results were well within the
EPA-recommended limit of 500 CFU/ml for
potable water. During microbiological testing,
E. coli was not detected in any sample after
both UV reactors, total coliform colonies were
less than 3 CFU/100 mL after the UV reactors,
and HPC results showed significant reduction
of total bacteria after both UV reactors.
Discussion of Results
Phase 1
Sleeve fouling measurements declined
less than 3 percent over 1000 hours during
phase 1. This represents low fouling; for com-
parison, the fouling factors in the Hetch
Hetchy pilot study of MP systems decreased
to 80 percent in less than 100 hours (Kim et
al, 2009). The UV intensity decreased by 9
and 18 percent for LPHO and MP systems,
respectively, in that period. Based on sleeve
UV transmittance and UV intensity meas-
urements, fouling is considered low during
Phase 1. Low fouling has positive implica-
tions on maintenance efforts and cost of the
full-scale UV plant.
Biogrowth during phase 1 was suspected
due to several indicators:
S Increase in TOC and color a week after
Phase 1 began.
S Increase in headloss to the LPHO unit
characterized by decreasing flow and re-
quired adjustments of valves.
S Observed odor when pump and upstream
piping was opened.
S Step increase in UV intensity after initial
chlorination.
S Greater bacterial presence via MI total co-
liform and HPC in the UV influent pump
than in the filtered water flume.
S On the second day of operation with
prechlorination, total coliform up to 3
CFU/mL were detected in the LPHO and
MP UV reactors, even though total col-
iform was not detected in the UV influent
pump. Possible biogrowth in piping could
be the source for total coliform hits.
Phase 2
In Phase 2, with free chlorine addition,
sleeve fouling increased greatly for the LPHO
unit, but not for the MP unit. Fouling char-
acterization showed that the increased foul-
ing was ~75 percent iron, and ~ 20 percent
calcium. The increased oxidation potential of
chlorine may have oxidized Fe2+ to Fe3+,
which could have contributed to increased
fouling. Surprisingly, sleeve fouling measure-
ments showed greater fouling in the LPHO
system, but UV intensity showed a greater
rate of decline in the MP system. It appears
that temperature was not the strongest indi-
cator of fouling as previously hypothesized
because MP fouling would have been consis-
tently greater. The difference in velocity may
have led to the different results between
sleeve measurements and UV intensity read-
ings. The UVT did not correlate with any
other water quality parameter tested (data
now shown because of space constraints).
Conclusions
A UV disinfection pilot study was con-
ducted to evaluate preliminary operational
data on a small-scale UV unit in order to ver-
ify the effectiveness of UV disinfection and
to make decisions about the full-scale UV in-
stallation. Two UV reactors of different
classes, one medium-pressure and one low-
pressure high-output, were run in parallel
over 12 weeks of testing. The UV sleeve foul-
ing, water quality of the feed water, UV in-
tensity readings, and microbial activityFigure 15. Heterotrophic Plate Count Results
Figure 14. MI Total Coliform Test Results
Note: The UV Influent samples on 8/25 and 9/8 were undefined because they were tested using less than
100mL. Therefore, the results of these tests were <5 and <2 CFU/100mL, respectively.
Continued from page 28
7. Florida Water Resources Journal • August 2016 31
before and after the UV reactors were meas-
ured. The major findings of the study were:
S The fouling rate of filtered water without
online cleaning was low as measured by
sleeve fouling (<3 percent fouling factor
decline) and UV intensity sensor readings
(percent decline of 9 and 18 percent for
LPHO and MP, respectively) over 1000
hours, even with biogrowth present up-
stream (phase 1).
S The fouling rate of filtered water without
online cleaning was increased by free chlo-
rine pretreatment as measured by sleeve
fouling (fouling factor decline of 16 per-
cent and 4 percent for LPHO and MP, re-
spectively) and UV intensity sensor
readings (percent decline of 18 and 49
percent for LPHO and MP, respectively)
over ~600 hours (phase 2).
S The major metal foulants were primarily
iron, and to a lesser extent, copper, zinc,
and aluminum during phase 1, primarily
iron during phase 2, and to a lesser extent
calcium (LPHO) or zinc and copper (MP).
Relative to the overall foulant amount, the
percentage of iron and calcium increased
during phase 2 when a prechlorine dose
was applied to the reactors.
S Offline acid cleaning improved sleeve UV
transmittance more than online mechani-
cal cleaning, but up to 3 percent of the
fouling factor was irreversible. Periodic
online cleaning is suggested to proactively
prevent irreversible fouling.
S The UV reactors were effective in inacti-
vating a significant portion of bacteria, as
shown in the total coliform, E. coli, and
HPC tests. The HPC results were well
within the EPA-recommended limits of
500 CFU/mL for potable water.
S In jar tests, PAC addition prior to coagu-
lation improved the settled water UVT.
The UVT increased about 1 percent with
10 mg/L PAC and about 2.5 percent with
40 mg/L PAC.
S For full-scale, low fouling is expected for
either MP- or LPHO-type UV reactors,
and both types provided adequate clean-
ing solutions without need for additional
pretreatment. Prechlorination is expected
to increase fouling rates significantly if
used in full-scale. SS