
Recommended
More Related Content
What's hot
What's hot (17)
Similar to Adb brief-128-economic-impact-covid19-developing-asia
Similar to Adb brief-128-economic-impact-covid19-developing-asia (20)
More from FedericaAmbrogi1
More from FedericaAmbrogi1 (17)
Recently uploaded
Recently uploaded (20)
Adb brief-128-economic-impact-covid19-developing-asia
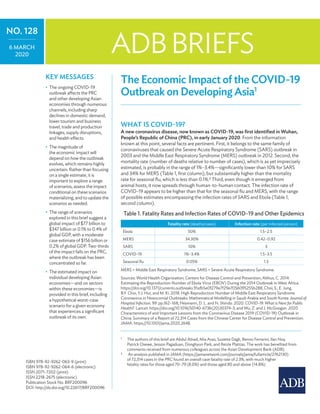
- 1. The Economic Impact of the COVID-19 Outbreak on Developing Asia The Economic Impact of the COVID-19 Outbreak on Developing Asia1 What is COVID-19? A new coronavirus disease, now known as COVID-19, was first identified in Wuhan, People’s Republic of China (PRC), in early January 2020. From the information known at this point, several facts are pertinent. First, it belongs to the same family of coronaviruses that caused the Severe Acute Respiratory Syndrome (SARS) outbreak in 2003 and the Middle East Respiratory Syndrome (MERS) outbreak in 2012. Second, the mortality rate (number of deaths relative to number of cases), which is as yet imprecisely estimated, is probably in the range of 1%–3.4%—significantly lower than 10% for SARS and 34% for MERS (Table 1, first column), but substantially higher than the mortality rate for seasonal flu, which is less than 0.1%.2 Third, even though it emerged from animal hosts, it now spreads through human-to-human contact. The infection rate of COVID-19 appears to be higher than that for the seasonal flu and MERS, with the range of possible estimates encompassing the infection rates of SARS and Ebola (Table 1, second column). 1 The authors of this brief are Abdul Abiad, Mia Arao, Suzette Dagli, Benno Ferrarini, Ilan Noy, Patrick Osewe, Jesson Pagaduan, Donghyun Park, and Reizle Platitas. The work has benefited from comments received from numerous colleagues across the Asian Development Bank (ADB). 2 An analysis published in JAMA (https://jamanetwork.com/journals/jama/fullarticle/2762130) of 72,314 cases in the PRC found an overall case fatality rate of 2.3%, with much higher fatality rates for those aged 70–79 (8.0%) and those aged 80 and above (14.8%). ADBBRIEFS NO. 128 6 March 2020 ISBN 978-92-9262-063-9 (print) ISBN 978-92-9262-064-6 (electronic) ISSN 2071-7202 (print) ISSN 2218-2675 (electronic) Publication Stock No. BRF200096 DOI: http://dx.doi.org/10.22617/BRF200096 Key Messages • The ongoing COVID-19 outbreak affects the PRC and other developing Asian economies through numerous channels, including sharp declines in domestic demand, lower tourism and business travel, trade and production linkages, supply disruptions, and health effects. • The magnitude of the economic impact will depend on how the outbreak evolves, which remains highly uncertain. Rather than focusing on a single estimate, it is important to explore a range of scenarios, assess the impact conditional on these scenarios materializing, and to update the scenarios as needed. • The range of scenarios explored in this brief suggest a global impact of $77 billion to $347 billion or 0.1% to 0.4% of global GDP, with a moderate case estimate of $156 billion or 0.2% of global GDP. Two-thirds of the impact falls on the PRC, where the outbreak has been concentrated so far. • The estimated impact on individual developing Asian economies—and on sectors within these economies—is provided in this brief, including a hypothetical worst-case scenario for a given economy that experiences a significant outbreak of its own. Table 1. Fatality Rates and Infection Rates of COVID-19 and Other Epidemics Fatality rate (deaths/cases) Infection rate (per infected person) Ebola 50% 1.5–2.5 MERS 34.30% 0.42–0.92 SARS 10% 3 COVID-19 1%–3.4% 1.5–3.5 Seasonal flu 0.05% 1.3 MERS = Middle East Respiratory Syndrome, SARS = Severe Acute Respiratory Syndrome. Sources: World Health Organization; Centers for Disease Control and Prevention; Althus, C. 2014. Estimating the Reproduction Number of Ebola Virus (EBOV) During the 2014 Outbreak in West Africa. https://doi.org/10.1371/currents.outbreaks.91afb5e0f279e7f29e7056095255b288; Choi, S., E. Jung, B.Y. Choi, Y.J. Hur, and M. Ki. 2018. High Reproduction Number of Middle East Respiratory Syndrome Coronavirus in Nosocomial Outbreaks: Mathematical Modelling in Saudi Arabia and South Korea. Journal of Hospital Infection. 99. pp.162–168; Heymann, D. L. and N. Shindo. 2020. COVID-19: What is Next for Public Health?. Lancet. https://doi.org/10.1016/S0140-6736(20)30374-3; and Wu, Z. and J. McGoogan. 2020. Characteristics of and Important Lessons from the Coronavirus Disease 2019 (COVID-19) Outbreak in China: Summary of a Report of 72,314 Cases from the Chinese Center for Disease Control and Prevention. JAMA. https://10.1001/jama.2020.2648.
- 2. ADB BRIEFS NO. 128 2 The number of confirmed COVID-19 cases has risen rapidly, first in the PRC and more recently worldwide, quickly surpassing the totals from SARS. As of end-February 2020, COVID-19 had infected 85,403 people in 55 economies, with a global death toll of 2,924. The PRC still accounts for the vast majority—97% of total fatalities and 93% of total cases (Figure 1). As of early March, however, the number of confirmed cases outside the PRC has been rising, particularly in the Republic of Korea (3,150), Italy (888), and Iran (388). Despite having a similar infection rate yet lower fatality rate than SARS, total cases and fatalities from COVID-19 have already far surpassed the totals for the 2003 SARS outbreak (Figure 2). This brief summarizes ADB analysis of the global, regional, and economy- and sector-specific economic impact of the COVID-19 outbreak. It lays out the various channels through which economies will be affected and quantifies the likely magnitudes of the effects under a range of scenarios. It is explicit about the scenario assumptions, and the methods used to calculate the impact. Importantly, the brief provides estimates not only of the global and regional impacts, but also granular details on how individual economies—and sectors within economies—will be affected, including under an illustrative worst-case scenario for an economy that experiences a significant outbreak. The brief concludes by summarizing the actions ADB and its developing member countries (DMCs) are taking to respond to the COVID-19 outbreak. 0 20,000 40,000 60,000 80,000 100,000 20/01/2020 30/01/2020 09/02/2020 19/02/2020 29/02/2020 People's Republic of China Rest of the World Figure 1. Total COVID-19 Cases, 20 Jan–29 Feb 2020 Note: The discrete jump in the series in mid-February is due to the change in the diagnostic criterion applied to identify infections. Sources: CEIC Data Company; and World Health Organization. 2020. Coronavirus disease (COVID-19) situation reports. https://www.who.int/emergencies/ diseases/novel-coronavirus-2019/situation-reports/ (accessed 2 March 2020). Economic activity will be affected in many ways There are several channels through which the COVID-19 outbreak will affect economic activity in the PRC, the rest of developing Asia, and the world. These include a sharp but temporary decline in domestic consumption in the PRC and other outbreak-affected economies, and possibly investment if the outbreak affects views on future business activity; declines in tourism and business travel; spillovers of weaker demand to other sectors and economies through trade and production linkages; supply-side disruptions to production and trade (which are distinct from demand-side shocks spilling over through trade and production linkages); and effects on health such as increased disease and mortality as well as shifts in health care spending. Each of these are taken in turn. Consumption in the PRC will experience a sharp, temporary drop, as occurred during the 2003 SARS outbreak. Perhaps the most important channel through which economic activity is affected is through a sharp but temporary decline in domestic consumption in the PRC resulting from behavioral and/or policy changes—people staying home as a precaution, or because they are told to. This occurred during the SARS outbreak in 2003; retail sales growth in the PRC declined by almost 3 percentage points (pp) during the second quarter of 2003 (Figure 3). The size of the consumption shock in the current outbreak could be
- 3. The Economic Impact of the COVID-19 Outbreak on Developing Asia 3 0 10,000 20,000 30,000 40,000 50,000 60,000 70,000 80,000 90,000 1 3 5 7 9 11 13 15 17 19 21 2325272931 3335373941 4345474951 5355575961 6365676971 7375 SARS deaths COVID-19 infections COVID-19 deaths 26 Apr 2003 29 Feb 2020 17 Mar 2003 20 Jan 2020 SARS infections 7 Aug 2003 3 The precise assumptions about the size and duration of the consumption and/or investment declines under various scenarios are spelled out in the next section, particularly in Table 2. Figure 2. SARS and COVID-19 Infections and Fatalities SARS = Severe Acute Respiratory Syndrome. Source: Asian Development Bank calculations using data from CEIC Data Company and World Health Organization. 2020. Coronavirus disease (COVID-19) situation reports. https://www.who.int/emergencies/diseases/novel-coronavirus-2019/situation-reports/ (accessed 2 March 2020). Jan-02 Feb-02 Mar-02 Apr-02 May-02 Jun-02 Jul-02 Aug-02 Sep-02 Oct-02 Nov-02 Dec-02 Jan-03 Feb-03 Mar-03 Apr-03 May-03 Jun-03 Jul-03 Aug-03 Sep-03 Oct-03 Nov-03 Dec-03 12 11 10 9 8 7 6 5 4 SARS Outbreak (Feb–June 2003) PRC: Retail sales, 2002–2003 (y/y % change) Figure 3. Retail Sales and Personal Consumption Expenditures during SARS Episode SARS = Severe Acute Respiratory Syndrome. Sources: Haver Analytics; CEIC Data Company; WHO; and ADB. bigger than that experienced in 2003, depending on the length and severity of the outbreak and the policy responses taken. In a scenario where the outbreak is more protracted, expands its geographic reach, and/or becomes a recurring phenomenon that affects future business activity materially, a decline in investment is also possible.3
- 4. ADB BRIEFS NO. 128 4 Another important channel though which economies will be affected is tourism and business travel, in the PRC and other economies. Tourism is an important source of revenue for many economies in developing Asia—international tourism receipts account for more than 40% of the gross domestic product (GDP) in economies like Palau and Maldives, for example (Figure 4), and total travel and tourism (including domestic tourism) exceeds 10% of GDP in almost half of ADB’s members.4 Importantly, Chinese visitors now comprise a significant share of tourists in many of these economies, as the number of outbound tourists from the PRC has increased eight-fold from less than 11 million in 2003 to close to 87 million by 2018. In 2018, tourists from the PRC accounted for more than a quarter of total tourist arrivals in Myanmar; Thailand; Mongolia; the Republic of Korea; Viet Nam; Cambodia; Palau; and Hong Kong, China (Figure 5). Tourism arrivals and receipts in many developing Asian economies are expected to decline sharply, as a result of numerous travel bans as well as precautionary behavior. One of the most significant travel bans is the one imposed by the PRC itself. On 24 January 2020, the Government of the PRC imposed a travel ban on all outbound tourism by tour groups.5 This ban, which remains in effect, affects 55% of the PRC’s total outbound tourism.6 In addition, at least 47 economies have imposed bans on travel to and from the PRC, including Australia, the United States, and the Russian Federation.7 Many airlines have suspended or sharply curtailed flights to the PRC as well. It is likely that the PRC will see a decline in tourist arrivals by at least as large as the 7.7% year-on-year decline it experienced in 2003 during the SARS outbreak (Figure 6). As for the rest of developing Asia, even without explicit bans on travel to other Asian economies, non-Chinese tourist arrivals are likely to decline as tourists avoid traveling in the region. During the 2003 SARS outbreak, for example, Southeast and East Asian economies such as Indonesia, Thailand, and the Republic of Korea all saw declines in arrivals from economies outside Asia in 2003, even though they had very few SARS cases (Figure 7).8 These demand shocks can spill over to other sectors and economies via trade and production linkages. The PRC is now the world’s second-largest economy, and accounts for one- third of global growth. It is a major export market for many ADB DMCs, with exports to the PRC being a substantial fraction of GDP (Figure 8). Thus, a drop in demand for goods and services from the PRC is likely to be felt widely. ADB’s 2018 Multiregional Input-Output Table (MRIOT) was used to incorporate spillovers of demand shocks via trade and production linkages. It measures all inter-sector and inter-economy linkages for 62 economies (accounting for 95% of global GDP), with each economy disaggregated into 35 sectors covering both goods and services. Shocks to final demand—in this case, tourism demand and domestic consumption—are transmitted across sectors and borders via trade and production linkages, and one can trace their knock-on effects via the MRIOT.9 There are other important channels, including supply-side disruptions and economic effects through health and health care. There have been substantial production disruptions as a result of forced business closures and the inability of workers to get to work, as well as disruptions to trade and business as a result of border closures, travel bans, and other restrictions on the movement of goods, people, and capital. High-frequency indicators suggest that production in the PRC as a whole fell to 50%–60% of normal levels but is now normalizing. The PRC is a global and regional hub for manufacturing and value chains— many economies export a significant amount of intermediate goods to the PRC, and other economies use inputs from the PRC in their production (Figure 9). As a result, these temporary disruptions can affect production and trade in other economies, although the overall impact may be mitigated by the fact that in some sectors (particularly in manufacturing) production can be ramped up in later periods to make up for lower production in the past. Lastly, there may also be important long-term economic effects through COVID-19’s health impacts on mortality and morbidity, and through changes in (and diversion of) health care 4 World Travel and Tourism Council. 2019. Top 20 Countries - Largest Contribution of Travel and Tourism GDP. https://www.wttc.org/economic-impact/country- analysis/league-table-summaries/ (accessed 6 February 2020). 5 China Daily. 2020. Group tours, travel packages suspended across China. China Daily, 25 Jan. https://www.chinadaily.com.cn/a/202001/25/ WS5e2c486ea3101282172733a9.html (accessed 6 February 2020). 6 World Tourism Organization. 2019. Guidelines for the Success in the Chinese Outbound Tourism Market. Madrid: UNWTO. https://doi. org/10.18111/9789284421138. 7 SCMP Graphics. 2020. Coronavirus: Places and Airlines Restricting China transit. 18 Feb. https://multimedia.scmp.com/infographics/news/world/ article/3051149/coronavirus-travel-restrictions-on-china/index.html (accessed 3 Mar 2020). 8 To calculate the impact of travel bans and precautionary behavior on tourism receipts, the authors used 2018 bilateral tourism arrivals data from the World Tourism Organization. The authors assume travel bans and precautionary travel behavior will last for two months in the best-case scenario; three months in the moderate scenario; and six months in the worse-case scenario (see the discussion that follows, and Table 2). The authors also used declines in tourism observed during the 2003 SARS episode to estimate the decline in inbound tourism to the PRC and other East and Southeast Asian DMCs. The resulting declines in tourism arrivals in each economy are then translated into a decline in tourism receipts, where average spending per tourist is estimated by dividing international tourism receipts in each economy (available up to 2017) with the total number of arrivals. 9 The MRIOT allows the calculation of a technical coefficients matrix A that specifies how much inputs are needed from every sector in every economy, to produce one unit of output in sector i in economy j. Given the vectors of gross outputs x and final demand f (covering all economy–sectors), one can show that x = Ax + f and x = (I – A)-1 f , or Δx = (I – A)-1 Δf. That is, for a given (exogenous) change in final demand one can calculate the impact on gross output and on value-added or GDP, using the matrix (I – A)-1 , also known as the Leontief inverse. More sophisticated general equilibrium models are richer as they allow for substitution, prices adjustments, and policy responses, but results tend to be of the same order as this simpler analysis. Exogenous shocks to supply can also be examined using the MRIOT, but this is not done in this brief.
- 5. The Economic Impact of the COVID-19 Outbreak on Developing Asia 5 0 10 % of GDP 20 30 40 50 60 Papua New Guinea Bangladesh People's Republic of China Uzbekistan India Republic of Korea Kazakhstan Indonesia Brunei Darussalam Kiribati Tajikistan Philippines Nepal Timor-Leste Myanmar Viet Nam Mongolia Bhutan Taipei,China Lao People's Democratic Republic Malaysia Sri Lanka Singapore Solomon Islands Kyrgyz Republic Azerbaijan Federated States of Micronesia Armenia Hong Kong, China Tonga Tuvalu Thailand Marshall Islands Cambodia Georgia Samoa Fiji Vanuatu Palau Maldives Figure 4. International Tourism Receipts by Percentage of the Gross Domestic Product, 2017 Source: World Bank.
- 6. ADB BRIEFS NO. 128 6 0 1 1 1 1 1 1 2 2 2 2 3 3 3 4 5 6 7 9 9 11 11 13 14 16 18 19 21 23 23 24 27 28 31 31 32 33 39 68 0% 10% 20% 30% 40% 50% 60% 70% 80% 90% 100% Cook Islands Armenia Kazakhstan Azerbaijan Uzbekistan Georgia Tajikistan India Marshall Islands Samoa Tuvalu Bhutan Tonga Vanuatu Bangladesh Solomon Islands Fiji Kyrgyz Republic Timor-Leste Papua New Guinea Sri Lanka Malaysia Nepal Federated States of Micronesia Indonesia Philippines Maldives Lao People's Democratic Republic Brunei Darussalam Singapore Taipei,China Myanmar Thailand Mongolia Republic of Korea Viet Nam Cambodia Palau Hong Kong, China Figure 5. Tourist Arrivals from the People’s Republic of China as a Share of Total Arrivals, 2018 Source: World Tourism Organization.
- 7. The Economic Impact of the COVID-19 Outbreak on Developing Asia 7 20,000 40,000 60,000 80,000 100,000 120,000 140,000 1995 1996 1997 1998 1999 2000 2001 2002 2003 2004 2005 2006 2007 2008 2009 2010 2011 2012 2013 2014 2015 2016 2017 2018 Thousands SARS outbreak: -7.7% decrease in tourist arrivals 0 500 1,000 1,500 2,000 2,500 3,000 3,500 4,000 4,500 5,000 0 200 400 600 800 1,000 1,200 1,400 1,600 2000 2001 2002 2003 2004 2005 Republic of Korea Indonesia Thailand (RHS) Figure 6. Inbound Tourist Arrivals in the People’s Republic of China , 1995–2018 Figure 7. Tourist Arrivals from Outside Asia to Selected Developing Member Countries, 2002–2004 Source: World Tourism Organization. SARS = Severe Acute Respiratory Syndrome. Source: World Tourism Organization. expenditures. ADB will be publishing updated estimates in the April 2020 edition of the Asian Development Outlook, and will analyze the longer-term impacts on health, education, and other outcomes in subsequent reports. Given the very large uncertainties, several scenarios are explored The evolution of the COVID-19 outbreak has been—and continues to be—very unpredictable, requiring the use of multiple scenarios. The outbreak originated in the PRC right in the middle of Chunyun—the 40-day festival from 10 January 2020 to 18 February 2020 centered around the Chinese Lunar New Year—which is the biggest annual migration of people on the planet. Authorities in the PRC estimated that during this period, 79 million domestic and international flights were taken by Chinese, alongside 2.4 billion trips by automobile, 440 million by rail, and 45 million by sea.10 This, combined with large celebratory gatherings (including one in Wuhan on 18 January 2020) and a COVID-19 incubation period that the World Health Organization (WHO) estimates at between 1 day and 14 days, has played a large role in the extent of COVID-19’s spread within and outside the PRC. As a result, the analysis explores a number of scenarios described as follows, with detailed assumptions spelled out in Table 2: • Best-case scenario: The PRC outbreak is contained relatively quickly, with travel bans and precautionary behavior abating after 2 months (measured from late January, when the outbreak intensified and quarantines as well as travel and other restrictions were imposed); there is a moderate and relatively short-lived decline in the PRC’s consumption growth of 2.75pp in one quarter only, or 0.7pp for the year relative to a no-outbreak scenario (the size of the retail sales growth decline during the quarter of the SARS episode, relative to previous quarters). • Moderate scenario: The PRC outbreak is more widespread and lasts longer, with travel bans and precautionary behavior abating only after 3 months; there is a larger decline in the PRC’s consumption growth of 2pp for the year, relative to a no-outbreak scenario. • Worse-case scenario: The PRC outbreak is even more protracted, with precautionary behavior and restrictive policies remaining in place for 6 months; there is a large decline in both consumption and investment growth in the PRC, with both down by 2pp relative to a no-outbreak scenario. 10 The State Council of the People’s Republic of China. 2020. Press Conference on 2020 Spring Festival Transport Situation. 9 January. http://www.gov.cn/ xinwen/2020-01/09/content_5467778.htm.
- 8. ADB BRIEFS NO. 128 8 Table 2. Full Set of Scenario Assumptions Duration of travel bans and sharp decline in domestic demand Tourism and travel bans Decline in PRC consumption relative to no-outbreak scenario Decline in PRC investment relative to no-outbreak scenario Decline in [selected DMC] domestic consumption Best case 2 months - Outbound PRC tourism drops by 50% for 2 months - For economies imposing travel bans, no tourism receipts from the PRC for 2 months - Inbound PRC tourism and receipts fall by as much as during the SARS outbreak - Tourism from outside Asia to non-PRC East and Southeast Asian economies falls by as much as during the SARS outbreak (assume peak decline lasts 2 months) 0.7% (based on 2.75pp decline in retail sales growth in 2003 Q3 vs. prior 9 quarters) none none Moderate case 3 months - Outbound PRC tourism drops by 50% for 3 months - For economies imposing travel bans, no tourism receipts from the PRC for 3 months - Inbound PRC tourism and receipts falls by an additional 10% relative to the base case - Tourism from outside Asia to non-PRC East and Southeast Asian economies falls by an additional 10% relative to the best-case scenario (i.e., 1 additional month) 2% (based on 2pp decline in PCE growth in 2003 vs. 2000–2002 average) none none Worse case 6 months - Outbound PRC tourism drops by 50% for 6 months - For economies imposing travel bans, no tourism receipts from the PRC for 6 months - Inbound PRC tourism and receipts falls by an additional 30% relative to the base case - Tourism from outside Asia to non-PRC East and Southeast Asian economies falls by an additional by an additional 40% relative to the best-case scenario (i.e., 4 additional months) 2% (based on 2pp decline in PCE growth in 2003 vs. 2000–2002 average) 2% (protracted outbreak worsens business sentiment) none Hypothetical worst case (specific to each economy) 6 months; plus outbreak in other DMCs lasting 3 months - Outbound PRC tourism drops by 50% for 6 months - For economies imposing travel bans, no tourism receipts from the PRC for 6 months - Inbound PRC tourism and receipts falls by an additional 30% relative to the base case - Tourism from outside Asia to non-PRC East and Southeast Asian economies falls by an additional 40% relative to the best-case scenario (i.e., 4 additional months). 2% (based on 2pp decline in PCE growth in 2003 vs. 2000–2002 average) 2% (protracted outbreak worsens business sentiment) 2% (selected economy only) DMC = developing member country, PCE = personal consumption expenditures, pp = percentage point, PRC = People’s Republic of China, SARS = Severe Acute Respiratory Syndrome. Source: Asian Development Bank staff estimates. CHANNELS SCENARIOS Hypothetical worst-case scenarios for other economies, describing the economic impact if a significant outbreak occurs there are also explored. These should not be interpreted as predictions that an outbreak will occur in the economies. Rather, they are meant to guide policy makers in determining how costly an outbreak could be, so they can properly evaluate the benefits and costs of prevention and early response. These worst-case scenarios are specific to each economy. They assume that if an outbreak occurs in a given economy, that economy will experience a large but temporary decline in consumption growth of 2pp, due to precautionary behaviors and policies. This assumed magnitude of the domestic demand shock may be on the low end, particularly for economies with weak health systems. In those economies, containment and response will be more difficult, and a more protracted outbreak could materialize, with more sizable effects. In addition,
- 9. The Economic Impact of the COVID-19 Outbreak on Developing Asia 9 the long-term costs through other channels such as health and education could also be significant, and those costs are not captured here. These scenarios will be updated, especially if the COVID-19 outbreak expands significantly into a global pandemic. They reflect the fact that the outbreak is still mainly concentrated in the PRC, which still accounts for 97% of fatalities and 93% of total global cases. While outbreaks have now occurred in the Republic of Korea, Italy, and Iran, none is anywhere near the scale of the PRC outbreak at this point. But with the possibility of intensification and of similar outbreaks occurring in additional economies including in developing Asia, ADB will update its assessments as the situation warrants, with the next update coming in the April 2020 edition of the Asian Development Outlook. The global impact ranges from $77 billion to $347 billion, with the PRC accounting for two-thirds of the total The scenarios explored here suggests a global impact ranging from $77 billion to $347 billion or 0.1% to 0.4% of global GDP, with a moderate-case estimate of $156 billion or 0.2% of global GDP (Table 3). Across all three scenarios, the PRC accounts for roughly two-thirds of the global impact; in the moderate scenario the loss to the PRC relative to a no-outbreak scenario is $103 billion, or close to 0.8% of the PRC’s GDP. The rest of the impact on the global economy is split roughly equally between the impact on the rest of developing Asia, and on the rest of the world. The rest of developing Asia would experience a loss of $22 billion or 0.24% of its GDP under the moderate-case scenario. The main channel through which many ADB DMCs will be affected will be through a substantial drop in tourism demand. For an economy like Palau, where international tourism receipts are close to 50% of GDP and over a third of international tourists are from the PRC, the decline in tourism receipts will be substantial, anywhere between 3% of GDP in the best-case scenario to 9% of GDP under the worse-case scenario (Table 4).11 Other economies for which tourism is important such as Cambodia, Maldives, and Thailand are also likely to see a significant decline in tourism revenues. There is already anecdotal evidence that tourism arrivals in many developing Asian economies have dropped by 50%–90% in February 2020 relative to the previous year. Overall, the authors’ estimates suggest a loss of $15 billion–$35 billion in tourism receipts for the PRC and $19 billion–$45 billion in tourism receipts for the rest of developing Asia. Other ADB DMCs that will be significantly affected are those with strong trade and production linkages with the PRC. In addition to the aforementioned tourism-dependent economies, other developing Asian economies such as Hong Kong, China; Mongolia; the Philippines; Singapore; Taipei,China; and Viet Nam will be materially affected by the COVID-19 outbreak (Figure 10). Many of these economies see a significant share of tourists from the PRC and are affected through that channel as well. But as can be seen in Figures 8 and 9, the PRC is also a major destination for these economies’ final as well as intermediate goods and services. The impact under different scenarios on various developing Asian economies, and on sectors within those economies, can be found on the ADB website (https://www.adb.org/covid-19). Developing Asian economies and ADB are responding to the COVID-19 outbreak Most developing Asian economies are already responding to the COVID-19 outbreak in various ways. Many governments have mobilized inter-agency task forces and other coordinating mechanisms to ensure a harmonized response. To help protect their citizens, a number of ADB DMCs have implemented various forms of travel restrictions or advisories, strengthened screening 11 We assume that the decline in tourism receipts in the hypothetical worst case are the same as the ones in the worse case. The use of 2018 bilateral tourism arrivals may lead to an overstatement of the impact on Palau as the PRC’s share of overseas tourists declined from 39% in 2018 to 33% in 2019, and because in that economy, at least, there is evidence the PRC’s tourist spending is below the average for other tourists, many of whom come for extended dive trips. The estimates can be adjusted downward, but it will still amount to a significant decline in international tourism receipts. Table 3. Estimated Global and Regional Impact of COVID-19, under Different Scenarios Best case Moderate case Worse case as % of GDP losses in $ millions as % of GDP losses in $ millions as % of GDP losses in $ millions World -0.089 $76,693 -0.182 $155,948 -0.404 $346,975 People’s Republic of China -0.323 $43,890 -0.757 $103,056 -1.740 $236,793 Developing Asia excluding the People’s Republic of China -0.171 $15,658 -0.244 $22,284 -0.463 $42,243 Rest of the World -0.011 $17,145 -0.020 $30,608 -0.044 $67,938 Source: Asian Development Bank staff estimates.
- 10. ADB BRIEFS NO. 128 10 0 10 20 30 40 50 60 70 80 90 Kiribati Palau Maldives Tonga Bhutan Tuvalu Samoa Timor-Leste Nepal Afghanistan Nauru Vanuatu Sri Lanka Bangladesh India Pakistan Azerbaijan Armenia Fiji Kyrgyz Republic Georgia Marshall Islands Brunei Darussalam Indonesia Philippines Tajikistan Uzbekistan Federated States of Micronesia Kazakhstan Cambodia Papua New Guinea Thailand Myanmar Lao People's Democratic Republic Malaysia Republic of Korea Singapore Viet Nam Turkmenistan Solomon Islands Taipei,China Mongolia Hong Kong, China % of GDP Figure 8. Exports to the People’s Republic of China by Percentage of the Gross Domestic Product, 2016–2018 average Source: CEIC Data Company (accessed 10 February 2020).
- 11. The Economic Impact of the COVID-19 Outbreak on Developing Asia 11 0 2 4 6 8 10 12 14 16 Bhutan Kazakhstan Brunei Darussalam Maldives Bangladesh Nepal Pakistan India Hong Kong, China Sri Lanka Philippines Indonesia Thailand Fiji Singapore Republic of Korea Malaysia Lao People's Democratic Republic Taipei,China Kyrgyz Republic Cambodia Mongolia Viet Nam Upstream Global Value Chain Exposure to the PRC Downstream Global Value Chain Exposure to the PRC Figure 9. Global Value Chain Exposure to the People’s Republic of China, Selected Economies, 2018 GDP = gross domestic product, PRC = People’s Republic of China. Note: The figure shows two indicators of an economy’s exposure to the PRC through global value chains. First, the blue bars show intermediate goods exports of the PRC’s manufacturing sector to each economy, as a share of that economy’s nominal GDP. This is a measure of “upstream” global value chain exposure to the PRC. Second, the orange bars show the share to nominal GDP of the manufacturing sector’s intermediate goods exports to the PRC. This is a measure of “downstream” global value chain exposure to the PRC. The figure shows these indicators for 23 ADB developing member countries with available global value chain data. Sources: Asian Development Bank (ADB) calculations using data from ADB Multiregional Input–Output Tables. procedures and quarantine policies, and undertaken repatriation of their nationals from outbreak-affected economies. Economies are also strengthening their health systems by implementing contact tracing when needed, ensuring adequate supplies of personal protective equipment, strengthening laboratory capacities, and ensuring adequate communication of risks. Importantly, in light of the findings in this brief, many economies are already undertaking supportive macroeconomic policies. Many DMCs have cut interest rates, continuing a cycle of easing that began in 2019, and others are also putting in place supportive fiscal measures. ADB is also supporting its members in responding to the COVID-19 outbreak through finance, knowledge, and partnerships. ADB support on the financing side includes an approved $2 million technical assistance (TA) grant to support the PRC and the Greater Mekong Subregion to prevent, detect, and respond to the ongoing COVID-19 outbreak and future communicable disease outbreaks, and a $2 million regional TA grant for all DMCs to support response activities in the region. Private sector engagement is being supported through an $18.6 million short-term loan facility to a private Chinese pharmaceutical distributor in Wuhan that is responsible for centralized procurement and distribution of medical supplies in Hubei Province, the epicenter of the outbreak. A reallocation of existing resources is also taking place, as ADB has several health projects in the region totaling $469 million and some of this can be reallocated in response to the outbreak. ADB stands ready to provide additional support to DMCs via countercyclical support programs, emergency assistance loans, and other instruments, if needed. On the knowledge side, this initial economic impact assessment is but one part of ADB’s work, and further analysis of the COVID-19 outbreak and its effects will continue as earlier noted in this brief. Furthermore, ADB has been convening partnerships, including various experts’ meetings in partnership with WHO and involving other international partners. ADB is supporting the establishment of an expert advisory group to inform and guide specific DMC responses, regional mitigation and control measures, and ADB’s overall response strategy. The group will also recommend future measures to increase resilience to disease outbreaks.
- 12. ADB BRIEFS NO. 128 12 Moderate impact Best-case impact Worse-case impact Hypothetical worst-case impact -5.0 -4.5 -4.0 -3.5 -3.0 -2.5 -2.0 -1.5 -1.0 -0.5 0.0 MLD CAM THA HKG MON SIN TAP VIE PHI FIJ MAL INO BRU SRI KOR NEP BHU KAZ IND KGZ PAK BAN %ofGDP Figure 10. Impact of COVID-19 on the Gross Domestic Product of Selected Economies BAN = Bangladesh; BHU = Bhutan; BRU = Brunei Darussalam; CAM = Cambodia; FIJ = Fiji; HKG = Hong Kong, China; IND = India; INO = Indonesia; KAZ = Kazakhstan; KGZ = Kyrgyz Republic; LAO = Lao People’s Democratic Republic; MAL = Malaysia; MLD = Maldives; MON = Mongolia; NEP = Nepal; PAK = Pakistan; PHI = Philippines; ROK = Republic of Korea; SIN = Singapore; SRI = Sri Lanka; TAP = Taipei,China; THA = Thailand; VIE = Viet Nam. Notes: Bars indicate the range of estimated impact, with the top of the bar indicating the best-case scenario impact, the midline indicating the moderate- scenario impact, and the bottom of the bar indicating the worse-case scenario impact. The marker shows the economic impact of a hypothetical worst- case scenario where a significant outbreak occurs in that economy. These should NOT be interpreted as a prediction that an outbreak will occur in any of these economies; in most of these economies there are very few cases of COVID-19. Rather, they are meant to guide policy makers in determining how costly an outbreak could be, so they can properly evaluate the benefits and costs of prevention and early response. Source: Asian Development Bank staff estimates.
- 13. The Economic Impact of the COVID-19 Outbreak on Developing Asia 13 Table 4. Decline in Tourism Revenues by Percentage of the Gross Domestic Product in Selected Economies Best case Moderate case Worse case Economy as % of GDP in $ millions as % of GDP in $ millions as % of GDP in $ millions Palau -2.918 -8.3 -4.376 -12.4 -8.753 -24.9 Maldives -1.839 -98.0 -2.758 -147.0 -5.517 -293.9 Cambodia -1.409 -345.7 -1.929 -473.4 -3.490 -856.5 Hong Kong, China -0.906 -3,286.7 -1.178 -4,273.6 -1.995 -7,234.1 Thailand -0.845 -4,265.8 -1.224 -6,180.2 -2.361 -11,923.5 Mongolia -0.773 -101.0 -0.979 -127.9 -1.595 -208.4 Singapore -0.739 -2,692.8 -0.941 -3,427.4 -1.546 -5,631.3 Viet Nam -0.432 -1,059.2 -0.614 -1,504.6 -1.158 -2,840.6 Taipei,China -0.340 -2,068.7 -0.455 -2,764.3 -0.798 -4,851.1 Philippines -0.242 -801.4 -0.352 -1,164.4 -0.681 -2,253.6 Fiji -0.209 -11.6 -0.314 -17.4 -0.627 -34.7 Vanuatu -0.170 -1.6 -0.255 -2.3 -0.511 -4.7 Indonesia -0.166 -1,730.5 -0.207 -2,155.9 -0.329 -3,432.1 Lao People’s Democratic Republic -0.164 -29.5 -0.231 -41.5 -0.431 -77.4 Malaysia -0.163 -584.3 -0.212 -762.0 -0.361 -1,295.0 Myanmar -0.149 -106.3 -0.224 -159.4 -0.448 -318.8 Sri Lanka -0.120 -106.5 -0.180 -159.7 -0.359 -319.4 People’s Republic of China -0.112 -15,241.6 -0.149 -20,215.0 -0.258 -35,135.3 Federated States of Micronesia -0.091 -30.3 -0.137 -45.5 -0.274 -91.0 Brunei Darussalam -0.086 -11.7 -0.113 -15.3 -0.192 -26.1 Republic of Korea -0.073 -1,184.5 -0.103 -1,671.7 -0.193 -3,133.3 Samoa -0.068 -0.6 -0.102 -0.8 -0.205 -1.7 Solomon Islands -0.047 -0.7 -0.071 -1.0 -0.141 -2.0 Tonga -0.046 -0.2 -0.069 -0.3 -0.138 -0.6 Marshall Islands -0.045 -0.1 -0.068 -0.1 -0.135 -0.3 Nepal -0.033 -9.7 -0.050 -14.5 -0.100 -29.1 Timor-Leste -0.021 -0.5 -0.032 -0.8 -0.064 -1.6 Armenia -0.009 -1.2 -0.014 -1.8 -0.028 -3.5 Bhutan -0.009 -0.2 -0.014 -0.4 -0.028 -0.7 Azerbaijan -0.007 -3.4 -0.011 -5.1 -0.022 -10.3 Georgia -0.007 -1.2 -0.010 -1.8 -0.021 -3.6 Tajikistan -0.004 -0.3 -0.005 -0.4 -0.011 -0.8 Kyrgyz Republic -0.003 -0.3 -0.005 -0.4 -0.010 -0.8 India -0.003 -84.2 -0.005 -126.3 -0.009 -252.7 Kazakhstan -0.001 -2.2 -0.002 -3.3 -0.004 -6.6 Bangladesh -0.001 -3.1 -0.002 -4.7 -0.003 -9.4 Papua New Guinea -0.000 -3.0 -0.000 -4.5 -0.000 -8.9 Note: We assume that the decline in tourism receipts in the hypothetical worst case are the same as the ones in the worse case. Source: Asian Development Bank staff estimates.
- 14. ADB BRIEFS NO. 128 14 References Althus, C. 2014. Estimating the Reproduction Number of Ebola Virus (EBOV) during the 2014 Outbreak in West Africa. https://doi. org/10.1371/currents.outbreaks.91afb5e0f279e7f29e705609525 5b288. Brahmbhatt, M., and A. Dutta. 2008. On SARS Type Economic Effects During Infectious Disease Outbreaks. Washington DC: The World Bank. https://elibrary.worldbank.org/doi/pdf/10.1596/1813- 9450-4466. Centers for Disease Control and Prevention (CDC). 2020. 2019-2020 U.S. Flu Season: Preliminary Burden Estimates. https://www.cdc. gov/flu/about/burden/preliminary-in-season-estimates.htm CDC. MERS Clinical Features. 2019. MERS Clinical Features. https:// www.cdc.gov/coronavirus/mers/clinical-features.html. ———. 2017. SARS Basics Fact Sheet. https://www.cdc.gov/sars/about/ fs-sars.html. Chang, D. et al. 2020. Epidemiologic and Clinical Characteristics of Novel Coronavirus Infections Involving 13 Patients Outside Wuhan, China. JAMA. 7 February. https://10.1001/ jama.2020.1623. Chen, N. et al. 2020. Epidemiological and Clinical Characteristics of 99 Cases of 2019 Novel Coronavirus Pneumonia in Wuhan, PRC: A Descriptive Study. The Lancet. 395 (10223). pp. 507–513. February. https://doi.org/10.1016/S0140-6736(20)30211-7. Choi, S. et al. 2018. High Reproduction Number of Middle East Respiratory Syndrome Coronavirus in Nosocomial Outbreaks: Mathematical Modelling in Saudi Arabia and South Korea. Journal of Hospital Infection. 99. pp.162–168. Ghani, A. C. et al. 2005. Methods for Estimating the Case Fatality Ratio for a Novel, Emerging Infectious Disease. American Journal of Epidemiology. 162 (5). pp. 479–486. Heymann, D. L. and N. Shindo. 2020. COVID-19: What is Next for Public Health?. The Lancet. https://doi.org/10.1016/S0140- 6736(20)30374-3. International Monetary Fund. Direction of Trade Statistics. https://www. imf.org/en/Data (accessed 10 February 2019). Noy, I., and S. Shields. 2019. The 2003 Severe Acute Respiratory Syndrome Epidemic: A Retroactive Examination of Economic Costs. ADB Economics Working Paper Series. No. 591. Manila: Asian Development Bank. Wang, C. et al. 2020. A Novel Coronavirus Outbreak of Global Concern. The Lancet. 395 (10223). pp. 470–473. World Tourism Organization (UNWTO). https://www.unwto.org. UNWTO. 2019. Guidelines for the Success in the Chinese Outbound Tourism Market. Madrid. https://doi.org/10.18111/9789284421138. World Health Organization (WHO). Coronavirus Disease (COVID-19) Situation Reports. https://www.who.int/emergencies/diseases/ novel-coronavirus-2019/situation-reports/. WHO. 2003. Consensus document on the epidemiology of severe acute respiratory syndrome (SARS). https://www.who.int/csr/sars/ en/WHOconsensus.pdf. ———. 2020. Middle East Respiratory Syndrome. http://www.emro. who.int/health-topics/mers-cov/mers-outbreaks.html. ———. 2020. Ebola Virus Disease. https://www.who.int/news-room/ fact-sheets/detail/ebola-virus-disease. Wu, J. T., K. Leung, and G. M. Leung. 2020. Nowcasting and Forecasting the Potential Domestic and International Spread of the COVID-19 Outbreak Originating in Wuhan, China: A Modelling Study. The Lancet. https://doi.org/10.1016/S0140- 6736(20)30260-9. Wu, Z. and J. McGoogan. 2020. Characteristics of and Important Lessons from the Coronavirus Disease 2019 (COVID-19) Outbreak in China: Summary of a Report of 72,314 Cases from the Chinese Center for Disease Control and Prevention. JAMA. 395 (10225). pp. 689–697. https://10.1001/jama.2020.2648. The views expressed in this publication are those of the authors and do not necessarily reflect the views and policies of ADB or its Board of Governors or the governments they represent. ADB encourages printing or copying information exclusively for personal and noncommercial use with proper acknowledgment of ADB. Users are restricted from reselling, redistributing, or creating derivative works for commercial purposes without the express, written consent of ADB. Asian Development Bank 6 ADB Avenue, Mandaluyong City 1550 Metro Manila, Philippines Tel +63 2 8632 4444 Fax +63 2 8636 2444 www.adb.org/publications/series/adb-briefs Creative Commons Attribution 3.0 IGO license (CC BY 3.0 IGO) © 2020 ADB. The CC license does not apply to non-ADB copyright materials in this publication. https://www.adb.org/terms-use#openaccess http://www.adb.org/publications/corrigenda pubsmarketing@adb.org About the Asian Development Bank ADB is committed to achieving a prosperous, inclusive, resilient, and sustainable Asia and the Pacific, while sustaining its efforts to eradicate extreme poverty. Established in 1966, it is owned by 68 members— 49 from the region. Its main instruments for helping its developing member countries are policy dialogue, loans, equity investments, guarantees, grants, and technical assistance. ADB Briefs are based on papers or notes prepared by ADB staff and their resource persons. The series is designed to provide concise, nontechnical accounts of policy issues of topical interest, with a view to facilitating informed debate. The Department of Communications administers the series. Notes: In this publication, “$” refers to United States dollars. ADB recognizes “China” as the People’s Republic of China and “South Korea” as the Republic of Korea.