SlideShare a Scribd company logo
1 of 11
Download to read offline
12TH AUSIMM UNDERGROUND OPERATORS’CONFERENCE / ADELAIDE, SA, 24–26 MARCH 2014 205
INTRODUCTION
Development of the Mt Wright Underground Mine
commenced in 2006, with the first production ore in 2007. The
mine plan evolved over the first three years of production in
response to geological, geotechnical and financial challenges
until the sublevel shrinkage with continuous fill mining
method (SLS) was implemented in 2010 (Mackay, 2011).
The key challenges encountered while implementing SLS
can be grouped into safety, geotechnical, mine planning and
geology, drill and blast, and operational control issues. A
number of continuous improvement projects such as material
flow and improved productivity were implemented that
focused both on addressing these issues and maximising the
value of the orebody. A number of the responses to these
challenges are inter-related and resolving one issue often
improved efficiency in a number of other areas. The successful
implementation of the SLS mining method is demonstrated
by the key performance indicators (KPIs) and the financial
results.
A brief summary of each aspect will be presented, along
with the key outcomes achieved.
BACKGROUND
The SLS mining method utilises a production front similar to
a sublevel cave (SLC), except that unconsolidated fill (waste
or low-grade rock) is placed in the top of the cave zone on
top of the broken ore to stabilise the surrounding rock mass
and prevent overlying strata from caving uncontrollably or
catastrophically (Figure 1). At the time of implementation,
limited evidence was found regarding the previous use or
success of this mining method. The evolution of the selection
process and subsequent mine plan for this mining method at
Mt Wright has been described and presented previously by
Mackay (2011) and will not be detailed here.
SAFETY
Similar to SLC, SLS requires personnel to work on the
drawpoint rill during the charging process. Despite the use of
‘charge pads’ at the brow to improve the working environment
(Figure 2), a significant portion of both the lost time injuries
(LTIs) and the total recordable injuries (TRIs) sustained by
underground operators were associated with working on the
rill during the initial stages of the production ramp-up. Two
approaches were taken to improve risk management during
the charging processes:
Sublevel Shrinkage – the MtWright
Story
D Mackay1
, S Long2
and A J Koen3
ABSTRACT
The Mt Wright Underground Mine is located near the town of Ravenswood in North Queensland
and is operated by Carpentaria Gold – a wholly owned subsidiary of Resolute Mining Limited.
Following the evolution of the mine plan through a number of stages, the ‘sublevel shrinkage (SLS)
with continuous fill’ mining method was implemented in 2010 to extract the Mt Wright orebody.
The production front in this mining method is similar to a sublevel cave (SLC) operation; however,
backfill is placed into the top of the production zone as opposed to requiring the overlying strata
to cave.
Continuous fill to replace the void created by extracting the ore was required to manage the
potential risks associated with the proximity of infrastructure to the footwall, associated long-
term stability and air blast potential due to the limited ‘cavability’ of the material within the cave
zone. The available fill material was sourced from a disused waste dump from a previous open pit
operation, which introduced further technical and economic risks associated with dilution from ‘no
grade’ broken material. Procedures and processes to manage these risks have been incorporated
into the operation of the mine.
Despite encountering a number of challenges, the SLS method has been in use for approximately
three years at Mt Wright and has proven to be viable economically, technically and operationally.
This paper will discuss the challenges encountered and what was done to overcome them, the
operational and financial performance to date, along with the outcomes of some successful
continuous improvement projects that have improved the efficiency of the operation.
1.	 MAusIMM(CP), Underground Manager, Carpentaria Gold, PO Box 5802,Townsville Qld 4810. Email: dmackay@rml.com.au
2.	 MAusIMM(CP), Senior Mining Engineer, Carpentaria Gold, PO Box 5802,Townsville Qld 4810. Email: slong@rml.com.au
3.	 MAusIMM, Geology Superintendent, Carpentaria Gold, PO Box 5802,Townsville Qld 4810. Email: akoen@rml.com.au
12TH AUSIMM UNDERGROUND OPERATORS’CONFERENCE / ADELAIDE, SA, 24–26 MARCH 2014
D MACKAY, S LONG AND A J KOEN
206
1.	 a program to implement pre-charging
2.	 improving the charge pad construction.
Pre-charging
Pre-charging one to three rings in advance of the ring to be
fired enables the majority of charging-related work to be
completed from a work basket rather than on the rill. This
practice requires appropriate risk management processes to
effectively manage the hazards associated with working and
using mobile equipment under charged rings. It has been
successfully implemented in a number of SLC operations,
including the Ridgeway Gold Mine in New South Wales
(Wiggin, Trout and Macaulay, 2005). The presence of ‘reactive
ground’ in the Mt Wright orebody resulted in strict sleep time
conditions for the use of explosives, which initially made pre-
charging at Mt Wright operationally challenging. Reactive
ground is defined as rock that undergoes a spontaneous
exothermic reaction after it comes into contact with nitrates
(Australian Explosives Industry Safety Group, 2012).
The presence of reactive ground and subsequent sleep-time
restrictions at Mt Wright was known for some time prior to
the implementation of SLS. It was found at that time that
the oxidation of the ore was limited to an annulus around
the circumference of the blastholes. Elevated temperatures
(ground temperatures above 55°C) were only identified
following the completion of The Bell and the establishment
of the Main Production Zone in 800 Level (Figure 3). The
heat source was found to be from the large mass of broken
ground oxidising above the active production front. Any
production holes that were connected to the broken ground
above (either by a drilling breakthrough or broken ground)
resulted in hot air being drawn down the production holes
due to the negative pressure ventilation system. Eliminating
the air pathway by blocking the hole below the breakthrough
connection would quickly lower the temperature in the hole
to the background rock temperature.
A series of ongoing test work (both in the explosives
supplier’s laboratory and at Mt Wright) was implemented
to test the effectiveness of the inhibited explosives at a range
of temperatures with the aim of extending the sleep time to
allow pre-charging to take place. It was accepted that the
drawpoint turnover rate and the presence of hot and reactive
ground would restrict pre-charging to one ring only. It was
envisaged that ten to 14 days sleep time would be needed
to remain within the sleep time limits while allowing for
operational delays to make pre-charging viable and effective.
An operational trial of pre-charging was completed in a small
area when seven days of sleep time was approved. This trial
proved effective; however, the scheduling impacts of the
sleep time limitations reinforced the need for ten to 14 days
sleep time.
The ongoing testing program identified some samples
ahead of the active production front that had a minor reaction
(temperature rise of approximately 6°C) with the inhibited
explosives at very high background temperatures (80°C). This
resulted in a significant reduction in allowable sleep times
whilethetestingprogramwasrevisitedtoensuretheoutcomes
were reliable at the full range of background temperatures.
These restrictions resulted in suspension of the pre-charging
FIG 1 – Sublevel cave (showing caving of the overlying strata) versus sublevel shrinkage with continuous fill (caving of the overlying strata is minimised).
FIG 2 – A cross-section through a drawpoint, showing a charge
pad against the base of the rill.
12TH AUSIMM UNDERGROUND OPERATORS’CONFERENCE / ADELAIDE, SA, 24–26 MARCH 2014
SUBLEVEL SHRINKAGE – THE MT WRIGHT STORY
207
process until appropriate sleep times could be re-established
with acceptable safety factors. Test work is continuing with
approved sleep times of 14 days up to 55°C (reactive ground),
16 hours at 55–65°C (hot and reactive ground), eight hours
at 65–75°C (very hot and reactive ground), with no charging
above 75°C. The presence of elevated temperatures (above
55°C) emanating from the apex holes and the subsequent
need to block the hole short of design in order to reduce the
temperature below 55°C significantly restricts the ability to
pre-charge without adversely affecting drill and blast results.
Charge pad construction
The delays in implementing the pre-charging process (which
was intended to separate people from the hazards directly at
the brow), increased the importance on rectifying the charge
pad issues. Charge pads (Figure 2) are constructed against the
FIG 3 – A schematic section through the MtWright orebody looking south-east (from the decline).
12TH AUSIMM UNDERGROUND OPERATORS’CONFERENCE / ADELAIDE, SA, 24–26 MARCH 2014
D MACKAY, S LONG AND A J KOEN
208
base of the drawpoint rill to provide a stable working area
for personnel involved in the charging process and to prevent
the rill slumping. Reviewing their construction identified key
factors to be addressed including:
•
• material size distribution – relatively fine material is
needed to construct a suitable work platform
•
• only add to the pad – cutting away material results in a
face that is steeper than the angle of repose and makes the
pad or rill inherently unstable
•
• identifying when constructing a pad alone was insufficient
– if overbreak occurred from the previously fired ring, it
would result in the collars of the next ring to be charged
being very close to the brow and additional stabilisation
may be required prior to personnel access.
A dedicated charge pad construction procedure was
developed and an education process followed to ensure
the relevant personnel understood both the construction
requirements and the potential risks and consequences of
non-compliance.
GEOTECHNICAL
Risk management
Geotechnical risks were identified early in the planning stages
of converting to SLS and appropriate mitigation measures
were in place as part of an overarching hazard management
plan. A number of the geotechnical risks stem from the
proximity of the existing underground infrastructure, which
was based on a sublevel open stoping mining method. The
initial geotechnical monitoring program included:
•
• extensometers (six anchors) across the ore/waste contact
adjacent to the upper areas of The Bell
•
• time domain reflectometry (TDR) cables across the ore/
waste contact and into the pillars between the waste pass
and other mined stopes
•
• probe holes, observation holes and a borehole camera
used in conjunction with the TDR cables
•
• ‘tell-tales’ connected to barricades at the accesses to waste
tipples and ventilation infrastructure
•
• drive closure measurements in development around The
Bell
•
• rock noise reports
•
• cavity monitoring surveys (CMS) of accessible openings
(such as waste tipples).
The migration of the relaxation zone and subsequent
propagation of ground failure was initially much slower
than expected; with the rock mass remaining relatively intact
until approximately 18 months after the establishment of full
production and the mining footprint was fully developed.
The propagation of ground failure then accelerated, however,
remained within expected outcomes. The onset of the
relaxation and subsequent failure prompted the installation of
a real-time seismic monitoring system and the commissioning
of a detailed numerical model. The numerical model was
calibrated using the data collected from the geotechnical
monitoring program and later confirmed by results from the
seismic system and subsequent failures. The accuracy of the
numerical model to predict the time and extent of the failure
propagation was limited by the quality of the data input,
primarily associated with the definition of the extent of the
alteration halo within the granite host rock surrounding the
rhyolite orebody. This halo could not be readily defined from
available drill core and photographs; however, it could be
easily identified in areas that remained accessible once the
relaxation commenced.
The results of the detailed numerical modelling clearly
indicated the potential for the ongoing ground failure to
put critical ventilation infrastructure at risk and provided
justification to replace or bypass areas at risk in order to
minimise future production losses as a result of the failure
propagation.
The unravelling of the mineralised rhyolite around the
previously mined open stopes (Figure 3) was anticipated and
considered beneficial from an operational perspective, as it
provided additional low-grade material in the backfill mix
and reduced the quantity of backfill required. It did, however,
provide a mechanism for ongoing failure propagation.
Operational impacts
The orientation of the longitudinal levels (905–840 Levels,
Figures 3 and 4) with respect to the major principal stress (σ1
)
resulted in significant stresses across the active drawpoints as
they were retreated. This was particularly noticeable in the
865 and 840 Levels as the footprint of the excavation increased
markedly in size. After technical review and implementation
of a new drawpoint sequencing methodology it was found
that by leading with the western drawpoint in the northern
retreat and the eastern drawpoint in the southern retreat
(Figure 4) the majority of the damage was restricted to the
outside holes of the rings in those drawpoints. The effects
of the stress redistribution were then moved further behind
the brow in the other drawpoints, resulting in reduced
brow damage and significantly less operational problems in
the charging process. Although this reduced the ability for
successful interactive draw between drawpoints this was not
considered material as this region of the mine provided the
buffer of ore between the active levels and the waste above
and therefore the recovery was planned to be low.
It was recognised in the initial planning of the SLS that the
orientation of σ1
and the geometry of the orebody were more
favourable to a transverse layout, which would also provide
more active drawpoints to assist with increasing productivity.
FIG 4 – Orientation of the longitudinal levels, showing the orebody outline
and approximate orientation of the Major Principal Stress (σ1
).
12TH AUSIMM UNDERGROUND OPERATORS’CONFERENCE / ADELAIDE, SA, 24–26 MARCH 2014
SUBLEVEL SHRINKAGE – THE MT WRIGHT STORY
209
As mining progressed into the transverse levels (825 Level and
below, see Figures 3 and 5), stress effects continued to impact
on the safety and efficiency of the production front. The first
two transverse levels were commenced in the middle with
the slot retreating north and south, progressively bringing
drawpoints on line as the slot advanced. This sequence was
chosen to provide the highest number of production sources
in the shortest time; however, both the slot and the production
rings were again exposed to the redistribution of the mining
induced stresses.
The slot retreating to the north was plagued with operational
problems due to the major principal stress; however, the
impact was worse than was seen in the longitudinal retreats
above due to the larger footprint and increased depth. These
problems were not experienced in the slot retreating to the
south, possibly due to the slightly different orientation of
the slot and the plunge of the major principal stress. The
retreat of the production rings resulted in stress effects in the
production front similar to what was seen higher in the mine,
but to a lesser extent due to the shadowing effect of the slot
retreat. Following a review of the performance of the first two
transverse levels and some localised numerical modelling,
it was decided to relocate the slot rise to the northern end
and retreat the slot to the south (Figure 6). In addition, the
northern most drawpoint of each level was retreated rapidly
to redistribute the stress well behind the production front in
the remainder of the level (similar to what was done in the
longitudinal levels above). The result was a stress shadow
across the remaining production front that significantly
improved the risk profile of the mining process.
MINE PLANNING AND GEOLOGY
Scheduling
Short- and medium-term scheduling is critical to maintaining
the stress redistribution and the production capacity of
the mine. The current production profile requires 14 to 16
active drawpoints spread across two production levels.
This provides the ability to maintain production rates while
resolving operational issues, while also minimising the time
any drawpoints sit idle, thus preventing the oxidising fines in
the freshly fired ore from reconsolidating. Having the active
drawpoints spread across two production levels also provides
improved management and segregation of interactions
between bogging, haulage, drilling and charging activities.
Scheduling tonnes is a relatively simple process if done
by someone with a good understanding of the operation,
however, reliably forecasting the grade in the short-term has
proven to be difficult due to the grade distribution effects of
the coarse gold within the orebody.
Reconciliation and recovery
Mineralogical examination of the rhyolite orebody shows
that there is a range of gold grain sizes. The presence of
coarse gold presents some challenges to assay repeatability
for both resource definition drilling and more detailed infill
grade control. This can produce significant variations in the
localised grade estimates (on a production ring scale), which
provides limited reliability in short-term grade forecasting.
Despite these localised variations, the ongoing mine to
mill reconciliation process has provided confidence in the
outputs of the block model and the mining recovery factors
applied to it. The proportions of backfill and ore buffer from
the reduced extraction profile in The Bell (Figure 3) reporting
as dilution to the production drawpoints is unknown. This
dilution has been modelled and estimated; however, there
is currently no method of reconciling this with any certainty
due to the number of estimated inputs to the reconciliation.
This has made it difficult to determine the accuracy of the
block model and dilution factors. It is likely that the block
model is underestimating the grade due to the nugget effect
of the coarse gold, which is being offset by increased dilution
to make the final result consistent with the planned recovery.
The planned recovery is determined by evaluating design
shapes against the Resource model and applying extraction
factors (Table 1) to the evaluation results. These outputs
are used to generate the life-of-mine plan and Ore Reserve
FIG 6 – Orientation of the transverse levels, showing the orebody outline,
approximate orientation of the Major Principal Stress (σ1
), and the typical
retreat orientation utilised from 775 Level down to put the operating
drawpoints in a stress shadow.
FIG 5 – Orientation of the transverse levels, showing the orebody outline,
approximate orientation of the Major Principal Stress (σ1
), and the typical
retreat orientation utilised in 825 and 800 Levels.
12TH AUSIMM UNDERGROUND OPERATORS’CONFERENCE / ADELAIDE, SA, 24–26 MARCH 2014
D MACKAY, S LONG AND A J KOEN
210
Estimate. A summary of the production results for each level
is shown in Table 2, with a brief commentary on the variations
between actual and planned extraction provided in Table 3.
The drill and blast process and the drawpoint design have
been the major focus for improving the orebody recovery.
DRILL AND BLAST
As with a SLC operation, effective drill and blast practices are
critical to successful orebody recovery. It became apparent
early in the trial stages that the relatively soft rhyolite did
not respond well to the confined firing with conventional
SLC drill and blast designs, resulting in numerous problems
including frozen blasts, bridging and poor fragmentation.
A significant amount of trial and error in different sections
of the mine was used to refine this part of the mining cycle in
order to improve the overall efficiency of the operation.
The Bell
The need to ramp up production with the introduction of
SLS and provide sufficient active drawpoints resulted in the
need to quickly and effectively establish the slot (initial firing
void). Confined slot firings would restrict the rate at which
this could proceed due to the soft and absorbing nature of
the Rhyolite. To resolve this issue a sacrificial crown pillar
2 m thick was left between the slot and the broken material
in the level above to enable unconfined blasting in the slot
(Figure 7), with the crown broken by the initial production
rings fired into the slot (Figure 8). The safe and successful use
of this method required strict sequencing of the retreating slot
and drawpoint establishment to limit the exposure length of
the sacrificial crown.
The 2.6 m burden (89 mm blastholes) used in the initial
longitudinal levels was too great, resulting in poor
FIG 8 –Typical cross-section through a production drawpoint showing the slot
on the right with the sacrificial crown pillar and the production rings extending
into the sacrificial crown to the level above.
FIG 7 –Typical cross-section through a slot drive, showing the uphole rise on
the left, rows of blastholes in the slot drive, and the 2 m crown pillar separating
the slot from the level above.
Level Planned extraction factors Planned recovery Actual recovery Actual versus planned
Slot Rings Tonnes Grade Tonnes Grade Tonnes
(%)
Au (oz)
Tonnes
(%)
Grade
(%)
Tonnes
(%)
Grade
(%)
Au g/t Au g/t (%)
The
Bell
Longitudinal
905 50 100 30 80 8029 2.95 11 220 2.95 140 140
880 50 100 50 80 43 168 2.59 47 221 2.55 109 108
865 50 100 50 80 75 808 2.32 78 574 2.63 104 118
840 50 100 70 80 135 360 2.28 155 989 2.28 115 115
Transverse
825 50 100 70 80 220 794 2.11 252 226 2.31 114 125
Main
Production
Zone
800 50 100 100 80 364 032 2.78 379 119 2.83 104 106
775 50 100 100 80 503 171 2.93 424 124 2.90 84 83
750 50 100 100 80 467 845 3.19 418 069 3.03 89 85
725 50 100 100 80 546 016 2.98 495 816 3.18 91 97
700 50 100 100 80 628 884 2.91 631 269 2.97 100 103
675 50 100 100 80 Mining incomplete
650 50 100 100 80 Mining incomplete
625 50 100 TBC TBC Mining incomplete
600 50 100 TBC TBC Mining incomplete
Total 2 993 107 2.85 2 893 628 2.88 97 98
TABLE 2
Historic reconciliation.
Ore source Tonnage factor (%) Grade factor (%)
Development 100 100
Slot 50 100
Production rings 100 80
TABLE 1
Recovery factors applied in the mine plan for the Main Production Zone.
12TH AUSIMM UNDERGROUND OPERATORS’CONFERENCE / ADELAIDE, SA, 24–26 MARCH 2014
SUBLEVEL SHRINKAGE – THE MT WRIGHT STORY
211
fragmentation. This required the inclusion of easer holes
between rings to assist in the successful establishment of The
Bell. The ring spacing was closed up to 2.0 m after a number
of trials of various parameters. This improved the breakage
in front of the ring and limited the creation of slots along the
ring plane.
It also became apparent in the early stages of establishing
The Bell that nominal millisecond (ms) hole-hole delays of
25 ms were ineffective, often failing to effectively break the
rock mass. Longer delays (50–250 ms) tended to provide
larger but complete fragmentation with improved recovery.
Faster delays (17 ms, or less if fired with electronic detonators)
tended to produce very fine particle sizes from within a
channel approximately 0.5–1.0 m wide at the ring plane, but
with minimal breakage out to the face of the previous ring.
The faster firings only allowed a relatively small portion of
the planned extraction before the drawpoint would open up,
requiring significant effort to resolve. They did, however,
prove to be an effective means of re-slotting (to re-establish
a free face) in situations where bridges had been left behind.
Main Production Zone
Many of the operational lessons learned in establishing
The Bell were transferred into the Main Production Zone,
however additional trialling and refining was required due
to the different orientation of the production front and the
significantly larger footprint. The initial transverse levels
(825 and 800 Levels) were broken into panels utilising two
different ring designs (one centre hole and two centre holes,
Figure 9) and three different timing regimes (fast: 17–25 ms,
medium: 50–250 ms and slow: 250–500 ms). The results
showed the medium timing provided the best results in terms
of ore recovery and operational performance. The subsequent
transverse level (775 Level) further refined the medium timing
regime. Radio Frequency Identification (RFID) markers for
flow measurement were installed in specific areas between
production rings, with the location of each marker recorded to
enable future measurement of the material flow and provide
data for further refining the drill and blast process.
Hot and reactive ground became a significant issue that has
restricted the ability to pre-charge the production rings as
previously mentioned. As the heat source was shown to be
from the air drawn through the broken material above, holes
had to be blocked off to exclude the heat and provide a safe
method of charging the holes. This resulted in the centre four
to six holes in many of the production rings being charged
short, which subsequently impacted on the ability to achieve
the planned recovery. The ring design was modified to reduce
Level Planned
extraction (%)
Actual versus
planned (%)
Comments on variation to plan
905 30 140 30% extraction to remove swell from blasting and leave the remainder as an ore buffer between the waste fill and the production
front. Firings became too confined giving poor results, hence the extraction was increased above the plan.
880 50 109 Learning to resolve operational problems associated with hang-ups, some over-extraction to close the brow. Overbreak caused
the next ring to be charged being up inside the brow on a number of occasions, which inadvertently led to the subsequent ring
being charged with too much burden. Ring design parameters did not provide sufficient charge distribution for confined firing in
the soft rhyolite, necessitating easer rings.
865 50 104 Stress effects of the longitudinal retreat became apparent as the size of the excavation increased. Continuing to make
improvements to the resolve the issues from 880 Level.
840 70 115 Increased stress effects due to the larger excavation.The orientation of the retreating production front to manage the stress
redistribution did not provide optimum draw recovery.
825 70 114 The first transverse level. Panels of different ring design and firing sequences produced variable results across the level, along
with inconsistent ring shapes due to change in orientation. Stress effects from the shape of the centre-out production front were
not beneficial.
800 100 104 Further refinement of the blast design from the trials in 825 Level in different panels of drawpoints, again with variable, but
improved, results across the level. Early migration of waste backfill to the end drawpoints (Figure 3) due to limited confinement
ofThe Bell, demonstrated by recovery of radio frequency identification (RFID) markers from the waste backfill stream in the
southern end of 800 Level. Continued stress effects along the production front.
775 100 84 Creating a stress shadow by changing the mining sequence of the production front to north–south improved the operational
performance. Charging practices due to‘hot and reactive ground’resulted in poor fragmentation of the apex, which subsequently
impacted on recovery. Further waste migration in the end drawpoints, with recovery of RFID markers from the waste backfill
stream in the northern end of 775 Level. Reduced recovery in the end drawpoints to mitigate the waste migration and re-
establish the ore buffer.
750 100 89 Some improvements to the drill and blast practices to manage the effects of the‘hot and reactive ground’. Reduced recovery in
the end drawpoints to re-establish the ore buffer.
725 100 91 Further drill and blast improvements reduced the prevalence of‘hot’holes, which subsequently improved recovery.Variations to
the drill and blast design as a result of the material flow measurement results.
700 100 100 Continued improvements in the drill and blast processes improved recovery.
675 100 TBC Back height reduced in the production drawpoints to allow deeper penetration into the rill with the loader bucket to improve the
primary ore recovery.
650 100 TBC Drawpoint width increased to provide a wider draw cone and improved interaction between drawpoints to improve the primary
ore recovery.
TABLE 3
Summary of level performance.
12TH AUSIMM UNDERGROUND OPERATORS’CONFERENCE / ADELAIDE, SA, 24–26 MARCH 2014
D MACKAY, S LONG AND A J KOEN
212
the potential for unplanned breakthroughs into the broken
material above, while still maintaining adequate breakage.
As the Main Production Zone progressed, additional
flow measurement markers were recovered. Reviewing this
data in conjunction with observations from the charging
process resulted in further refinements to the drill design.
Observations from the material flow markers showed that
primary recovery deteriorated in conjunction with blasting
issues stemming from hot and reactive ground. Improved
drill and blast practices that restrict or eliminate the flow of
hot air through the blastholes have now reversed this trend.
In particular, recovery of markers in the apex area improved
from 20 to 41 per cent and the primary recovery improved
from 30 to 32 per cent, which will ultimately improve the
resource recovery and reduce the likelihood of funneling
waste dilution into the production drawpoints as the
production front advances.
The current drill and blast design (Figure 10) contradicts
what is generally accepted as conventional SLC blasting
practices. Conventional practices, using faster hole-hole
delays, have been demonstrated to be ineffective at Mt Wright
through numerous trials and measurements. This is likely
due to the soft and absorbing nature of the rhyolite.
MATERIAL FLOW
Flow measurement
Material flow measurement in the production zone was
done using the Radio Frequency Identification (RFID) Smart
Marker System (Whiteman, 2010), with markers installed and
grouted in rings between a number of the production rings.
These marker installations were aligned laterally across a
number of drawpoints and vertically across a number of
levels. The recovery of the RFID markers was measured using
readers in each level, with the marker recovery assumed to
simulate ore recovery. The installation used at Mt Wright
only measured which level the markers were recovered from
and an approximate date of recovery, as the use of stockpiles
in the levels to ensure efficient truck loading reduced the
accuracy of the time stamp relative to when the marker was
recovered from a drawpoint.
The results from the material flow measurement were
used to make improvements to the drill and blast process
and the drawpoint design. Areas of poor recovery were
attributed to poor fragmentation and the charge distribution
was improved, which subsequently improved the marker
recovery. The drive profile of the production drawpoints was
altered to improve the primary recovery by:
•
• reducing the back height, which moves the base of the
drawpoint rill closer to the brow, thereby allowing the
loader bucket to penetrate deeper into the fired ring
•
• increasing the drive width, which provides a wider base
for the draw cone, thereby increasing the effective draw
width of the fired ring.
These changes to the design layout are expected to provide
further improvements to the ore recovery in addition to
those realised from the improvements to the drill and blast
practices.
Flow modelling
The results from the material flow measurement were used
both for design improvements and to calibrate the material
flow model used to assist in evaluating overdraw scenarios.
Overdraw of levels may be used to recover some of the
fired material left within the production zone, at the cost of
a reduced head grade. The amount of overdraw, if any, will
be subject to an overall financial evaluation to ensure that
maximum value is achieved.
OPERATIONAL CONTROL
Improvements to the drill and blast process and the
drawpoint design will only make improving the recovery of
the orebody technically possible. Successful implementation
of these improvements requires strict operational control
of the production rate and sequence from each drawpoint
to ensure an even rate of draw to maximise recovery and
minimise dilution. The controls need to be simple in order to
be effective.
Bogging record sheets are kept in the mine muster area
to track the number of buckets taken from each drawpoint
and the remaining bucket count is updated on the shift
board at the end of each shift. The production shift board
is a schematic that shows the drawpoint status, the current
ring number, and the number of buckets remaining to extract
from each ring (Figure 11). The schematic is aligned similar
to the drawpoint layout to provide all stakeholders a simple
visual tool for viewing the production status, bogging and
charging activities, and drill locations within the production
levels. It is printed at the start of each shift and all personnel
receive a copy at the pre-shift meeting. Electronic tracking
systems are available to improve the production management
and reporting; however, the time and resources to install
and manage the system could not be justified for the known
Reserve. As such, production management at Mt Wright
requires a disciplined approach from all levels of personnel
to ensure the accuracy of the data and the overall value of the
Resource is maximised.
FIG 10 – Schematic of the current drill and blast design showing
firing delays in milliseconds.
FIG 9 – Schematic of the two drill designs used during the drill and blast trials.
12TH AUSIMM UNDERGROUND OPERATORS’CONFERENCE / ADELAIDE, SA, 24–26 MARCH 2014
SUBLEVEL SHRINKAGE – THE MT WRIGHT STORY
213
Production interactions are managed using simple wall
plans. As each production ring is drilled it is marked off
on a wall plan. Similarly, as each production ring is fired it
is marked on the same wall plan with the date it was fired
and the explosive product used. These simple visual tools
assist with the scheduling of production activities to manage
interactions between drawpoints and levels and provide a
clear indication of the available drilled stocks.
A qualitative assessment of each drawpoint is completed
by the geotechnicians each day and includes visual
assessments of fragmentation, any water drainage, and the
proportion of ore. The bogger operators also complete a
qualitative assessment of the drawpoint performance that
includes fragmentation through the ring, ease of bogging,
and recovery compared to plan. All of these assessments are
compiled and plotted on a set of SLS performance level plans
in the mining office to create a visual assessment of each level.
They are simple plans using three colours (representing
good, average, poor) for draw performance, fragmentation
and extraction. These plans provide a simple overview of the
production performance and assist in identifying trends for
further improvement in design and sequencing.
The technical and operational aspects of the operation
discussed above are primarily aimed at producing quality
tonnes at the highest grade and lowest dilution that is
possible from the SLS method. Maximising the delivery of
these quality tonnes to the processing plant is required to
minimise the unit cost. A number of performance enhancing
projects have been implemented to improve the efficiency of
the production fleet.
PERFORMANCE ENHANCEMENT
The SLS mining method is capable of much higher production
rates than what the Mt Wright infrastructure was designed
for, particularly ventilation capacity and decline traffic.
Increasing production rates by expansion of infrastructure
was shown to be very capital intensive and difficult to justify
over the relatively short mine life. Consequently, increased
capacity had to be driven by improved efficiency of the
available resources.
Maintenance
The availability of the trucking fleet is critical to maximising
the productivity of the haulage fleet. The haulage fleet was
the highest priority for the maintenance department to return
to service, often to the detriment of other parts of the mobile
equipment fleet. Independent consultants were used to review
the maintenance practices across the site and it was found
there were insufficient maintenance work-hours available
to complete the scheduled servicing of equipment. As such,
manning levels were expanded to provide sufficient resources
to complete scheduled servicing and also cover breakdowns
in a timely manner. The additional work-hours resulted in a
significant improvement in planned job completion and an
increased ratio of planned to unplanned maintenance work,
which materially improved the efficiency of the operation.
Efficiency
Ventilation restrictions limit the underground trucking fleet
to six at any one time. In order to improve the production
capacity, the efficiency of the haulage fleet had to be
maximised. The improvements in the fleet maintenance were
accompanied by operational improvements to maximise the
utilisation of available hours, the effective operating time
of the fleet, and the payload in each truck. These were done
predominantly via administrative processes that included:
•
• loading from drawpoints to stockpiles and loading trucks
from stockpiles, which have a shorter digging time and
shorter tram for the loader
•
• establishing a safe and effective hot-seating regime to
maintain continuity of production throughout each shift
•
• ensuring the trucks are parked up in sequence at the end
of the shift with the loader driver picking up all the truck
drivers in a light vehicle on the way to the surface at the
end of the shift to maximise hauling time, rather than all
trucks stopping on the surface at the end of the shift
•
• using effective communication between truck drivers to
minimise queuing time while waiting for either loaded
trucks to pass on the decline or while waiting for a load
•
• targeted training of loader operators for loading the trucks
in a manner that maximised the payload.
FIG 11 – Image from the production shift board.
12TH AUSIMM UNDERGROUND OPERATORS’CONFERENCE / ADELAIDE, SA, 24–26 MARCH 2014
D MACKAY, S LONG AND A J KOEN
214
The combination of maintenance and operational
improvements resulted in a 21 per cent increase in average
operating hours per truck per month and an 18 per cent
increase in payload, which is summarised in Table 4. These
achievements were made over a period of approximately
six months and have been sustained for two years. The
annualised production rate has increased by 15 per cent from
1.46 to 1.67 Mt/a while the centroid of mining moved 150 m
deeper, adding 1.1 km (25 per cent) to the haul distance.
Backfill delivery
Further trucking capacity improvements were made by
linking the waste pass through to a dedicated tipping point.
Initially, the crown pillar between Stopes 4 and 6 (Figure 3)
was removed and waste was delivered via a waste pass in
1120 Level. This required the haulage fleet to be loaded with
waste on the surface (1345 Level) and backloaded to the
1120 Level. The additional loading time and the subsequent
speed restrictions on travelling loaded downhill slowed the
trucking cycle. Also the additional wear and tear this caused
to the trucks did not assist in reducing down time. In 2012
a dedicated portal was established to access a tipping point
approximately 100 m above Stope 2, and the crown pillar
between Stopes 2 and 4 was removed (Figure 3). This reduced
the requirement for backloading of waste thereby increasing
the time available for ore haulage and minimising downtime
associated with downhill haulage.
An underground waste pass was used to provide an
underground tipping point for waste generated from
development, thus eliminating the need to haul development
waste to the surface for delivery into the main waste pass.
Ongoing monitoring is used to determine the fill level in each
system and waste can be preferentially delivered to either
as required. Backloading surface waste to the underground
tipple currently accounts for approximately ten per cent of the
total backfill delivered from the surface.
The improved operational efficiencies achieved through
these projects has provided increased production rates and
maintained the cost of production despite the increasing
depth of the production front.
PHYSICAL AND FINANCIAL KEY
PERFORMANCE INDICATORS
The SLS mining method moved into steady state full
production as the majority of the low-grade dumps from the
open pit operation were depleted. The processing plant was
then converted from a nominal throughput of 5.0 to 1.5 Mt/a
in September 2011. In order to demonstrate the viability of
the SLS mining method at Mt Wright, a summary of the
physical and financial KPIs from the quarter following the
process plant conversion is shown in Table 5, Figure 12
(physical KPIs), and Figure 13 (financial KPIs). This time
period correlates with the production overlap between 800
and 775 Levels and continues until the time of writing, which
correlates with the overlap of 675 and 650 Levels (refer to
Table 2).
CONCLUSIONS
Following the completion of the open pit operations, the
process plant throughput was reduced from 5.0 to 1.5 Mt/a
leaving the Mt Wright underground operation as the primary
ore source. During this time, the productivity of the haulage
fleet has improved by 43 per cent and coupled with the
FIG 12 – Physical key performance indicators (previous two years).
Parameter 2011 2013 Improvement
Average operating hours per truck 455 hours/month (64% of total hours) 550 hours/month (76% of total hours) 95 hours/month (operating 21% more)
Average payload (reconciled dry tonnes) 44 t 52 t 8 t (18% increase)
TABLE 4
Haulage improvements from 2011–2013.
Key performance
indicators
Units Quarter ending Total
Dec 11 Mar 12 Jun 12 Sep 12 Dec 12 Mar 13 Jun 13 Sep 13
Underground ore mined kt 360 369 376 381 375 400 402 420 3 082
Underground grade g/t 2.76 3.15 3.01 3.20 2.85 3.11 2.99 3.00 3.01
Gold produced oz 32 938 36 968 34 846 35 948 33 123 38 281 34 495 39 051 285 648
Depth of production m 545 570 570 595 620 645 670 695
Recovery % 93.6 93.6 92.7 94.1 95.4 95.7 94.4 95.0 96.0
Cash cost $/oz 795 663 816 731 844 741 734 735 755
TABLE 5
Physical and financial key performance indicators.
12TH AUSIMM UNDERGROUND OPERATORS’CONFERENCE / ADELAIDE, SA, 24–26 MARCH 2014
SUBLEVEL SHRINKAGE – THE MT WRIGHT STORY
215
other improvements in operational efficiency has produced
results exceeding the expectations. Despite the reduced plant
throughput, these productivity improvements have resulted
in cash costs that clearly demonstrate the implementation
of the SLS mining method has been successful in safely and
efficiently maximising the value of the Mt Wright Resource.
The major challenges in establishing and improving the
operation have been discussed, along with a brief summary
of the processes used to resolve them and the outcomes
achieved. It should be noted that this paper presents a brief
summary of the operation and significantly more detail was
involved in resolving each of these challenges than could be
presented here. When viewed in its entirety, it can be seen that
each challenge has impacts on other areas. While the process
of resolving some of these challenges has been detrimental
to other areas, generally the final resolution has provided an
overall improvement.
ACKNOWLEDGEMENTS
The authors would like to thank Carpentaria Gold Pty Ltd
and Resolute Mining Limited for allowing this paper to be
published. While a number of people have contributed to the
success of Mt Wright in recent years, the authors would like to
particularly acknowledge the following people: Jarek Jakubec
(SRK Consulting (Canada) Inc) for imparting some of his
knowledge and wisdom to the technical staff at Carpentaria
Gold; Simon Steffen (Elexon Mining) for his assistance in
material flow measurement; David Sainsbury (Itasca Australia
Pty Ltd) for the development, calibration and interpretation
of the Mt Wright numerical model; Dr Francis Pitard (Francis
Pitard Sampling Consultants) for his guidance on improving
the sampling and reconciliation processes at Ravenswood
and Charles Knight (333 Consulting) for his assistance with
improving the mobile fleet maintenance practices.
REFERENCES
Australian Explosives Industry Safety Group (AEISG), 2012. Code
of Practice, Elevated Temperature and Reactive Ground, Edition
3 June 2012 [online]. Available from: <http://www.aeisg.org/
index.php/cop.html>.
Mackay, D, 2011. Implementing and improving the mine plan at the
Mt Wright Project, in Proceedings 11th Underground Operators’
Conference 2011, pp 135–142 (The Australasian Institute of Mining
and Metallurgy: Melbourne).
Whiteman, D S, 2010. The Smart Marker System – a new tool for
measuring underground orebody flow in block and sublevel
mines, in Proceedings Second International Symposium on Block and
Sublevel Caving (ed: Y Potvin), pp 603–621 (Australian Centre for
Geomechanics: Perth).
Wiggin, M, Trout, P and Macaulay, B, 2005. Solving the problems
of precharging sublevel caving rings at Ridgeway Gold Mine,
in Proceedings Ninth Underground Operators’ Conference 2005,
pp 81–89 (The Australasian Institute of Mining and Metallurgy:
Melbourne).
FIG 13 – Financial key performance indicators (previous two years).

More Related Content

What's hot

Wet pan mill
Wet pan millWet pan mill
Wet pan millEvita Lee
 
PROJECT REPORT TATA STEEL- Rahul
PROJECT REPORT TATA STEEL- RahulPROJECT REPORT TATA STEEL- Rahul
PROJECT REPORT TATA STEEL- RahulRahul Singh
 
Blasting and rock fragmentation
Blasting and rock fragmentationBlasting and rock fragmentation
Blasting and rock fragmentationAlex Demidov
 
GUIDELINES FOR EFFECTIVE HOLE CLEANING IN DIRECTIONAL WELLS
GUIDELINES FOR EFFECTIVE HOLE CLEANING IN DIRECTIONAL WELLSGUIDELINES FOR EFFECTIVE HOLE CLEANING IN DIRECTIONAL WELLS
GUIDELINES FOR EFFECTIVE HOLE CLEANING IN DIRECTIONAL WELLSMohan Doshi
 
Blast design in opencast mining
Blast design in opencast miningBlast design in opencast mining
Blast design in opencast mininggopal karmakar
 
optimisation of depth of opencast coal mine using udec software
optimisation of depth of opencast coal mine using udec softwareoptimisation of depth of opencast coal mine using udec software
optimisation of depth of opencast coal mine using udec softwarejai jain
 
4 drilling problems and prevent
4 drilling problems and prevent4 drilling problems and prevent
4 drilling problems and preventShabaz Ahmad
 
Well Completion Design.pdf
Well Completion Design.pdfWell Completion Design.pdf
Well Completion Design.pdfmmody4
 
Drilling Engineering - Directional Drilling
Drilling Engineering - Directional DrillingDrilling Engineering - Directional Drilling
Drilling Engineering - Directional DrillingJames Craig
 
Openpit fundamentals
Openpit fundamentalsOpenpit fundamentals
Openpit fundamentalsVR M
 
Undergroundmine 111023093713-phpapp01
Undergroundmine 111023093713-phpapp01Undergroundmine 111023093713-phpapp01
Undergroundmine 111023093713-phpapp01baljka311
 
Optimization of Blasting Parameters in open cast mines
Optimization of Blasting Parameters in open cast minesOptimization of Blasting Parameters in open cast mines
Optimization of Blasting Parameters in open cast minesAnurag Jha
 
Drill Bit Parameters
Drill Bit ParametersDrill Bit Parameters
Drill Bit Parametersvaskelslide
 

What's hot (20)

geotechnical design for dilution control in underground mining
geotechnical design for dilution control in underground mininggeotechnical design for dilution control in underground mining
geotechnical design for dilution control in underground mining
 
Wet pan mill
Wet pan millWet pan mill
Wet pan mill
 
PROJECT REPORT TATA STEEL- Rahul
PROJECT REPORT TATA STEEL- RahulPROJECT REPORT TATA STEEL- Rahul
PROJECT REPORT TATA STEEL- Rahul
 
Bits
BitsBits
Bits
 
Blasting and rock fragmentation
Blasting and rock fragmentationBlasting and rock fragmentation
Blasting and rock fragmentation
 
GUIDELINES FOR EFFECTIVE HOLE CLEANING IN DIRECTIONAL WELLS
GUIDELINES FOR EFFECTIVE HOLE CLEANING IN DIRECTIONAL WELLSGUIDELINES FOR EFFECTIVE HOLE CLEANING IN DIRECTIONAL WELLS
GUIDELINES FOR EFFECTIVE HOLE CLEANING IN DIRECTIONAL WELLS
 
Basics of drilling 4
Basics of drilling 4Basics of drilling 4
Basics of drilling 4
 
Blast design in opencast mining
Blast design in opencast miningBlast design in opencast mining
Blast design in opencast mining
 
Square set stoping
Square set stopingSquare set stoping
Square set stoping
 
Continuous miner
Continuous minerContinuous miner
Continuous miner
 
optimisation of depth of opencast coal mine using udec software
optimisation of depth of opencast coal mine using udec softwareoptimisation of depth of opencast coal mine using udec software
optimisation of depth of opencast coal mine using udec software
 
4 drilling problems and prevent
4 drilling problems and prevent4 drilling problems and prevent
4 drilling problems and prevent
 
Well Completion Design.pdf
Well Completion Design.pdfWell Completion Design.pdf
Well Completion Design.pdf
 
Drilling Engineering - Directional Drilling
Drilling Engineering - Directional DrillingDrilling Engineering - Directional Drilling
Drilling Engineering - Directional Drilling
 
Openpit fundamentals
Openpit fundamentalsOpenpit fundamentals
Openpit fundamentals
 
Blasting
BlastingBlasting
Blasting
 
Undergroundmine 111023093713-phpapp01
Undergroundmine 111023093713-phpapp01Undergroundmine 111023093713-phpapp01
Undergroundmine 111023093713-phpapp01
 
Optimization of Blasting Parameters in open cast mines
Optimization of Blasting Parameters in open cast minesOptimization of Blasting Parameters in open cast mines
Optimization of Blasting Parameters in open cast mines
 
Drill Bit Parameters
Drill Bit ParametersDrill Bit Parameters
Drill Bit Parameters
 
Surface miner
Surface minerSurface miner
Surface miner
 

Similar to 2014 sublevel shrinkage – the mt wright story

A Theoretical Study on Strata Behaviour and Ground Control in Coal Mines
A Theoretical Study on Strata Behaviour and Ground Control in Coal MinesA Theoretical Study on Strata Behaviour and Ground Control in Coal Mines
A Theoretical Study on Strata Behaviour and Ground Control in Coal MinesIRJET Journal
 
Sag mill-operation-at-cortez evolution-of-liner-d-11
Sag mill-operation-at-cortez  evolution-of-liner-d-11Sag mill-operation-at-cortez  evolution-of-liner-d-11
Sag mill-operation-at-cortez evolution-of-liner-d-11Daniel Ojeda
 
Mechanisation Vs Accidents in Mining
Mechanisation Vs Accidents in MiningMechanisation Vs Accidents in Mining
Mechanisation Vs Accidents in MiningVR M
 
Mine Engineering project
Mine Engineering projectMine Engineering project
Mine Engineering projectLawrence Tjale
 
An experience of Loading pattern on Power supports with Sand stone roof in SCCL
An experience of Loading pattern on Power supports with Sand stone roof in SCCLAn experience of Loading pattern on Power supports with Sand stone roof in SCCL
An experience of Loading pattern on Power supports with Sand stone roof in SCCLMD.Suresh Kumar
 
Resume ali mohamed mahmoud 2018
Resume ali mohamed mahmoud   2018Resume ali mohamed mahmoud   2018
Resume ali mohamed mahmoud 2018Ali Mahmoud
 
00 - Secondary Blasting Report - Investigation - LinkedIn
00 - Secondary Blasting Report - Investigation - LinkedIn00 - Secondary Blasting Report - Investigation - LinkedIn
00 - Secondary Blasting Report - Investigation - LinkedInKaren Wightman
 
AN INVESTIGATION ON SEISMIC STABILITY OF MINE OVERBURDEN DUMP SLOPE
AN INVESTIGATION ON SEISMIC STABILITY OF MINE OVERBURDEN DUMP SLOPEAN INVESTIGATION ON SEISMIC STABILITY OF MINE OVERBURDEN DUMP SLOPE
AN INVESTIGATION ON SEISMIC STABILITY OF MINE OVERBURDEN DUMP SLOPEIRJET Journal
 
"Factors Affecting the Design and Construction of High Capacity Minipiles"
"Factors Affecting the Design and Construction of High Capacity Minipiles""Factors Affecting the Design and Construction of High Capacity Minipiles"
"Factors Affecting the Design and Construction of High Capacity Minipiles"Remedy Geotechnics Ltd
 
Technical paper050undergroundpreconcentrationbyoresortingandcoarsegravitysepa...
Technical paper050undergroundpreconcentrationbyoresortingandcoarsegravitysepa...Technical paper050undergroundpreconcentrationbyoresortingandcoarsegravitysepa...
Technical paper050undergroundpreconcentrationbyoresortingandcoarsegravitysepa...jorge ramirez seminario
 
The role and importance of geotechnical engineering for a mining operation (1)
The role and importance of geotechnical engineering for a mining operation (1)The role and importance of geotechnical engineering for a mining operation (1)
The role and importance of geotechnical engineering for a mining operation (1)Dr. Alex Vyazmensky
 
Modelling Calendar Time Structure for Open Pit Mining Equipment Performance C...
Modelling Calendar Time Structure for Open Pit Mining Equipment Performance C...Modelling Calendar Time Structure for Open Pit Mining Equipment Performance C...
Modelling Calendar Time Structure for Open Pit Mining Equipment Performance C...CrimsonPublishersAMMS
 
CD 2016 March - Advisian Showcase
CD 2016 March - Advisian ShowcaseCD 2016 March - Advisian Showcase
CD 2016 March - Advisian ShowcaseComit Projects Ltd
 
Samarang Field
Samarang FieldSamarang Field
Samarang FieldJason Shim
 

Similar to 2014 sublevel shrinkage – the mt wright story (20)

A Theoretical Study on Strata Behaviour and Ground Control in Coal Mines
A Theoretical Study on Strata Behaviour and Ground Control in Coal MinesA Theoretical Study on Strata Behaviour and Ground Control in Coal Mines
A Theoretical Study on Strata Behaviour and Ground Control in Coal Mines
 
Sag mill-operation-at-cortez evolution-of-liner-d-11
Sag mill-operation-at-cortez  evolution-of-liner-d-11Sag mill-operation-at-cortez  evolution-of-liner-d-11
Sag mill-operation-at-cortez evolution-of-liner-d-11
 
Mechanisation Vs Accidents in Mining
Mechanisation Vs Accidents in MiningMechanisation Vs Accidents in Mining
Mechanisation Vs Accidents in Mining
 
Research paper
Research paperResearch paper
Research paper
 
Mine Engineering project
Mine Engineering projectMine Engineering project
Mine Engineering project
 
[IJET-V1I2P10] Authors :L. O. Osuman, A. Dosunmu , B .S. Odagme
[IJET-V1I2P10] Authors :L. O. Osuman, A. Dosunmu , B .S. Odagme [IJET-V1I2P10] Authors :L. O. Osuman, A. Dosunmu , B .S. Odagme
[IJET-V1I2P10] Authors :L. O. Osuman, A. Dosunmu , B .S. Odagme
 
An experience of Loading pattern on Power supports with Sand stone roof in SCCL
An experience of Loading pattern on Power supports with Sand stone roof in SCCLAn experience of Loading pattern on Power supports with Sand stone roof in SCCL
An experience of Loading pattern on Power supports with Sand stone roof in SCCL
 
Resume CV
Resume CVResume CV
Resume CV
 
208_fullpaper_notes
208_fullpaper_notes208_fullpaper_notes
208_fullpaper_notes
 
Resume ali mohamed mahmoud 2018
Resume ali mohamed mahmoud   2018Resume ali mohamed mahmoud   2018
Resume ali mohamed mahmoud 2018
 
00 - Secondary Blasting Report - Investigation - LinkedIn
00 - Secondary Blasting Report - Investigation - LinkedIn00 - Secondary Blasting Report - Investigation - LinkedIn
00 - Secondary Blasting Report - Investigation - LinkedIn
 
AN INVESTIGATION ON SEISMIC STABILITY OF MINE OVERBURDEN DUMP SLOPE
AN INVESTIGATION ON SEISMIC STABILITY OF MINE OVERBURDEN DUMP SLOPEAN INVESTIGATION ON SEISMIC STABILITY OF MINE OVERBURDEN DUMP SLOPE
AN INVESTIGATION ON SEISMIC STABILITY OF MINE OVERBURDEN DUMP SLOPE
 
chris's CV
chris's CVchris's CV
chris's CV
 
"Factors Affecting the Design and Construction of High Capacity Minipiles"
"Factors Affecting the Design and Construction of High Capacity Minipiles""Factors Affecting the Design and Construction of High Capacity Minipiles"
"Factors Affecting the Design and Construction of High Capacity Minipiles"
 
Technical paper050undergroundpreconcentrationbyoresortingandcoarsegravitysepa...
Technical paper050undergroundpreconcentrationbyoresortingandcoarsegravitysepa...Technical paper050undergroundpreconcentrationbyoresortingandcoarsegravitysepa...
Technical paper050undergroundpreconcentrationbyoresortingandcoarsegravitysepa...
 
Side discharge loader
Side discharge loaderSide discharge loader
Side discharge loader
 
The role and importance of geotechnical engineering for a mining operation (1)
The role and importance of geotechnical engineering for a mining operation (1)The role and importance of geotechnical engineering for a mining operation (1)
The role and importance of geotechnical engineering for a mining operation (1)
 
Modelling Calendar Time Structure for Open Pit Mining Equipment Performance C...
Modelling Calendar Time Structure for Open Pit Mining Equipment Performance C...Modelling Calendar Time Structure for Open Pit Mining Equipment Performance C...
Modelling Calendar Time Structure for Open Pit Mining Equipment Performance C...
 
CD 2016 March - Advisian Showcase
CD 2016 March - Advisian ShowcaseCD 2016 March - Advisian Showcase
CD 2016 March - Advisian Showcase
 
Samarang Field
Samarang FieldSamarang Field
Samarang Field
 

Recently uploaded

Computer Networks Basics of Network Devices
Computer Networks  Basics of Network DevicesComputer Networks  Basics of Network Devices
Computer Networks Basics of Network DevicesChandrakantDivate1
 
HOA1&2 - Module 3 - PREHISTORCI ARCHITECTURE OF KERALA.pptx
HOA1&2 - Module 3 - PREHISTORCI ARCHITECTURE OF KERALA.pptxHOA1&2 - Module 3 - PREHISTORCI ARCHITECTURE OF KERALA.pptx
HOA1&2 - Module 3 - PREHISTORCI ARCHITECTURE OF KERALA.pptxSCMS School of Architecture
 
Bhubaneswar🌹Call Girls Bhubaneswar ❤Komal 9777949614 💟 Full Trusted CALL GIRL...
Bhubaneswar🌹Call Girls Bhubaneswar ❤Komal 9777949614 💟 Full Trusted CALL GIRL...Bhubaneswar🌹Call Girls Bhubaneswar ❤Komal 9777949614 💟 Full Trusted CALL GIRL...
Bhubaneswar🌹Call Girls Bhubaneswar ❤Komal 9777949614 💟 Full Trusted CALL GIRL...Call Girls Mumbai
 
Rums floating Omkareshwar FSPV IM_16112021.pdf
Rums floating Omkareshwar FSPV IM_16112021.pdfRums floating Omkareshwar FSPV IM_16112021.pdf
Rums floating Omkareshwar FSPV IM_16112021.pdfsmsksolar
 
Generative AI or GenAI technology based PPT
Generative AI or GenAI technology based PPTGenerative AI or GenAI technology based PPT
Generative AI or GenAI technology based PPTbhaskargani46
 
scipt v1.pptxcxxxxxxxxxxxxxxxxxxxxxxxxxxxxxxxxxxxxxxxxxxxxxxxxxxxxxxxxxxxxxxx...
scipt v1.pptxcxxxxxxxxxxxxxxxxxxxxxxxxxxxxxxxxxxxxxxxxxxxxxxxxxxxxxxxxxxxxxxx...scipt v1.pptxcxxxxxxxxxxxxxxxxxxxxxxxxxxxxxxxxxxxxxxxxxxxxxxxxxxxxxxxxxxxxxxx...
scipt v1.pptxcxxxxxxxxxxxxxxxxxxxxxxxxxxxxxxxxxxxxxxxxxxxxxxxxxxxxxxxxxxxxxxx...HenryBriggs2
 
Standard vs Custom Battery Packs - Decoding the Power Play
Standard vs Custom Battery Packs - Decoding the Power PlayStandard vs Custom Battery Packs - Decoding the Power Play
Standard vs Custom Battery Packs - Decoding the Power PlayEpec Engineered Technologies
 
Unleashing the Power of the SORA AI lastest leap
Unleashing the Power of the SORA AI lastest leapUnleashing the Power of the SORA AI lastest leap
Unleashing the Power of the SORA AI lastest leapRishantSharmaFr
 
S1S2 B.Arch MGU - HOA1&2 Module 3 -Temple Architecture of Kerala.pptx
S1S2 B.Arch MGU - HOA1&2 Module 3 -Temple Architecture of Kerala.pptxS1S2 B.Arch MGU - HOA1&2 Module 3 -Temple Architecture of Kerala.pptx
S1S2 B.Arch MGU - HOA1&2 Module 3 -Temple Architecture of Kerala.pptxSCMS School of Architecture
 
Hostel management system project report..pdf
Hostel management system project report..pdfHostel management system project report..pdf
Hostel management system project report..pdfKamal Acharya
 
HAND TOOLS USED AT ELECTRONICS WORK PRESENTED BY KOUSTAV SARKAR
HAND TOOLS USED AT ELECTRONICS WORK PRESENTED BY KOUSTAV SARKARHAND TOOLS USED AT ELECTRONICS WORK PRESENTED BY KOUSTAV SARKAR
HAND TOOLS USED AT ELECTRONICS WORK PRESENTED BY KOUSTAV SARKARKOUSTAV SARKAR
 
Block diagram reduction techniques in control systems.ppt
Block diagram reduction techniques in control systems.pptBlock diagram reduction techniques in control systems.ppt
Block diagram reduction techniques in control systems.pptNANDHAKUMARA10
 
Engineering Drawing focus on projection of planes
Engineering Drawing focus on projection of planesEngineering Drawing focus on projection of planes
Engineering Drawing focus on projection of planesRAJNEESHKUMAR341697
 
Computer Lecture 01.pptxIntroduction to Computers
Computer Lecture 01.pptxIntroduction to ComputersComputer Lecture 01.pptxIntroduction to Computers
Computer Lecture 01.pptxIntroduction to ComputersMairaAshraf6
 
"Lesotho Leaps Forward: A Chronicle of Transformative Developments"
"Lesotho Leaps Forward: A Chronicle of Transformative Developments""Lesotho Leaps Forward: A Chronicle of Transformative Developments"
"Lesotho Leaps Forward: A Chronicle of Transformative Developments"mphochane1998
 
Online electricity billing project report..pdf
Online electricity billing project report..pdfOnline electricity billing project report..pdf
Online electricity billing project report..pdfKamal Acharya
 
notes on Evolution Of Analytic Scalability.ppt
notes on Evolution Of Analytic Scalability.pptnotes on Evolution Of Analytic Scalability.ppt
notes on Evolution Of Analytic Scalability.pptMsecMca
 
Employee leave management system project.
Employee leave management system project.Employee leave management system project.
Employee leave management system project.Kamal Acharya
 
Double Revolving field theory-how the rotor develops torque
Double Revolving field theory-how the rotor develops torqueDouble Revolving field theory-how the rotor develops torque
Double Revolving field theory-how the rotor develops torqueBhangaleSonal
 

Recently uploaded (20)

Computer Networks Basics of Network Devices
Computer Networks  Basics of Network DevicesComputer Networks  Basics of Network Devices
Computer Networks Basics of Network Devices
 
HOA1&2 - Module 3 - PREHISTORCI ARCHITECTURE OF KERALA.pptx
HOA1&2 - Module 3 - PREHISTORCI ARCHITECTURE OF KERALA.pptxHOA1&2 - Module 3 - PREHISTORCI ARCHITECTURE OF KERALA.pptx
HOA1&2 - Module 3 - PREHISTORCI ARCHITECTURE OF KERALA.pptx
 
Bhubaneswar🌹Call Girls Bhubaneswar ❤Komal 9777949614 💟 Full Trusted CALL GIRL...
Bhubaneswar🌹Call Girls Bhubaneswar ❤Komal 9777949614 💟 Full Trusted CALL GIRL...Bhubaneswar🌹Call Girls Bhubaneswar ❤Komal 9777949614 💟 Full Trusted CALL GIRL...
Bhubaneswar🌹Call Girls Bhubaneswar ❤Komal 9777949614 💟 Full Trusted CALL GIRL...
 
Rums floating Omkareshwar FSPV IM_16112021.pdf
Rums floating Omkareshwar FSPV IM_16112021.pdfRums floating Omkareshwar FSPV IM_16112021.pdf
Rums floating Omkareshwar FSPV IM_16112021.pdf
 
Generative AI or GenAI technology based PPT
Generative AI or GenAI technology based PPTGenerative AI or GenAI technology based PPT
Generative AI or GenAI technology based PPT
 
scipt v1.pptxcxxxxxxxxxxxxxxxxxxxxxxxxxxxxxxxxxxxxxxxxxxxxxxxxxxxxxxxxxxxxxxx...
scipt v1.pptxcxxxxxxxxxxxxxxxxxxxxxxxxxxxxxxxxxxxxxxxxxxxxxxxxxxxxxxxxxxxxxxx...scipt v1.pptxcxxxxxxxxxxxxxxxxxxxxxxxxxxxxxxxxxxxxxxxxxxxxxxxxxxxxxxxxxxxxxxx...
scipt v1.pptxcxxxxxxxxxxxxxxxxxxxxxxxxxxxxxxxxxxxxxxxxxxxxxxxxxxxxxxxxxxxxxxx...
 
Standard vs Custom Battery Packs - Decoding the Power Play
Standard vs Custom Battery Packs - Decoding the Power PlayStandard vs Custom Battery Packs - Decoding the Power Play
Standard vs Custom Battery Packs - Decoding the Power Play
 
Unleashing the Power of the SORA AI lastest leap
Unleashing the Power of the SORA AI lastest leapUnleashing the Power of the SORA AI lastest leap
Unleashing the Power of the SORA AI lastest leap
 
Call Girls in South Ex (delhi) call me [🔝9953056974🔝] escort service 24X7
Call Girls in South Ex (delhi) call me [🔝9953056974🔝] escort service 24X7Call Girls in South Ex (delhi) call me [🔝9953056974🔝] escort service 24X7
Call Girls in South Ex (delhi) call me [🔝9953056974🔝] escort service 24X7
 
S1S2 B.Arch MGU - HOA1&2 Module 3 -Temple Architecture of Kerala.pptx
S1S2 B.Arch MGU - HOA1&2 Module 3 -Temple Architecture of Kerala.pptxS1S2 B.Arch MGU - HOA1&2 Module 3 -Temple Architecture of Kerala.pptx
S1S2 B.Arch MGU - HOA1&2 Module 3 -Temple Architecture of Kerala.pptx
 
Hostel management system project report..pdf
Hostel management system project report..pdfHostel management system project report..pdf
Hostel management system project report..pdf
 
HAND TOOLS USED AT ELECTRONICS WORK PRESENTED BY KOUSTAV SARKAR
HAND TOOLS USED AT ELECTRONICS WORK PRESENTED BY KOUSTAV SARKARHAND TOOLS USED AT ELECTRONICS WORK PRESENTED BY KOUSTAV SARKAR
HAND TOOLS USED AT ELECTRONICS WORK PRESENTED BY KOUSTAV SARKAR
 
Block diagram reduction techniques in control systems.ppt
Block diagram reduction techniques in control systems.pptBlock diagram reduction techniques in control systems.ppt
Block diagram reduction techniques in control systems.ppt
 
Engineering Drawing focus on projection of planes
Engineering Drawing focus on projection of planesEngineering Drawing focus on projection of planes
Engineering Drawing focus on projection of planes
 
Computer Lecture 01.pptxIntroduction to Computers
Computer Lecture 01.pptxIntroduction to ComputersComputer Lecture 01.pptxIntroduction to Computers
Computer Lecture 01.pptxIntroduction to Computers
 
"Lesotho Leaps Forward: A Chronicle of Transformative Developments"
"Lesotho Leaps Forward: A Chronicle of Transformative Developments""Lesotho Leaps Forward: A Chronicle of Transformative Developments"
"Lesotho Leaps Forward: A Chronicle of Transformative Developments"
 
Online electricity billing project report..pdf
Online electricity billing project report..pdfOnline electricity billing project report..pdf
Online electricity billing project report..pdf
 
notes on Evolution Of Analytic Scalability.ppt
notes on Evolution Of Analytic Scalability.pptnotes on Evolution Of Analytic Scalability.ppt
notes on Evolution Of Analytic Scalability.ppt
 
Employee leave management system project.
Employee leave management system project.Employee leave management system project.
Employee leave management system project.
 
Double Revolving field theory-how the rotor develops torque
Double Revolving field theory-how the rotor develops torqueDouble Revolving field theory-how the rotor develops torque
Double Revolving field theory-how the rotor develops torque
 

2014 sublevel shrinkage – the mt wright story

  • 1. 12TH AUSIMM UNDERGROUND OPERATORS’CONFERENCE / ADELAIDE, SA, 24–26 MARCH 2014 205 INTRODUCTION Development of the Mt Wright Underground Mine commenced in 2006, with the first production ore in 2007. The mine plan evolved over the first three years of production in response to geological, geotechnical and financial challenges until the sublevel shrinkage with continuous fill mining method (SLS) was implemented in 2010 (Mackay, 2011). The key challenges encountered while implementing SLS can be grouped into safety, geotechnical, mine planning and geology, drill and blast, and operational control issues. A number of continuous improvement projects such as material flow and improved productivity were implemented that focused both on addressing these issues and maximising the value of the orebody. A number of the responses to these challenges are inter-related and resolving one issue often improved efficiency in a number of other areas. The successful implementation of the SLS mining method is demonstrated by the key performance indicators (KPIs) and the financial results. A brief summary of each aspect will be presented, along with the key outcomes achieved. BACKGROUND The SLS mining method utilises a production front similar to a sublevel cave (SLC), except that unconsolidated fill (waste or low-grade rock) is placed in the top of the cave zone on top of the broken ore to stabilise the surrounding rock mass and prevent overlying strata from caving uncontrollably or catastrophically (Figure 1). At the time of implementation, limited evidence was found regarding the previous use or success of this mining method. The evolution of the selection process and subsequent mine plan for this mining method at Mt Wright has been described and presented previously by Mackay (2011) and will not be detailed here. SAFETY Similar to SLC, SLS requires personnel to work on the drawpoint rill during the charging process. Despite the use of ‘charge pads’ at the brow to improve the working environment (Figure 2), a significant portion of both the lost time injuries (LTIs) and the total recordable injuries (TRIs) sustained by underground operators were associated with working on the rill during the initial stages of the production ramp-up. Two approaches were taken to improve risk management during the charging processes: Sublevel Shrinkage – the MtWright Story D Mackay1 , S Long2 and A J Koen3 ABSTRACT The Mt Wright Underground Mine is located near the town of Ravenswood in North Queensland and is operated by Carpentaria Gold – a wholly owned subsidiary of Resolute Mining Limited. Following the evolution of the mine plan through a number of stages, the ‘sublevel shrinkage (SLS) with continuous fill’ mining method was implemented in 2010 to extract the Mt Wright orebody. The production front in this mining method is similar to a sublevel cave (SLC) operation; however, backfill is placed into the top of the production zone as opposed to requiring the overlying strata to cave. Continuous fill to replace the void created by extracting the ore was required to manage the potential risks associated with the proximity of infrastructure to the footwall, associated long- term stability and air blast potential due to the limited ‘cavability’ of the material within the cave zone. The available fill material was sourced from a disused waste dump from a previous open pit operation, which introduced further technical and economic risks associated with dilution from ‘no grade’ broken material. Procedures and processes to manage these risks have been incorporated into the operation of the mine. Despite encountering a number of challenges, the SLS method has been in use for approximately three years at Mt Wright and has proven to be viable economically, technically and operationally. This paper will discuss the challenges encountered and what was done to overcome them, the operational and financial performance to date, along with the outcomes of some successful continuous improvement projects that have improved the efficiency of the operation. 1. MAusIMM(CP), Underground Manager, Carpentaria Gold, PO Box 5802,Townsville Qld 4810. Email: dmackay@rml.com.au 2. MAusIMM(CP), Senior Mining Engineer, Carpentaria Gold, PO Box 5802,Townsville Qld 4810. Email: slong@rml.com.au 3. MAusIMM, Geology Superintendent, Carpentaria Gold, PO Box 5802,Townsville Qld 4810. Email: akoen@rml.com.au
  • 2. 12TH AUSIMM UNDERGROUND OPERATORS’CONFERENCE / ADELAIDE, SA, 24–26 MARCH 2014 D MACKAY, S LONG AND A J KOEN 206 1. a program to implement pre-charging 2. improving the charge pad construction. Pre-charging Pre-charging one to three rings in advance of the ring to be fired enables the majority of charging-related work to be completed from a work basket rather than on the rill. This practice requires appropriate risk management processes to effectively manage the hazards associated with working and using mobile equipment under charged rings. It has been successfully implemented in a number of SLC operations, including the Ridgeway Gold Mine in New South Wales (Wiggin, Trout and Macaulay, 2005). The presence of ‘reactive ground’ in the Mt Wright orebody resulted in strict sleep time conditions for the use of explosives, which initially made pre- charging at Mt Wright operationally challenging. Reactive ground is defined as rock that undergoes a spontaneous exothermic reaction after it comes into contact with nitrates (Australian Explosives Industry Safety Group, 2012). The presence of reactive ground and subsequent sleep-time restrictions at Mt Wright was known for some time prior to the implementation of SLS. It was found at that time that the oxidation of the ore was limited to an annulus around the circumference of the blastholes. Elevated temperatures (ground temperatures above 55°C) were only identified following the completion of The Bell and the establishment of the Main Production Zone in 800 Level (Figure 3). The heat source was found to be from the large mass of broken ground oxidising above the active production front. Any production holes that were connected to the broken ground above (either by a drilling breakthrough or broken ground) resulted in hot air being drawn down the production holes due to the negative pressure ventilation system. Eliminating the air pathway by blocking the hole below the breakthrough connection would quickly lower the temperature in the hole to the background rock temperature. A series of ongoing test work (both in the explosives supplier’s laboratory and at Mt Wright) was implemented to test the effectiveness of the inhibited explosives at a range of temperatures with the aim of extending the sleep time to allow pre-charging to take place. It was accepted that the drawpoint turnover rate and the presence of hot and reactive ground would restrict pre-charging to one ring only. It was envisaged that ten to 14 days sleep time would be needed to remain within the sleep time limits while allowing for operational delays to make pre-charging viable and effective. An operational trial of pre-charging was completed in a small area when seven days of sleep time was approved. This trial proved effective; however, the scheduling impacts of the sleep time limitations reinforced the need for ten to 14 days sleep time. The ongoing testing program identified some samples ahead of the active production front that had a minor reaction (temperature rise of approximately 6°C) with the inhibited explosives at very high background temperatures (80°C). This resulted in a significant reduction in allowable sleep times whilethetestingprogramwasrevisitedtoensuretheoutcomes were reliable at the full range of background temperatures. These restrictions resulted in suspension of the pre-charging FIG 1 – Sublevel cave (showing caving of the overlying strata) versus sublevel shrinkage with continuous fill (caving of the overlying strata is minimised). FIG 2 – A cross-section through a drawpoint, showing a charge pad against the base of the rill.
  • 3. 12TH AUSIMM UNDERGROUND OPERATORS’CONFERENCE / ADELAIDE, SA, 24–26 MARCH 2014 SUBLEVEL SHRINKAGE – THE MT WRIGHT STORY 207 process until appropriate sleep times could be re-established with acceptable safety factors. Test work is continuing with approved sleep times of 14 days up to 55°C (reactive ground), 16 hours at 55–65°C (hot and reactive ground), eight hours at 65–75°C (very hot and reactive ground), with no charging above 75°C. The presence of elevated temperatures (above 55°C) emanating from the apex holes and the subsequent need to block the hole short of design in order to reduce the temperature below 55°C significantly restricts the ability to pre-charge without adversely affecting drill and blast results. Charge pad construction The delays in implementing the pre-charging process (which was intended to separate people from the hazards directly at the brow), increased the importance on rectifying the charge pad issues. Charge pads (Figure 2) are constructed against the FIG 3 – A schematic section through the MtWright orebody looking south-east (from the decline).
  • 4. 12TH AUSIMM UNDERGROUND OPERATORS’CONFERENCE / ADELAIDE, SA, 24–26 MARCH 2014 D MACKAY, S LONG AND A J KOEN 208 base of the drawpoint rill to provide a stable working area for personnel involved in the charging process and to prevent the rill slumping. Reviewing their construction identified key factors to be addressed including: • • material size distribution – relatively fine material is needed to construct a suitable work platform • • only add to the pad – cutting away material results in a face that is steeper than the angle of repose and makes the pad or rill inherently unstable • • identifying when constructing a pad alone was insufficient – if overbreak occurred from the previously fired ring, it would result in the collars of the next ring to be charged being very close to the brow and additional stabilisation may be required prior to personnel access. A dedicated charge pad construction procedure was developed and an education process followed to ensure the relevant personnel understood both the construction requirements and the potential risks and consequences of non-compliance. GEOTECHNICAL Risk management Geotechnical risks were identified early in the planning stages of converting to SLS and appropriate mitigation measures were in place as part of an overarching hazard management plan. A number of the geotechnical risks stem from the proximity of the existing underground infrastructure, which was based on a sublevel open stoping mining method. The initial geotechnical monitoring program included: • • extensometers (six anchors) across the ore/waste contact adjacent to the upper areas of The Bell • • time domain reflectometry (TDR) cables across the ore/ waste contact and into the pillars between the waste pass and other mined stopes • • probe holes, observation holes and a borehole camera used in conjunction with the TDR cables • • ‘tell-tales’ connected to barricades at the accesses to waste tipples and ventilation infrastructure • • drive closure measurements in development around The Bell • • rock noise reports • • cavity monitoring surveys (CMS) of accessible openings (such as waste tipples). The migration of the relaxation zone and subsequent propagation of ground failure was initially much slower than expected; with the rock mass remaining relatively intact until approximately 18 months after the establishment of full production and the mining footprint was fully developed. The propagation of ground failure then accelerated, however, remained within expected outcomes. The onset of the relaxation and subsequent failure prompted the installation of a real-time seismic monitoring system and the commissioning of a detailed numerical model. The numerical model was calibrated using the data collected from the geotechnical monitoring program and later confirmed by results from the seismic system and subsequent failures. The accuracy of the numerical model to predict the time and extent of the failure propagation was limited by the quality of the data input, primarily associated with the definition of the extent of the alteration halo within the granite host rock surrounding the rhyolite orebody. This halo could not be readily defined from available drill core and photographs; however, it could be easily identified in areas that remained accessible once the relaxation commenced. The results of the detailed numerical modelling clearly indicated the potential for the ongoing ground failure to put critical ventilation infrastructure at risk and provided justification to replace or bypass areas at risk in order to minimise future production losses as a result of the failure propagation. The unravelling of the mineralised rhyolite around the previously mined open stopes (Figure 3) was anticipated and considered beneficial from an operational perspective, as it provided additional low-grade material in the backfill mix and reduced the quantity of backfill required. It did, however, provide a mechanism for ongoing failure propagation. Operational impacts The orientation of the longitudinal levels (905–840 Levels, Figures 3 and 4) with respect to the major principal stress (σ1 ) resulted in significant stresses across the active drawpoints as they were retreated. This was particularly noticeable in the 865 and 840 Levels as the footprint of the excavation increased markedly in size. After technical review and implementation of a new drawpoint sequencing methodology it was found that by leading with the western drawpoint in the northern retreat and the eastern drawpoint in the southern retreat (Figure 4) the majority of the damage was restricted to the outside holes of the rings in those drawpoints. The effects of the stress redistribution were then moved further behind the brow in the other drawpoints, resulting in reduced brow damage and significantly less operational problems in the charging process. Although this reduced the ability for successful interactive draw between drawpoints this was not considered material as this region of the mine provided the buffer of ore between the active levels and the waste above and therefore the recovery was planned to be low. It was recognised in the initial planning of the SLS that the orientation of σ1 and the geometry of the orebody were more favourable to a transverse layout, which would also provide more active drawpoints to assist with increasing productivity. FIG 4 – Orientation of the longitudinal levels, showing the orebody outline and approximate orientation of the Major Principal Stress (σ1 ).
  • 5. 12TH AUSIMM UNDERGROUND OPERATORS’CONFERENCE / ADELAIDE, SA, 24–26 MARCH 2014 SUBLEVEL SHRINKAGE – THE MT WRIGHT STORY 209 As mining progressed into the transverse levels (825 Level and below, see Figures 3 and 5), stress effects continued to impact on the safety and efficiency of the production front. The first two transverse levels were commenced in the middle with the slot retreating north and south, progressively bringing drawpoints on line as the slot advanced. This sequence was chosen to provide the highest number of production sources in the shortest time; however, both the slot and the production rings were again exposed to the redistribution of the mining induced stresses. The slot retreating to the north was plagued with operational problems due to the major principal stress; however, the impact was worse than was seen in the longitudinal retreats above due to the larger footprint and increased depth. These problems were not experienced in the slot retreating to the south, possibly due to the slightly different orientation of the slot and the plunge of the major principal stress. The retreat of the production rings resulted in stress effects in the production front similar to what was seen higher in the mine, but to a lesser extent due to the shadowing effect of the slot retreat. Following a review of the performance of the first two transverse levels and some localised numerical modelling, it was decided to relocate the slot rise to the northern end and retreat the slot to the south (Figure 6). In addition, the northern most drawpoint of each level was retreated rapidly to redistribute the stress well behind the production front in the remainder of the level (similar to what was done in the longitudinal levels above). The result was a stress shadow across the remaining production front that significantly improved the risk profile of the mining process. MINE PLANNING AND GEOLOGY Scheduling Short- and medium-term scheduling is critical to maintaining the stress redistribution and the production capacity of the mine. The current production profile requires 14 to 16 active drawpoints spread across two production levels. This provides the ability to maintain production rates while resolving operational issues, while also minimising the time any drawpoints sit idle, thus preventing the oxidising fines in the freshly fired ore from reconsolidating. Having the active drawpoints spread across two production levels also provides improved management and segregation of interactions between bogging, haulage, drilling and charging activities. Scheduling tonnes is a relatively simple process if done by someone with a good understanding of the operation, however, reliably forecasting the grade in the short-term has proven to be difficult due to the grade distribution effects of the coarse gold within the orebody. Reconciliation and recovery Mineralogical examination of the rhyolite orebody shows that there is a range of gold grain sizes. The presence of coarse gold presents some challenges to assay repeatability for both resource definition drilling and more detailed infill grade control. This can produce significant variations in the localised grade estimates (on a production ring scale), which provides limited reliability in short-term grade forecasting. Despite these localised variations, the ongoing mine to mill reconciliation process has provided confidence in the outputs of the block model and the mining recovery factors applied to it. The proportions of backfill and ore buffer from the reduced extraction profile in The Bell (Figure 3) reporting as dilution to the production drawpoints is unknown. This dilution has been modelled and estimated; however, there is currently no method of reconciling this with any certainty due to the number of estimated inputs to the reconciliation. This has made it difficult to determine the accuracy of the block model and dilution factors. It is likely that the block model is underestimating the grade due to the nugget effect of the coarse gold, which is being offset by increased dilution to make the final result consistent with the planned recovery. The planned recovery is determined by evaluating design shapes against the Resource model and applying extraction factors (Table 1) to the evaluation results. These outputs are used to generate the life-of-mine plan and Ore Reserve FIG 6 – Orientation of the transverse levels, showing the orebody outline, approximate orientation of the Major Principal Stress (σ1 ), and the typical retreat orientation utilised from 775 Level down to put the operating drawpoints in a stress shadow. FIG 5 – Orientation of the transverse levels, showing the orebody outline, approximate orientation of the Major Principal Stress (σ1 ), and the typical retreat orientation utilised in 825 and 800 Levels.
  • 6. 12TH AUSIMM UNDERGROUND OPERATORS’CONFERENCE / ADELAIDE, SA, 24–26 MARCH 2014 D MACKAY, S LONG AND A J KOEN 210 Estimate. A summary of the production results for each level is shown in Table 2, with a brief commentary on the variations between actual and planned extraction provided in Table 3. The drill and blast process and the drawpoint design have been the major focus for improving the orebody recovery. DRILL AND BLAST As with a SLC operation, effective drill and blast practices are critical to successful orebody recovery. It became apparent early in the trial stages that the relatively soft rhyolite did not respond well to the confined firing with conventional SLC drill and blast designs, resulting in numerous problems including frozen blasts, bridging and poor fragmentation. A significant amount of trial and error in different sections of the mine was used to refine this part of the mining cycle in order to improve the overall efficiency of the operation. The Bell The need to ramp up production with the introduction of SLS and provide sufficient active drawpoints resulted in the need to quickly and effectively establish the slot (initial firing void). Confined slot firings would restrict the rate at which this could proceed due to the soft and absorbing nature of the Rhyolite. To resolve this issue a sacrificial crown pillar 2 m thick was left between the slot and the broken material in the level above to enable unconfined blasting in the slot (Figure 7), with the crown broken by the initial production rings fired into the slot (Figure 8). The safe and successful use of this method required strict sequencing of the retreating slot and drawpoint establishment to limit the exposure length of the sacrificial crown. The 2.6 m burden (89 mm blastholes) used in the initial longitudinal levels was too great, resulting in poor FIG 8 –Typical cross-section through a production drawpoint showing the slot on the right with the sacrificial crown pillar and the production rings extending into the sacrificial crown to the level above. FIG 7 –Typical cross-section through a slot drive, showing the uphole rise on the left, rows of blastholes in the slot drive, and the 2 m crown pillar separating the slot from the level above. Level Planned extraction factors Planned recovery Actual recovery Actual versus planned Slot Rings Tonnes Grade Tonnes Grade Tonnes (%) Au (oz) Tonnes (%) Grade (%) Tonnes (%) Grade (%) Au g/t Au g/t (%) The Bell Longitudinal 905 50 100 30 80 8029 2.95 11 220 2.95 140 140 880 50 100 50 80 43 168 2.59 47 221 2.55 109 108 865 50 100 50 80 75 808 2.32 78 574 2.63 104 118 840 50 100 70 80 135 360 2.28 155 989 2.28 115 115 Transverse 825 50 100 70 80 220 794 2.11 252 226 2.31 114 125 Main Production Zone 800 50 100 100 80 364 032 2.78 379 119 2.83 104 106 775 50 100 100 80 503 171 2.93 424 124 2.90 84 83 750 50 100 100 80 467 845 3.19 418 069 3.03 89 85 725 50 100 100 80 546 016 2.98 495 816 3.18 91 97 700 50 100 100 80 628 884 2.91 631 269 2.97 100 103 675 50 100 100 80 Mining incomplete 650 50 100 100 80 Mining incomplete 625 50 100 TBC TBC Mining incomplete 600 50 100 TBC TBC Mining incomplete Total 2 993 107 2.85 2 893 628 2.88 97 98 TABLE 2 Historic reconciliation. Ore source Tonnage factor (%) Grade factor (%) Development 100 100 Slot 50 100 Production rings 100 80 TABLE 1 Recovery factors applied in the mine plan for the Main Production Zone.
  • 7. 12TH AUSIMM UNDERGROUND OPERATORS’CONFERENCE / ADELAIDE, SA, 24–26 MARCH 2014 SUBLEVEL SHRINKAGE – THE MT WRIGHT STORY 211 fragmentation. This required the inclusion of easer holes between rings to assist in the successful establishment of The Bell. The ring spacing was closed up to 2.0 m after a number of trials of various parameters. This improved the breakage in front of the ring and limited the creation of slots along the ring plane. It also became apparent in the early stages of establishing The Bell that nominal millisecond (ms) hole-hole delays of 25 ms were ineffective, often failing to effectively break the rock mass. Longer delays (50–250 ms) tended to provide larger but complete fragmentation with improved recovery. Faster delays (17 ms, or less if fired with electronic detonators) tended to produce very fine particle sizes from within a channel approximately 0.5–1.0 m wide at the ring plane, but with minimal breakage out to the face of the previous ring. The faster firings only allowed a relatively small portion of the planned extraction before the drawpoint would open up, requiring significant effort to resolve. They did, however, prove to be an effective means of re-slotting (to re-establish a free face) in situations where bridges had been left behind. Main Production Zone Many of the operational lessons learned in establishing The Bell were transferred into the Main Production Zone, however additional trialling and refining was required due to the different orientation of the production front and the significantly larger footprint. The initial transverse levels (825 and 800 Levels) were broken into panels utilising two different ring designs (one centre hole and two centre holes, Figure 9) and three different timing regimes (fast: 17–25 ms, medium: 50–250 ms and slow: 250–500 ms). The results showed the medium timing provided the best results in terms of ore recovery and operational performance. The subsequent transverse level (775 Level) further refined the medium timing regime. Radio Frequency Identification (RFID) markers for flow measurement were installed in specific areas between production rings, with the location of each marker recorded to enable future measurement of the material flow and provide data for further refining the drill and blast process. Hot and reactive ground became a significant issue that has restricted the ability to pre-charge the production rings as previously mentioned. As the heat source was shown to be from the air drawn through the broken material above, holes had to be blocked off to exclude the heat and provide a safe method of charging the holes. This resulted in the centre four to six holes in many of the production rings being charged short, which subsequently impacted on the ability to achieve the planned recovery. The ring design was modified to reduce Level Planned extraction (%) Actual versus planned (%) Comments on variation to plan 905 30 140 30% extraction to remove swell from blasting and leave the remainder as an ore buffer between the waste fill and the production front. Firings became too confined giving poor results, hence the extraction was increased above the plan. 880 50 109 Learning to resolve operational problems associated with hang-ups, some over-extraction to close the brow. Overbreak caused the next ring to be charged being up inside the brow on a number of occasions, which inadvertently led to the subsequent ring being charged with too much burden. Ring design parameters did not provide sufficient charge distribution for confined firing in the soft rhyolite, necessitating easer rings. 865 50 104 Stress effects of the longitudinal retreat became apparent as the size of the excavation increased. Continuing to make improvements to the resolve the issues from 880 Level. 840 70 115 Increased stress effects due to the larger excavation.The orientation of the retreating production front to manage the stress redistribution did not provide optimum draw recovery. 825 70 114 The first transverse level. Panels of different ring design and firing sequences produced variable results across the level, along with inconsistent ring shapes due to change in orientation. Stress effects from the shape of the centre-out production front were not beneficial. 800 100 104 Further refinement of the blast design from the trials in 825 Level in different panels of drawpoints, again with variable, but improved, results across the level. Early migration of waste backfill to the end drawpoints (Figure 3) due to limited confinement ofThe Bell, demonstrated by recovery of radio frequency identification (RFID) markers from the waste backfill stream in the southern end of 800 Level. Continued stress effects along the production front. 775 100 84 Creating a stress shadow by changing the mining sequence of the production front to north–south improved the operational performance. Charging practices due to‘hot and reactive ground’resulted in poor fragmentation of the apex, which subsequently impacted on recovery. Further waste migration in the end drawpoints, with recovery of RFID markers from the waste backfill stream in the northern end of 775 Level. Reduced recovery in the end drawpoints to mitigate the waste migration and re- establish the ore buffer. 750 100 89 Some improvements to the drill and blast practices to manage the effects of the‘hot and reactive ground’. Reduced recovery in the end drawpoints to re-establish the ore buffer. 725 100 91 Further drill and blast improvements reduced the prevalence of‘hot’holes, which subsequently improved recovery.Variations to the drill and blast design as a result of the material flow measurement results. 700 100 100 Continued improvements in the drill and blast processes improved recovery. 675 100 TBC Back height reduced in the production drawpoints to allow deeper penetration into the rill with the loader bucket to improve the primary ore recovery. 650 100 TBC Drawpoint width increased to provide a wider draw cone and improved interaction between drawpoints to improve the primary ore recovery. TABLE 3 Summary of level performance.
  • 8. 12TH AUSIMM UNDERGROUND OPERATORS’CONFERENCE / ADELAIDE, SA, 24–26 MARCH 2014 D MACKAY, S LONG AND A J KOEN 212 the potential for unplanned breakthroughs into the broken material above, while still maintaining adequate breakage. As the Main Production Zone progressed, additional flow measurement markers were recovered. Reviewing this data in conjunction with observations from the charging process resulted in further refinements to the drill design. Observations from the material flow markers showed that primary recovery deteriorated in conjunction with blasting issues stemming from hot and reactive ground. Improved drill and blast practices that restrict or eliminate the flow of hot air through the blastholes have now reversed this trend. In particular, recovery of markers in the apex area improved from 20 to 41 per cent and the primary recovery improved from 30 to 32 per cent, which will ultimately improve the resource recovery and reduce the likelihood of funneling waste dilution into the production drawpoints as the production front advances. The current drill and blast design (Figure 10) contradicts what is generally accepted as conventional SLC blasting practices. Conventional practices, using faster hole-hole delays, have been demonstrated to be ineffective at Mt Wright through numerous trials and measurements. This is likely due to the soft and absorbing nature of the rhyolite. MATERIAL FLOW Flow measurement Material flow measurement in the production zone was done using the Radio Frequency Identification (RFID) Smart Marker System (Whiteman, 2010), with markers installed and grouted in rings between a number of the production rings. These marker installations were aligned laterally across a number of drawpoints and vertically across a number of levels. The recovery of the RFID markers was measured using readers in each level, with the marker recovery assumed to simulate ore recovery. The installation used at Mt Wright only measured which level the markers were recovered from and an approximate date of recovery, as the use of stockpiles in the levels to ensure efficient truck loading reduced the accuracy of the time stamp relative to when the marker was recovered from a drawpoint. The results from the material flow measurement were used to make improvements to the drill and blast process and the drawpoint design. Areas of poor recovery were attributed to poor fragmentation and the charge distribution was improved, which subsequently improved the marker recovery. The drive profile of the production drawpoints was altered to improve the primary recovery by: • • reducing the back height, which moves the base of the drawpoint rill closer to the brow, thereby allowing the loader bucket to penetrate deeper into the fired ring • • increasing the drive width, which provides a wider base for the draw cone, thereby increasing the effective draw width of the fired ring. These changes to the design layout are expected to provide further improvements to the ore recovery in addition to those realised from the improvements to the drill and blast practices. Flow modelling The results from the material flow measurement were used both for design improvements and to calibrate the material flow model used to assist in evaluating overdraw scenarios. Overdraw of levels may be used to recover some of the fired material left within the production zone, at the cost of a reduced head grade. The amount of overdraw, if any, will be subject to an overall financial evaluation to ensure that maximum value is achieved. OPERATIONAL CONTROL Improvements to the drill and blast process and the drawpoint design will only make improving the recovery of the orebody technically possible. Successful implementation of these improvements requires strict operational control of the production rate and sequence from each drawpoint to ensure an even rate of draw to maximise recovery and minimise dilution. The controls need to be simple in order to be effective. Bogging record sheets are kept in the mine muster area to track the number of buckets taken from each drawpoint and the remaining bucket count is updated on the shift board at the end of each shift. The production shift board is a schematic that shows the drawpoint status, the current ring number, and the number of buckets remaining to extract from each ring (Figure 11). The schematic is aligned similar to the drawpoint layout to provide all stakeholders a simple visual tool for viewing the production status, bogging and charging activities, and drill locations within the production levels. It is printed at the start of each shift and all personnel receive a copy at the pre-shift meeting. Electronic tracking systems are available to improve the production management and reporting; however, the time and resources to install and manage the system could not be justified for the known Reserve. As such, production management at Mt Wright requires a disciplined approach from all levels of personnel to ensure the accuracy of the data and the overall value of the Resource is maximised. FIG 10 – Schematic of the current drill and blast design showing firing delays in milliseconds. FIG 9 – Schematic of the two drill designs used during the drill and blast trials.
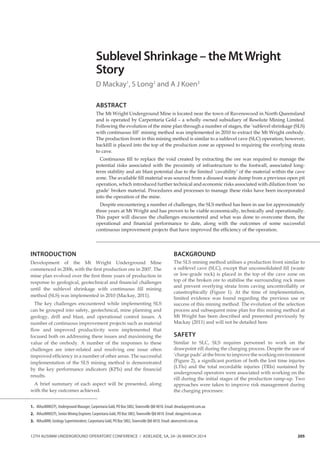
  • 9. 12TH AUSIMM UNDERGROUND OPERATORS’CONFERENCE / ADELAIDE, SA, 24–26 MARCH 2014 SUBLEVEL SHRINKAGE – THE MT WRIGHT STORY 213 Production interactions are managed using simple wall plans. As each production ring is drilled it is marked off on a wall plan. Similarly, as each production ring is fired it is marked on the same wall plan with the date it was fired and the explosive product used. These simple visual tools assist with the scheduling of production activities to manage interactions between drawpoints and levels and provide a clear indication of the available drilled stocks. A qualitative assessment of each drawpoint is completed by the geotechnicians each day and includes visual assessments of fragmentation, any water drainage, and the proportion of ore. The bogger operators also complete a qualitative assessment of the drawpoint performance that includes fragmentation through the ring, ease of bogging, and recovery compared to plan. All of these assessments are compiled and plotted on a set of SLS performance level plans in the mining office to create a visual assessment of each level. They are simple plans using three colours (representing good, average, poor) for draw performance, fragmentation and extraction. These plans provide a simple overview of the production performance and assist in identifying trends for further improvement in design and sequencing. The technical and operational aspects of the operation discussed above are primarily aimed at producing quality tonnes at the highest grade and lowest dilution that is possible from the SLS method. Maximising the delivery of these quality tonnes to the processing plant is required to minimise the unit cost. A number of performance enhancing projects have been implemented to improve the efficiency of the production fleet. PERFORMANCE ENHANCEMENT The SLS mining method is capable of much higher production rates than what the Mt Wright infrastructure was designed for, particularly ventilation capacity and decline traffic. Increasing production rates by expansion of infrastructure was shown to be very capital intensive and difficult to justify over the relatively short mine life. Consequently, increased capacity had to be driven by improved efficiency of the available resources. Maintenance The availability of the trucking fleet is critical to maximising the productivity of the haulage fleet. The haulage fleet was the highest priority for the maintenance department to return to service, often to the detriment of other parts of the mobile equipment fleet. Independent consultants were used to review the maintenance practices across the site and it was found there were insufficient maintenance work-hours available to complete the scheduled servicing of equipment. As such, manning levels were expanded to provide sufficient resources to complete scheduled servicing and also cover breakdowns in a timely manner. The additional work-hours resulted in a significant improvement in planned job completion and an increased ratio of planned to unplanned maintenance work, which materially improved the efficiency of the operation. Efficiency Ventilation restrictions limit the underground trucking fleet to six at any one time. In order to improve the production capacity, the efficiency of the haulage fleet had to be maximised. The improvements in the fleet maintenance were accompanied by operational improvements to maximise the utilisation of available hours, the effective operating time of the fleet, and the payload in each truck. These were done predominantly via administrative processes that included: • • loading from drawpoints to stockpiles and loading trucks from stockpiles, which have a shorter digging time and shorter tram for the loader • • establishing a safe and effective hot-seating regime to maintain continuity of production throughout each shift • • ensuring the trucks are parked up in sequence at the end of the shift with the loader driver picking up all the truck drivers in a light vehicle on the way to the surface at the end of the shift to maximise hauling time, rather than all trucks stopping on the surface at the end of the shift • • using effective communication between truck drivers to minimise queuing time while waiting for either loaded trucks to pass on the decline or while waiting for a load • • targeted training of loader operators for loading the trucks in a manner that maximised the payload. FIG 11 – Image from the production shift board.
  • 10. 12TH AUSIMM UNDERGROUND OPERATORS’CONFERENCE / ADELAIDE, SA, 24–26 MARCH 2014 D MACKAY, S LONG AND A J KOEN 214 The combination of maintenance and operational improvements resulted in a 21 per cent increase in average operating hours per truck per month and an 18 per cent increase in payload, which is summarised in Table 4. These achievements were made over a period of approximately six months and have been sustained for two years. The annualised production rate has increased by 15 per cent from 1.46 to 1.67 Mt/a while the centroid of mining moved 150 m deeper, adding 1.1 km (25 per cent) to the haul distance. Backfill delivery Further trucking capacity improvements were made by linking the waste pass through to a dedicated tipping point. Initially, the crown pillar between Stopes 4 and 6 (Figure 3) was removed and waste was delivered via a waste pass in 1120 Level. This required the haulage fleet to be loaded with waste on the surface (1345 Level) and backloaded to the 1120 Level. The additional loading time and the subsequent speed restrictions on travelling loaded downhill slowed the trucking cycle. Also the additional wear and tear this caused to the trucks did not assist in reducing down time. In 2012 a dedicated portal was established to access a tipping point approximately 100 m above Stope 2, and the crown pillar between Stopes 2 and 4 was removed (Figure 3). This reduced the requirement for backloading of waste thereby increasing the time available for ore haulage and minimising downtime associated with downhill haulage. An underground waste pass was used to provide an underground tipping point for waste generated from development, thus eliminating the need to haul development waste to the surface for delivery into the main waste pass. Ongoing monitoring is used to determine the fill level in each system and waste can be preferentially delivered to either as required. Backloading surface waste to the underground tipple currently accounts for approximately ten per cent of the total backfill delivered from the surface. The improved operational efficiencies achieved through these projects has provided increased production rates and maintained the cost of production despite the increasing depth of the production front. PHYSICAL AND FINANCIAL KEY PERFORMANCE INDICATORS The SLS mining method moved into steady state full production as the majority of the low-grade dumps from the open pit operation were depleted. The processing plant was then converted from a nominal throughput of 5.0 to 1.5 Mt/a in September 2011. In order to demonstrate the viability of the SLS mining method at Mt Wright, a summary of the physical and financial KPIs from the quarter following the process plant conversion is shown in Table 5, Figure 12 (physical KPIs), and Figure 13 (financial KPIs). This time period correlates with the production overlap between 800 and 775 Levels and continues until the time of writing, which correlates with the overlap of 675 and 650 Levels (refer to Table 2). CONCLUSIONS Following the completion of the open pit operations, the process plant throughput was reduced from 5.0 to 1.5 Mt/a leaving the Mt Wright underground operation as the primary ore source. During this time, the productivity of the haulage fleet has improved by 43 per cent and coupled with the FIG 12 – Physical key performance indicators (previous two years). Parameter 2011 2013 Improvement Average operating hours per truck 455 hours/month (64% of total hours) 550 hours/month (76% of total hours) 95 hours/month (operating 21% more) Average payload (reconciled dry tonnes) 44 t 52 t 8 t (18% increase) TABLE 4 Haulage improvements from 2011–2013. Key performance indicators Units Quarter ending Total Dec 11 Mar 12 Jun 12 Sep 12 Dec 12 Mar 13 Jun 13 Sep 13 Underground ore mined kt 360 369 376 381 375 400 402 420 3 082 Underground grade g/t 2.76 3.15 3.01 3.20 2.85 3.11 2.99 3.00 3.01 Gold produced oz 32 938 36 968 34 846 35 948 33 123 38 281 34 495 39 051 285 648 Depth of production m 545 570 570 595 620 645 670 695 Recovery % 93.6 93.6 92.7 94.1 95.4 95.7 94.4 95.0 96.0 Cash cost $/oz 795 663 816 731 844 741 734 735 755 TABLE 5 Physical and financial key performance indicators.
  • 11. 12TH AUSIMM UNDERGROUND OPERATORS’CONFERENCE / ADELAIDE, SA, 24–26 MARCH 2014 SUBLEVEL SHRINKAGE – THE MT WRIGHT STORY 215 other improvements in operational efficiency has produced results exceeding the expectations. Despite the reduced plant throughput, these productivity improvements have resulted in cash costs that clearly demonstrate the implementation of the SLS mining method has been successful in safely and efficiently maximising the value of the Mt Wright Resource. The major challenges in establishing and improving the operation have been discussed, along with a brief summary of the processes used to resolve them and the outcomes achieved. It should be noted that this paper presents a brief summary of the operation and significantly more detail was involved in resolving each of these challenges than could be presented here. When viewed in its entirety, it can be seen that each challenge has impacts on other areas. While the process of resolving some of these challenges has been detrimental to other areas, generally the final resolution has provided an overall improvement. ACKNOWLEDGEMENTS The authors would like to thank Carpentaria Gold Pty Ltd and Resolute Mining Limited for allowing this paper to be published. While a number of people have contributed to the success of Mt Wright in recent years, the authors would like to particularly acknowledge the following people: Jarek Jakubec (SRK Consulting (Canada) Inc) for imparting some of his knowledge and wisdom to the technical staff at Carpentaria Gold; Simon Steffen (Elexon Mining) for his assistance in material flow measurement; David Sainsbury (Itasca Australia Pty Ltd) for the development, calibration and interpretation of the Mt Wright numerical model; Dr Francis Pitard (Francis Pitard Sampling Consultants) for his guidance on improving the sampling and reconciliation processes at Ravenswood and Charles Knight (333 Consulting) for his assistance with improving the mobile fleet maintenance practices. REFERENCES Australian Explosives Industry Safety Group (AEISG), 2012. Code of Practice, Elevated Temperature and Reactive Ground, Edition 3 June 2012 [online]. Available from: <http://www.aeisg.org/ index.php/cop.html>. Mackay, D, 2011. Implementing and improving the mine plan at the Mt Wright Project, in Proceedings 11th Underground Operators’ Conference 2011, pp 135–142 (The Australasian Institute of Mining and Metallurgy: Melbourne). Whiteman, D S, 2010. The Smart Marker System – a new tool for measuring underground orebody flow in block and sublevel mines, in Proceedings Second International Symposium on Block and Sublevel Caving (ed: Y Potvin), pp 603–621 (Australian Centre for Geomechanics: Perth). Wiggin, M, Trout, P and Macaulay, B, 2005. Solving the problems of precharging sublevel caving rings at Ridgeway Gold Mine, in Proceedings Ninth Underground Operators’ Conference 2005, pp 81–89 (The Australasian Institute of Mining and Metallurgy: Melbourne). FIG 13 – Financial key performance indicators (previous two years).