DAILY DERIVATIVE REPORT SUMMARY
•
1 like•123 views

- The Indian stock market indices closed lower on Thursday due to weaker-than-expected GDP growth data. The Sensex ended up 109 points while the Nifty gained 42 points. - Nifty futures witnessed pressure around 8850 and closed 20 points lower. Banking and auto stocks rose while Reliance saw selling after its AGM. - FIIs sold stocks and index futures worth Rs. 302 crore and Rs. 405 crore respectively while DIIs purchased stocks worth Rs. 308 crore.
![DAILY DERIVATIVE REPORT
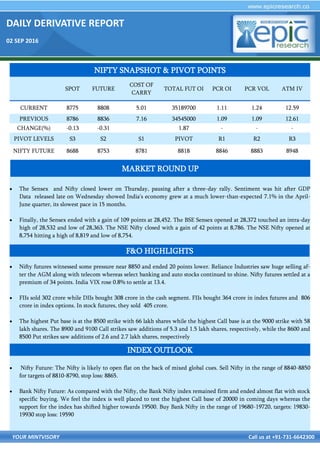
02 SEP 2016
YOUR MINTVISORY Call us at +91-731-6642300
INTRADAY STRATEGY
i) TVS MOTORS FUTURE ii IDEA FUTURE
Buy future around 330-332 Sell future around 83-84
View : Bullish View : Bearish
Strategy : Buy Future Strategy : Sell Future
Target1: 338 Target 2 : 342 Target1: 81 Target 2 : 79
Stop loss : 326 Stop loss : 85
Market Lot : 2000 ,CMP : 334.55 Market Lot : 5000 ,CMP : 82.10
STOCK ANALYSIS
OPEN INTEREST ACTIVITY
LONG BUILD UP SHORT BUILD UP
SYMBOL OI (LOTS)
%
CHNG
PRICE %CHNG SYMBOL OI (LOTS)
%
CHNG
PRICE %CHNG
VOLTAS 1954.00 17.6 391.95 2.70 PETRONET 1039.00 11.8 336.75 [0.2]
BIOCON 3435.00 13.3 898.55 2.90 RELINFRA 8991.00 11.7 582.10 [2.4]
BEML 1672.00 12.2 1062.80 2.00 JUBLFOOD 3088.00 11 1216.60 [1.7]
LICHSGFIN 7162.00 12.1 581.50 3.50 HDIL 3467.00 10.4 92.75 [3.2]
CENTURYTEX 6542.00 9 714.00 5.70 ALBK 1070.00 5.7 78.90 [1.4]
OI addition : We saw long build-up in voltas, biocon, beml, lichsgfin, century text while short build-up was seen in
petronet, relinfra, jublfood, hdil, albk.
OI Shedding : We saw short covering in Siemens, divis lab, godrej ind, ifci, bpcl whereas long closure was seen in
colpal, marico, Apollo tyre, hdfc, dlf.](data:image/gif;base64,R0lGODlhAQABAIAAAAAAAP///yH5BAEAAAAALAAAAAABAAEAAAIBRAA7)
Recommended
Recommended
More Related Content
What's hot
What's hot (20)
Viewers also liked
Viewers also liked (12)
Similar to DAILY DERIVATIVE REPORT SUMMARY
Similar to DAILY DERIVATIVE REPORT SUMMARY (20)
Recently uploaded
Recently uploaded (20)
DAILY DERIVATIVE REPORT SUMMARY
- 1. DAILY DERIVATIVE REPORT 02 SEP 2016 YOUR MINTVISORY Call us at +91-731-6642300 The Sensex and Nifty closed lower on Thursday, pausing after a three-day rally. Sentiment was hit after GDP Data released late on Wednesday showed India's economy grew at a much lower-than-expected 7.1% in the April- June quarter, its slowest pace in 15 months. Finally, the Sensex ended with a gain of 109 points at 28,452. The BSE Sensex opened at 28,372 touched an intra-day high of 28,532 and low of 28,363. The NSE Nifty closed with a gain of 42 points at 8,786. The NSE Nifty opened at 8,754 hitting a high of 8,819 and low of 8,754. Nifty futures witnessed some pressure near 8850 and ended 20 points lower. Reliance Industries saw huge selling af- ter the AGM along with telecom whereas select banking and auto stocks continued to shine. Nifty futures settled at a premium of 34 points. India VIX rose 0.8% to settle at 13.4. FIIs sold 302 crore while DIIs bought 308 crore in the cash segment. FIIs bought 364 crore in index futures and 806 crore in index options. In stock futures, they sold 405 crore. The highest Put base is at the 8500 strike with 66 lakh shares while the highest Call base is at the 9000 strike with 58 lakh shares. The 8900 and 9100 Call strikes saw additions of 5.3 and 1.5 lakh shares, respectively, while the 8600 and 8500 Put strikes saw additions of 2.6 and 2.7 lakh shares, respectively Nifty Future: The Nifty is likely to open flat on the back of mixed global cues. Sell Nifty in the range of 8840-8850 for targets of 8810-8790, stop loss: 8865. Bank Nifty Future: As compared with the Nifty, the Bank Nifty index remained firm and ended almost flat with stock specific buying. We feel the index is well placed to test the highest Call base of 20000 in coming days whereas the support for the index has shifted higher towards 19500. Buy Bank Nifty in the range of 19680-19720, targets: 19830- 19930 stop loss: 19590 NIFTY SNAPSHOT & PIVOT POINTS SPOT FUTURE COST OF CARRY TOTAL FUT OI PCR OI PCR VOL ATM IV CURRENT 8775 8808 5.01 35189700 1.11 1.24 12.59 PREVIOUS 8786 8836 7.16 34545000 1.09 1.09 12.61 CHANGE(%) -0.13 -0.31 1.87 - - - PIVOT LEVELS S3 S2 S1 PIVOT R1 R2 R3 NIFTY FUTURE 8688 8753 8781 8818 8846 8883 8948 F&O HIGHLIGHTS INDEX OUTLOOK MARKET ROUND UP
- 2. DAILY DERIVATIVE REPORT 02 SEP 2016 YOUR MINTVISORY Call us at +91-731-6642300 INTRADAY STRATEGY i) TVS MOTORS FUTURE ii IDEA FUTURE Buy future around 330-332 Sell future around 83-84 View : Bullish View : Bearish Strategy : Buy Future Strategy : Sell Future Target1: 338 Target 2 : 342 Target1: 81 Target 2 : 79 Stop loss : 326 Stop loss : 85 Market Lot : 2000 ,CMP : 334.55 Market Lot : 5000 ,CMP : 82.10 STOCK ANALYSIS OPEN INTEREST ACTIVITY LONG BUILD UP SHORT BUILD UP SYMBOL OI (LOTS) % CHNG PRICE %CHNG SYMBOL OI (LOTS) % CHNG PRICE %CHNG VOLTAS 1954.00 17.6 391.95 2.70 PETRONET 1039.00 11.8 336.75 [0.2] BIOCON 3435.00 13.3 898.55 2.90 RELINFRA 8991.00 11.7 582.10 [2.4] BEML 1672.00 12.2 1062.80 2.00 JUBLFOOD 3088.00 11 1216.60 [1.7] LICHSGFIN 7162.00 12.1 581.50 3.50 HDIL 3467.00 10.4 92.75 [3.2] CENTURYTEX 6542.00 9 714.00 5.70 ALBK 1070.00 5.7 78.90 [1.4] OI addition : We saw long build-up in voltas, biocon, beml, lichsgfin, century text while short build-up was seen in petronet, relinfra, jublfood, hdil, albk. OI Shedding : We saw short covering in Siemens, divis lab, godrej ind, ifci, bpcl whereas long closure was seen in colpal, marico, Apollo tyre, hdfc, dlf.
- 3. DAILY DERIVATIVE REPORT 02 SEP 2016 YOUR MINTVISORY Call us at +91-731-6642300 Instrument Type Symbol Expiry Date Option Type Strike Price LTP Traded Volume (Contracts) Traded Value (Lakhs) OPTSTK TATAMOTORS 29SEP2016 CE 520 18.45 3,958 31,773.04 OPTSTK RCOM 29SEP2016 CE 60 1.30 3,265 19,972.01 OPTSTK TATAMOTORS 29SEP2016 CE 500 29.60 2,929 22,972.73 OPTSTK TATAMOTORS 29SEP2016 CE 510 23.50 2,818 22,345.19 OPTSTK RCOM 29SEP2016 CE 55 2.75 2,382 13,694.12 MOST ACTIVE CALLS MOST ACTIVE PUTS Instrument Type Symbol Expiry Date Option Type Strike Price LTP Traded Volume (Contracts) Traded Value (Lakhs) OPTSTK TATAMOTORS 29SEP2016 PE 500 11.30 3,829 29,726.63 OPTSTK TATAMOTORS 29SEP2016 PE 480 6.10 3,069 22,585.69 OPTSTK TATAMOTORS 29SEP2016 PE 490 8.35 2,331 17,613.97 OPTSTK LT 29SEP2016 PE 1,400 22.50 2,094 14,878.60 OPTSTK RELIANCE 29SEP2016 PE 1,000 9.85 1,346 6,804.30 FII ACTIVITY (IN RS. CRORE) BUY SELL OPEN INTEREST AT THE END OF THE DATE DERIVATIVE PRODUCT NO.OF CON- TRACTS AMOUNT IN CRORES NO.OF COTRACTS AMOUNT IN CRORES NO. OF CONTRACTS AMOUNT IN CRORES INDEX FUTURES 33406 2246.46 17542 1195.35 352675 23197.59 INDEX OPTIONS 461479 31692.76 449855 30881.42 840725 54571.87 STOCK FUTURES 77111 5335.14 80139 5487.88 813755 53214.68 STOCK OPTIONS 51127 3538.87 48698 3344.90 32421 2180.27
- 4. DAILY DERIVATIVE REPORT 02 SEP 2016 YOUR MINTVISORY Call us at +91-731-6642300 DISCLAIMER The information and views in this report, our website & all the service we provide are believed to be reliable, but we do not accept any responsibility (or liability) for errors of fact or opinion. Users have the right to choose the product/s that suits them the most. Sincere efforts have been made to present the right investment perspective. The information contained herein is based on analysis and up on sources that we consider reliable. This material is for personal information and based upon it & takes no responsibility. The information given herein should be treated as only factor, while making investment decision. The report does not provide individually tailor-made investment advice. Epic research recommends that investors independently evaluate particular investments and strategies, and encourages investors to seek the advice of a financial adviser. Epic research shall not be responsible for any transaction conducted based on the information given in this report, which is in violation of rules and regulations of NSE and BSE. The share price projections shown are not necessarily indicative of future price performance. The information herein, together with all estimates and forecasts, can change without notice. Analyst or any person related to epic re- search might be holding positions in the stocks recommended. It is understood that anyone who is browsing through the site has done so at his free will and does not read any views expressed as a recommendation for which either the site or its owners or anyone can be held responsible for Any surfing and reading of the information is the acceptance of this disclaimer. All Rights Reserved. Investment in equity & bullion mar- ket has its own risks. We, however, do not vouch for the accuracy or the completeness thereof. We are not responsible for any loss incurred whatsoever for any financial profits or loss which may arise from the recommendations above epic research does not purport to be an invitation or an offer to buy or sell any financial instrument. Our Clients (Paid or Unpaid), any third party or anyone else have no rights to forward or share our calls or SMS or Report or Any Information Provided by us to/with anyone which is received directly or indirectly by them. If found so then Serious Legal Actions can be taken. PRICE VOLUME OI MARKET RISING UP UP STRONG RISING DOWN DOWN WEAK DECLINING UP UP WEAK DECLINING DOWN DOWN STRONG GENERAL RULES FOR OPEN INTEREST & VOLUME