DAILY DERIVATIVE REPORT SUMMARY
•
0 likes•34 views

The Indian stock market ended almost unchanged on July 8, with the BSE Sensex gaining 35 points to close at 27,201 and the NSE Nifty closing nearly flat at 8,338. Trading was lackluster and stuck in a narrow range after markets enjoyed a mid-week break. Selling was seen in select public sector, auto, and IT stocks. FIIs sold Rs. 300 crore in the cash segment and Rs. 224 crore in index futures, while DIIs sold Rs. 160 crore in the cash segment. Most active calls were in Ashokley, Reliance, and Tata Steel, while most active puts were in Tata Steel, SBI, and Ashokley
![DAILY DERIVATIVE REPORT
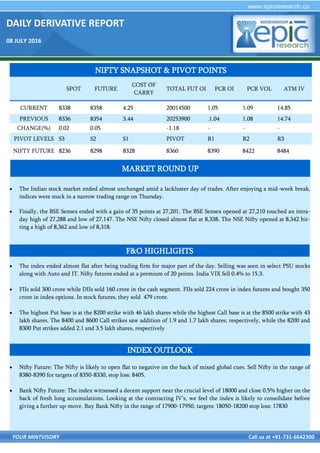
08 JULY 2016
YOUR MINTVISORY Call us at +91-731-6642300
INTRADAY STRATEGY
i) HINDALCO FUTURE ii IOC FUTURE
Buy future around 130-131 Buy future around 470-475
View : Bullish View : Bullish
Strategy : Buy Future Strategy : Buy Future
Target1: 133 Target 2 : 135 Target1: 480 Target 2 : 485
Stop loss : 128 Stop loss : 464
Market Lot : 7000 ,CMP : 129.20 Market Lot : 1500 ,CMP : 475.5
STOCK ANALYSIS
OPEN INTEREST ACTIVITY
LONG BUILD UP SHORT BUILD UP
SYMBOL OI (LOTS)
%
CHNG
PRICE %CHNG SYMBOL OI (LOTS)
%
CHNG
PRICE %CHNG
BPCL 11535.00 25.3 1110.00 1.60 NIITTECH 661.00 34.6 500.45 [5.0]
HINDALCO 5411.00 18.3 128.75 3.50
AMARAJA-
BAT
1555.00 24.7 837.55 [2.7]
EXIDEIND 2302.00 17.7 176.45 3.20 TATASTEEL 13607.00 23.9 310.45 [5.2]
ACC 2094.00 15.8 1616.50 1.10 TCS 14311.00 18.3 2438.00 [2.0]
DRREDDY 9130.00 12.1 3547.00 2.80 APOLLOTYRE 3061.00 14.3 150.50 [4.0]
OI addition : We saw long built up in bpcl, hindalco, exide ind, acc, drreddy while short built up was seen
in niit tech, amaraja batt, tatasteel, tcs , apollotyre.
OI Shedding : We saw short covering was seen in exide ind, hindalco, hdfc ,long unwinding was seen in cum-
minsind, ibulhsgfin, bajajfinance.](data:image/gif;base64,R0lGODlhAQABAIAAAAAAAP///yH5BAEAAAAALAAAAAABAAEAAAIBRAA7)
Recommended
Recommended
More Related Content
What's hot
What's hot (20)
Similar to DAILY DERIVATIVE REPORT SUMMARY
Similar to DAILY DERIVATIVE REPORT SUMMARY (18)
Recently uploaded
Recently uploaded (20)
DAILY DERIVATIVE REPORT SUMMARY
- 1. DAILY DERIVATIVE REPORT 08 JULY 2016 YOUR MINTVISORY Call us at +91-731-6642300 The Indian stock market ended almost unchanged amid a lackluster day of trades. After enjoying a mid-week break, indices were stuck in a narrow trading range on Thursday. Finally, the BSE Sensex ended with a gain of 35 points at 27,201. The BSE Sensex opened at 27,210 touched an intra- day high of 27,288 and low of 27,147. The NSE Nifty closed almost flat at 8,338. The NSE Nifty opened at 8,342 hit- ting a high of 8,362 and low of 8,318. The index ended almost flat after being trading firm for major part of the day. Selling was seen in select PSU stocks along with Auto and IT. Nifty futures ended at a premium of 20 points. India VIX fell 0.4% to 15.3. FIIs sold 300 crore while DIIs sold 160 crore in the cash segment. FIIs sold 224 crore in index futures and bought 350 crore in index options. In stock futures, they sold 479 crore. The highest Put base is at the 8200 strike with 46 lakh shares while the highest Call base is at the 8500 strike with 43 lakh shares. The 8400 and 8600 Call strikes saw addition of 1.9 and 1.7 lakh shares, respectively, while the 8200 and 8300 Put strikes added 2.1 and 3.5 lakh shares, respectively Nifty Future: The Nifty is likely to open flat to negative on the back of mixed global cues. Sell Nifty in the range of 8380-8390 for targets of 8350-8330, stop loss: 8405. Bank Nifty Future: The index witnessed a decent support near the crucial level of 18000 and close 0.5% higher on the back of fresh long accumulations. Looking at the contracting IV’s, we feel the index is likely to consolidate before giving a further up-move. Buy Bank Nifty in the range of 17900-17950, targets: 18050-18200 stop loss: 17830 NIFTY SNAPSHOT & PIVOT POINTS SPOT FUTURE COST OF CARRY TOTAL FUT OI PCR OI PCR VOL ATM IV CURRENT 8338 8358 4.25 20014500 1.05 1.09 14.85 PREVIOUS 8336 8354 3.44 20253900 .1.04 1.08 14.74 CHANGE(%) 0.02 0.05 -1.18 - - - PIVOT LEVELS S3 S2 S1 PIVOT R1 R2 R3 NIFTY FUTURE 8236 8298 8328 8360 8390 8422 8484 F&O HIGHLIGHTS INDEX OUTLOOK MARKET ROUND UP
- 2. DAILY DERIVATIVE REPORT 08 JULY 2016 YOUR MINTVISORY Call us at +91-731-6642300 INTRADAY STRATEGY i) HINDALCO FUTURE ii IOC FUTURE Buy future around 130-131 Buy future around 470-475 View : Bullish View : Bullish Strategy : Buy Future Strategy : Buy Future Target1: 133 Target 2 : 135 Target1: 480 Target 2 : 485 Stop loss : 128 Stop loss : 464 Market Lot : 7000 ,CMP : 129.20 Market Lot : 1500 ,CMP : 475.5 STOCK ANALYSIS OPEN INTEREST ACTIVITY LONG BUILD UP SHORT BUILD UP SYMBOL OI (LOTS) % CHNG PRICE %CHNG SYMBOL OI (LOTS) % CHNG PRICE %CHNG BPCL 11535.00 25.3 1110.00 1.60 NIITTECH 661.00 34.6 500.45 [5.0] HINDALCO 5411.00 18.3 128.75 3.50 AMARAJA- BAT 1555.00 24.7 837.55 [2.7] EXIDEIND 2302.00 17.7 176.45 3.20 TATASTEEL 13607.00 23.9 310.45 [5.2] ACC 2094.00 15.8 1616.50 1.10 TCS 14311.00 18.3 2438.00 [2.0] DRREDDY 9130.00 12.1 3547.00 2.80 APOLLOTYRE 3061.00 14.3 150.50 [4.0] OI addition : We saw long built up in bpcl, hindalco, exide ind, acc, drreddy while short built up was seen in niit tech, amaraja batt, tatasteel, tcs , apollotyre. OI Shedding : We saw short covering was seen in exide ind, hindalco, hdfc ,long unwinding was seen in cum- minsind, ibulhsgfin, bajajfinance.
- 3. DAILY DERIVATIVE REPORT 08 JULY 2016 YOUR MINTVISORY Call us at +91-731-6642300 Instrument Type Symbol Expiry Date Option Type Strike Price LTP Traded Volume (Contracts) Traded Value (Lakhs) OPTSTK ASHOKLEY 28JUL2016 CE 100 1.30 3,951 27,958.46 OPTSTK RELIANCE 28JUL2016 CE 1,000 18.90 3,890 19,866.23 OPTSTK ASHOKLEY 28JUL2016 CE 95 2.75 3,646 24,812.49 OPTSTK TATASTEEL 28JUL2016 CE 330 6.10 2,277 15,369.29 OPTSTK TATASTEEL 28JUL2016 CE 340 3.80 2,212 15,261.47 MOST ACTIVE CALLS MOST ACTIVE PUTS Instrument Type Symbol Expiry Date Option Type Strike Price LTP Traded Volume (Contracts) Traded Value (Lakhs) OPTSTK TATASTEEL 28JUL2016 PE 300 8.70 2,063 12,672.18 OPTSTK TATASTEEL 28JUL2016 PE 310 13.00 1,712 10,977.00 OPTSTK ASHOKLEY 28JUL2016 PE 90 2.20 1,427 9,283.78 OPTSTK SBIN 28JUL2016 PE 210 3.30 1,347 8,609.75 OPTSTK SBIN 28JUL2016 PE 220 7.30 1,326 9,011.36 FII ACTIVITY (IN RS. CRORE) BUY SELL OPEN INTEREST AT THE END OF THE DATE DERIVATIVE PRODUCT NO.OF CON- TRACTS AMOUNT IN CRORES NO.OF COTRACTS AMOUNT IN CRORES NO. OF CONTRACTS AMOUNT IN CRORES INDEX FUTURES 18311 1188.85 14249 934.54 221329 14117.61 INDEX OPTIONS 273556 17792.86 259518 16891.37 706172 44213.29 STOCK FUTURES 79733 5099.21 79656 5080.41 761764 47378.28 STOCK OPTIONS 27747 1789.94 25938 1675.13 18680 1175.98
- 4. DAILY DERIVATIVE REPORT 08 JULY 2016 YOUR MINTVISORY Call us at +91-731-6642300 DISCLAIMER The information and views in this report, our website & all the service we provide are believed to be reliable, but we do not accept any responsibility (or liability) for errors of fact or opinion. Users have the right to choose the product/s that suits them the most. Sincere efforts have been made to present the right investment perspective. The information contained herein is based on analysis and up on sources that we consider reliable. This material is for personal information and based upon it & takes no responsibility. The information given herein should be treated as only factor, while making investment decision. The report does not provide individually tailor-made investment advice. Epic research recommends that investors independently evaluate particular investments and strategies, and encourages investors to seek the advice of a financial adviser. Epic research shall not be responsible for any transaction conducted based on the information given in this report, which is in violation of rules and regulations of NSE and BSE. The share price projections shown are not necessarily indicative of future price performance. The information herein, together with all estimates and forecasts, can change without notice. Analyst or any person related to epic re- search might be holding positions in the stocks recommended. It is understood that anyone who is browsing through the site has done so at his free will and does not read any views expressed as a recommendation for which either the site or its owners or anyone can be held responsible for Any surfing and reading of the information is the acceptance of this disclaimer. All Rights Reserved. Investment in equity & bullion mar- ket has its own risks. We, however, do not vouch for the accuracy or the completeness thereof. We are not responsible for any loss incurred whatsoever for any financial profits or loss which may arise from the recommendations above epic research does not purport to be an invitation or an offer to buy or sell any financial instrument. Our Clients (Paid or Unpaid), any third party or anyone else have no rights to forward or share our calls or SMS or Report or Any Information Provided by us to/with anyone which is received directly or indirectly by them. If found so then Serious Legal Actions can be taken. PRICE VOLUME OI MARKET RISING UP UP STRONG RISING DOWN DOWN WEAK DECLINING UP UP WEAK DECLINING DOWN DOWN STRONG GENERAL RULES FOR OPEN INTEREST & VOLUME