1. Where's the Spam?
Elise Hinderliter, Amanda Procopio, and Robert McDonnell
Friday, April 24, 2015
Abstract:
The purpose of this project was to answer the following questions: which would is
most used in spam, what punctuation is most common in spam, is having strings of
numbers more common in spam or ham, and is a long capital letter run length associated
with spam? This data can be used to find trends that can be seen in spam in emails by
looking at the words, numbers, punctuation, and capital letters they contain.
Introduction:
This analysis examines the most efficient ways to filter spam from ham (non-spam)
in email accounts. We are trying to find the best indicators for spam in terms of what words
and symbols or combination thereof occur in the highest proportion in emails that are
spam.
In the spring of 1978, an energetic marketing man named Gary Thuerk wanted to let
people in the technology world know that his company, the Digital Equipment Corporation,
was about to introduce a powerful new computer system. DEC operated out of an old wool
mill in Maynard, Massachusetts, After selecting six hundred West Coast addresses, Thuerk
realized that he would never have time to call each one of them, or even to send out
hundreds of individual messages. So Gary Thuerk used the network to send out a one email
to all of them and became the father of spam. Thuerk was harshly reprimanded.
Nevertheless, his company sold more than twenty of the computer systems, for a million
dollars. This set the standard for creating spam as an annoying, but lucrative, pastime.
In the United States alone, more than ten billion dollars is spent each year trying to
contain spam. In 2001, spam accounted for about five per cent of the traffic on the Internet;
by 2004, that figure had risen to more than seventy per cent. This year, in some regions, it
has edged above ninety per cent. The flow of spam is often seasonal. It slows in the spring,
and then, in the month that technology specialists call “black September”—when hundreds
of thousands of students return to college, many armed with new computers and access to
fast Internet connections—the levels rise sharply.
In 2003, the federal government passed the Controlling the Assault of Non-Solicited
Pornography and Marketing Act, which is widely referred to as the CAN-SPAM Act. Proving
this is an ongoing battle that doesn’t look like it is going to be won anytime soon.
Our data is a population because it is all the emails from the George Foreman
Company in June to July in 1999. However, the data sample is not representative of all
2. email spam because George Foreman is only one company so you can not make
assumptions about the spam and ham from other emails outside of this company. This
subject is relevant to all people with email accounts and there are predicted to be 4.3
billion email accounts by year-end 2016.
Data:
This data comes from Hewlett-Packard Labs in Palo Alto, CA in 1999 who collected
and organized the data from the George Foreman Company’s emails. There are 58 variables
in the data set with 4601 individual observations (emails). 54 of the variables contain
percentages between 0 and 100 (instead of 0 to 1) 6 of which are specific number
sequences, and the last 48 are specific words (i.e. "you" or "make"). The data set also
contains 3 other numeric variables that are concerned with the length of unbroken strings
of capital letters. The last variable designates the e-mail as ham (0) or spam (1), where
spam could be unsolicited commercial emails among other types of unwanted messages.
Methods:
We selected several candidate variables and categories of variables to be examined
as to their relationship to an e-mail being ham or spam. We chose to examine the selected
numbers in the set ("000", "650", "857", "415", "85", "1999"), the maximum run length of
capital letters, punctuation usage (punctuation in general and also specifically exclamation
points and dollar signs), and lastly categories of words (office words, celebratory words,
and the most common word in the data set). We hypothesized that each of these variables
and categories would affect the designation of an e-mail. We perform hypothesis tests on
each using the two sided T-test, using the mean as the test statistic, to investigate the
variable's relationship to an e-mail's designation of spam or ham. Then we plotted a few
logistic regression lines to enable prediction of an e-mail's spam status.
Results:
Numbers
We hypothesized that the mean proportion of numbers in ham emails is different
than the mean proportion of numbers in spam, where the numbers examined are the
following:
• "000"
• "650"
• "857"
• "415"
• "85"
• "1999"
.723% μ .319%μham = 0 spam = 0
3. μHO : numbers = μnumbers
μ ≠μHA : spam ham
We found, with 95% confidence (p-value ), that the difference between.33= 7 * 10−25
the mean proportion of numbers in ham and the mean proportion of numbers in spam is
between 0.328% and 0.481%. We found that ham has a higher likelihood of a higher
proportion of numbers than spam.
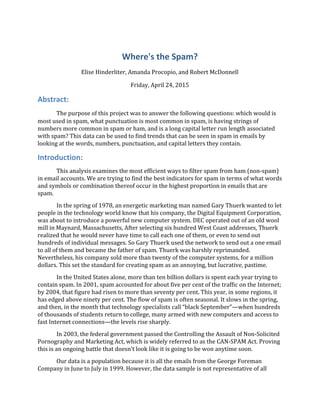
The plotted logistic regression line has the equation of the form:
pˆspam = e−0.312 (Numbers%)−0.287*
1+e−0.312 (Numbers%)−0.287*
Based on the regression line, we can conclude that there is a negative association
between the proportion of numbers in an e-mail and if the email is spam or ham. For every
1% increase in the proportion of numbers in an e-mail the odds increase by 0.732 as to
whether the e-mail is spam.
Maximum Run Length of Capital Letters
We hypothesized that the mean maximum run length of capital letters in ham emails
is different than the mean maximum run length of capital letters in spam.
8.2 μ 04μham = 1 spam = 1
μHO : numbers = μnumbers
μ ≠μHA : spam ham
4. We found, with 95% confidence (p-value ), that the difference between.96= 5 * 10−33
the mean maximum run length of capital letters in ham and the mean maximum run length
of capital letters in spam is between -100 and -72.3. We found that spam has a higher
likelihood of a higher proportion of runs of capital letters than ham.
We chose to remove the outlier at . 1, 9989 )(
The plotted logistic regression line, after removing the outlier, has the equation of the form:
5. pˆspam = e0.0252 (Maximum Run Length)−1.25*
1+e0.0252 (Maximum Run Length)−1.25*
Based on the regression line, we can conclude that there is a negative association
between the proportion of numbers in an e-mail and if the email is spam or ham. For every
1% increase in the proportion of numbers in an e-mail the odds increase by 1.03 as to
whether the e-mail is spam.
Punctuation
We hypothesized that the mean proportion of punctuation in ham emails is different
than the mean proportion of punctuation in spam, where the examined punctuation list is
the following:
• "Semicolon"
• "Open Parenthesis"
• "Open Square Brackets"
• "Exclamation Point"
• "Dollar Sign"
• "Hash Sign"
.375% μ .905%μham = 0 spam = 0
μHO : numbers = μnumbers
μ ≠μHA : spam ham
We found, with 95% confidence (p-value ), that the difference between.94= 5 * 10−57
the mean proportion of punctuation in ham and the mean proportion of punctuation in
spam is between -0.594% and -0.466%. We found that spam has a higher probability of
having a larger proportion of punctuation than ham.
Exclamation Points
We hypothesized that the mean proportion of exclamation points in ham emails is
different than the mean proportion of exclamation points in spam.
.11% μ .514%μham = 0 spam = 0
μHO : numbers = μnumbers
μ ≠μHA : spam ham
We found, with 95% confidence (p-value ), that the difference between.64= 1 * 10−64
the mean proportion of punctuation in ham and the mean proportion of punctuation in
spam is between -0.45% and -0.358%.. We found that ham has a higher likelihood of having
a higher proportion of exclamation points than spam.
6. Dollar Signs
We hypothesized that the mean proportion of dollar signs in ham emails is different
than the mean proportion of dollar signs in spam.
.0116% μ .174%μham = 0 spam = 0
μHO : numbers = μnumbers
μ ≠μHA : spam ham
We found, with 95% confidence (p-value ), that the difference between.27= 7 * 10−74
the mean proportion of dollar signs in ham and the mean proportion of dollar signs in spam
is between -0.18% and -0.146%. We found that ham has a higher likelihood of having a
higher proportion of dollar signs than spam.
Office Words
We hypothesized that the mean proportion of office words in ham emails, , isμham
different than the mean proportion of office words in spam, , where office words areμspam
the following:
• "report"
• "business"
• "meeting"
• "project"
• "conference"
.485% μ .382%μham = 0 spam = 0
μHO : spam = μham
μ ≠μHA : spam ham
We found, with 95% confidence (p-value ), that the difference between.44= 7 * 10−4
the mean proportion of office words in ham and the mean proportion of office words in
spam is between 0.0434% and 0.164%. We found that ham has a higher likelihood of
having a higher proportion of office words than spam.
Celebratory Words
We hypothesized that the mean proportion of celebratory words in ham emails,
, is different than the mean proportion of celebratory words in spam, , whereμham μspam
celebratory words are defined as:
• "free"
7. • "money"
• "receive"
• "you"
• "your"
.485% μ .382%μham = 0 spam = 0
μHO : spam = μham
μ ≠μHA : spam ham
We found, with 95% confidence (p-value ), that the difference between.44= 7 * 10−4
the mean proportion of celebratory words in ham and the mean proportion of celebratory
words in spam is between 0.0434% and 0.164%. We found that ham has a higher
likelihood of having a higher proportion of celebratory words than spam.
The Most Common Word
Going through the data set, we found the most common word to be the word "you".
We hypothesized that the mean proportion of the presence of the word "you" in ham
emails, , is different than the mean proportion of the presence of the word "you" inμham
spam, .μspam
.27% μ .26%μham = 1 spam = 2
μHO : spam = μham
μ ≠μHA : spam ham
We found, with 95% confidence (p-value ), that the difference between.41= 6 * 10−84
the proportion of the presence of the word "you" in ham and the proportion of the
presence of the word "you" in spam is between -1.09% and -0.896%. We found that spam
has a higher likelihood of a higher proportion of the word 'you' than in ham.
8. The plotted logistic regression line has the equation of the form:
pˆspam = e0.341 (you%)−1.01*
1+e0.341 (you%)−1.01*
Based on the regression line, we can conclude that there is a positive association
between the proportion of "you" in an e-mail and if the email is spam or ham. For every 1%
increase in the proportion of "you" in an e-mail the odds increase by 1.41 as to whether the
e-mail is spam.
Discussion:
Numbers
The first test we ran was looking at strings of numbers within the email. It was
found that the p-value was below .05 so we can reject the null hypothesis. The difference
between the means shows that there is a higher likelihood that a string of numbers would
have a higher proportion in ham than in spam.
Maximum Run Length of Capital Letters
In this analysis we compared the proportion of the mean maximum run length in
ham, (meaning the average number of the maximum number of capital letters) and
compared it to the mean maximum run length in spam. We found that the p-value was less
than .05 so the null hypothesis was rejected. This means that spam has a greater likelihood
of containing the maximum number of capital letters in a row in an email than ham.
Punctuation
The next variable that was analyzed was all punctuation within an email and we
found that the p-value was less than .05 so the null hypothesis was rejected. The difference
9. between the means shows that spam has a higher likelihood of having a larger proportion
of punctuation than ham. After finding this we looked at both exclamation points and dollar
signs on their own within spam and ham emails and found that both p-values were below
.05 which means we can reject the null hypotheses.
Unlike comparing the proportion of all punctuation in an email the difference
between the means shows that both exclamation points and dollar signs have a higher
probability of being within spam rather than ham.
Exclamation Points
Exclamation points were analyzed by comparing the proportion of exclamation
points found in spam against the proportion of exclamation points found in ham. It was
found that the p-value was less than .05 so the null hypothesis was rejected. The difference
between the means shows that ham has a higher proportion of exclamation points then
spam.
Dollar Signs
Dollar signs were analyzed by comparing the proportion of exclamation points
found in spam against the proportion of exclamation points found in ham. It was found that
the p-value was less than .05 so the null hypothesis was rejected. The difference between
the means shows that ham has a higher proportion of dollar signs then spam.
Office Words
Next, a hypothesis test was done on a new variable “office words”. The variable
“office words” is comprised of the words "report", "business", "meeting", "project" and
"conference". It was found that the p-value was less than .05 so the null hypothesis was
rejected. Ham has a higher proportion of “office words” than spam.
Celebratory Words
A hypothesis test was then done on a variable containing “celebratory words”.
Which was made up of the words; "free", "money", "receive", "you", and "your". The p-value
was found to be less than .05 so the we can reject the null hypothesis. The difference
between the means shows that ham has a higher likelihood of having a higher proportion
than spam.
The Most Common Word
One of the things that we predicted was that “you” would be the most recurring
word in spam, which was correct. With a p-value less than .05 we can reject the hypothesis.
Although the difference between the means shows that there is a higher likelihood of a
higher proportion of the use of the word “you” in spam than in ham.
The Big Picture
One problem we encountered was that the data percentages for each subset
(exclamation points, maximum number of capital letters in a row, etc.) were very small.
10. Also, there are about 4.3 billion email accounts and about 100 billion emails sent a day.
Though our data set was very large, 4601 emails collected over two months, it is not a
representative sample of the world population of emails sent and received, even on a daily
basis. Also, because our data was from only one company, George Foreman, that
volunteered the information which leads to bias in the sample.
A few questions that were raised was how to make a spam filter measure spam
indicators such as white space or animated words or images? These are also variables that
have been useful to obtain. Also, a more robust analysis on this data could have been made
if an update of the data after a couple of years was provided so Bayesian statistics to could
be utilized to analyze and revise the spam filter.
Spam is always evolving and filters need to be more and more complex in order to
differentiate them from ham. For example, there are 600,426,974,379,824,381,952 ways to
spell Viagra. This raised the question of whether spam filters, searching for specific
combinations of letters, numbers, and symbols, would be robust enough to account for all
the variations of spam words.
Conclusion:
In conclusion, in the different groupings of words, punctuation, capital letters, and
numbers we tested we found that all the tests were significant. But, many words or
symbols that would be associated with spam are predictable although there are a few
capricious words (like “you”) would be expected classified as ham or spam and are not
associated with the category that would initially seem the most obvious. Furthermore,
when some variables are grouped (office and celebratory words) or when some variable
combinations are divided (such as punctuation) various subgroups are not designated in
the same category of ham or spam as the initial variable grouping. This nature of
unpredictability in tracing spam indicators as well as the vast amount of variation in any
given spam variable illustrates the complex undertaking of creating a spam filter does not
quickly become obsolete as we have only begun to analyse this in our paper.
Works Cited:
Levenstein, Justine. "Update on Organized Sections." Ed. Sara Radicat. PS: Political
Science and Politics 33.4 (2000): 956-67. Email Statistics Report , 20 13 - 201 7. The Radicati
Group Inc. Web.
Specter, Michael. "Damn Spam - The New Yorker." The New Yorker. The New Yorker,
n.d. Web. 22 Apr. 2015.
Hoang, Quoc. "Email Statistics Report , 20 12 - 201 6." Ed. Sara Radicat. The Radicati
Group Inc., n.d. Web. 22 Apr. 2015.