SlideShare a Scribd company logo
1 of 13
Download to read offline
Article
2
A Bayesian alternative to null hypothesis
significance testing
John Eidswick
johneidswick@hotmail.com
Konan University
Abstract
Researchers in second language (L2) learning typically regard “statistical significance” as a
benchmark of success for an experiment. However, because this statistic indicates nothing more
than the probability of data sets occurring given the essentially impossible condition that the null
hypothesis is true, it confers little of practical or theoretical importance. Significance is also the
source of widespread misinterpretation, including confusion of significance with effect size.
Critics of NHST assert that alternative approaches based on Bayes’ theorem are more appropriate
for hypothesis testing. This paper provides a non-technical introduction to essential concepts
underlying Bayesian statistical inference, including prior probabilities and Bayes factors.
Common criticisms of NHST are outlined and possible benefits of Bayesian approaches over
NHST are discussed.
Introduction
In this article, I provide an overview of Bayesian statistics and contrast it with null hypothesis
significance testing (NHST). I also describe criticisms often expressed about NHST (e.g. in
Cohen, 1994) and reasons that Bayesian statistics might be a suitable alternative for analyses in
second language (L2) learning research. I will also outline concepts important to Bayesian
approaches, such as prior probability distributions and Bayes factors.
Perhaps the best way to introduce Bayesian statistics is by way of an example. Research has
demonstrated that the motivational variable interest has a powerful effect on processes important
to reading comprehension (see Hidi & Renninger, 2006, for a review). A researcher wants to learn
whether interest influences comprehension in L2 reading in a comparable way as occurs in first
language (L1) contexts, so she has a group of 25 students read an interesting and a boring story
and take comprehension tests. She checks for differences between the test scores by using a t test.
Researchers use t tests to compare two groups of data produced under different conditions to
determine the probability that no difference exists between them beyond random variation. The
hypothesis that no difference exists is called the null hypothesis (H0). Data from a t test consists
of an independent variable (IV) that is manipulated and a dependent variable (DV) that might be
affected by the IV.
The probability (the p value) that a t statistic of the size produced by the test would occur given
that H0 is correct is calculated. A p value of less than .05 would mean that if we were to repeat
this test 100 times, a statistic of this size or higher would result by random chance fewer than five
times (see Figure 1). In this case the results are considered “significant” and the researcher rejects
the null hypothesis.
Eidswick 3
Shiken Research Bulletin 16(1). May 2012.
Figure 1. Idealized distribution of scores with threshold p=.05 marked. If the t statistic falls
to the right of this line, the mean difference between H0 and H1 is considered statistically
significant.
Note that space constraints do not permit detailed discussion in this article of one- and two-tailed
tests, t distributions, degrees of freedom, confidence intervals, effect sizes, or statistical power,
but these are also important aspects of NHST. Readers unfamiliar with these concepts are
encouraged to read explanations that can be found in many introductory statistics textbooks (e.g.
Field, 2009).
Our researcher performs a t test on the data (in reality, the data was produced using a random
number generator for normal distributions at Wessa, 2008). Table 1 shows the descriptive
statistics and the results are provided in Table 2.
Table 1. Descriptive Statistics for Boring and Interesting Text Conditions
Text Group N M SD SE
Boring 25 10.24 2.13 .43
Interesting 25 10.92 3.76 .75
Table 2. T Test Results for Boring and Interesting Text Conditions
Df SED MD T p (one-tailed)
24 .489 .68 1.69 .098
Note: p<.05.
As can be seen, the results are insignificant at p<.05, because .098 is larger than .05. The
researcher therefore is inclined not to reject the null hypothesis. A colleague of our researcher, on
a lark, does the same experiment with a very similar group of students and adds the scores to the
original data. The t test is performed again, now with an N size of 50. The new descriptive
statistics and t test results are provided in Tables 3 and 4.
Table 3. Descriptive Statistics for Boring and Interesting Text Conditions
-4 -3 -2 -1 0 1 2 3 4
Region to the
right of this line is
p<.05.
4 A Bayesian alternative to null hypothesis testing
Shiken Research Bulletin 16(1). May 2012.
Text Group N M SD SE
Boring 50 10.24 2.10 .30
Interesting 50 10.92 3.72 .53
Table 4. T Test Results for Boring and Interesting Text Conditions
Df SED MD T p (one-tailed)
49 .342 .68 1.99 .026*
Note. *p<.05.
As we can see, the descriptives have changed little, but the results of the t test are now significant.
By convention, these results are now considered publishable, despite the fact that for all practical
purposes they are identical to those of the previous experiment. This poses a serious dilemma for
our researchers. Should they reject or not reject the null hypothesis? In order to get published,
should they favor the second results and pretend those of the original study did not occur? The
source of the dilemma lies in the fact that finding significance is reliant on statistical power,
which is related to sample size. Such is the relationship between N size and significance that in
the case of a large enough number of cases, finding significance is all but certain, irrespective of
an actual experimental effect. This is one of several problems described by critics of NHST.
Criticism of null hypothesis significance testing
Criticism of NHST can be divided into two categories: 1) weaknesses of NHST as an evaluative
tool, and 2) misinterpretations of what NHST results mean.
Weaknesses
Problematic qualities of NHST cited by critics include:
• The primacy of significance. Editors of L2 learning academic journals tend to view
significance as the mark of success, but using the p value as a Litmus test for “success” is
problematic. As noted, variations of sample size can change the likelihood of finding
significance, a characteristic that leads some statisticians to argue that NHST p values do
not qualify as measures of statistical evidence, much less success, because identical p
values do not convey identical levels of evidence when sample sizes differ (Wagenmakers,
2007).
• The primacy of significance thresholds. R.A. Fisher, whose work underpinned the
development of the p value, did not himself regard p values as rigid cut-off points (Salsburg,
2001). In fact, Fisher’s selection of these benchmarks was at least somewhat arbitrary; he
identified p value thresholds in his book Statistical Methods for Research Workers (1925)
by providing critical values tables, which were limited to .05, .02, and .01, to “save space”
(Field, 2009, p. 51). As Abelson (1997) commented, “Literal insistence on the .05 level is
as silly as would be other arbitrarily rigid quality standards for research results, like 30%
generality, or more interestingness than three quarters of the existing literature” (p. 14).
• Power issues. Statistical power refers to the probability that a test can detect an effect.
Adjustments made in analyses to reduce the chances of incorrectly rejecting H0 (Type I
errors) or incorrectly failing to reject H0 (Type II errors), inevitable in a range of
NHST-based tests, involve a loss of statistical power.
Eidswick 5
Shiken Research Bulletin 16(1). May 2012.
Misconceptions
Misconceptions persist regarding what NHST in fact measures and what its results mean. Some
are outlined below.
• The meaning of significance. It is tempting to conclude that statistical significance
indicates that the null hypothesis is false and the alternate hypothesis is true, but this is not
correct. The finding of significance really means nothing more than the researcher is
inclined to reject the null hypothesis based on a low probability (defined by a somewhat
arbitrarily chosen threshold) that the data at hand would occur randomly in many
recursions of it. Significance does not mean the null hypothesis is formally invalid.
Rejecting H0 does not prove H1, but instead merely offers an indirect and rather flimsy
indicator of support for it.
• The meaning of lack of significance. Because NHST purports to test the hypothesis that the
null hypothesis is true, one might well be inclined to infer that an “insignificant” finding
means just that: the null hypothesis is true. In fact, situations where mean differences are
literally zero virtually never occur in the real world.
• Substitution of a conditional probability for its inverse. The notion that the probability of
certain data given that H0 is true, that is, P(D|H0), is equivalent to the probability that H0 is
true given certain data, or P(H0|D), is intuitively appealing, but the difference between
these two becomes clear when contemplating the probability of having a runny nose given
the condition of having the flu versus having the flu given the condition of having a runny
nose; one can have a runny nose for many reasons besides the flu.
• The idea that “significance” means “importance”. Significance does not refer to the
magnitude of an experimental effect. Reporting effect sizes in published studies would help
clarify this misunderstanding, but few L2 researchers do so.
While the issues outlined above might create obstacles to rigorous hypothesis construction and
testing, critics of NHST assert that a solution to many of these problems lies in Bayesian
statistics.
Bayesian statistics
Bayesian statistical approaches are drawn from the work of 18th century mathematician Thomas
Bayes. Bayesian and classical statistical approaches differ crucially in two areas. The first relates
to how analyses are interpreted. Frequentist approaches like NHST produce p values that estimate
the likelihood that the data would occur given that the null hypothesis is true. Rather than stating
a “cut point” after which one hypothesis is chosen over another, Bayesian analyses result in
probability values that are used to compare the relative support for one hypothesis over another.
In short, frequentists seek significance and Bayesians seek probability support for a hypothesis.
The second area where the two kinds of approaches differ is the formal use of prior information.
Frequentists ignore what was previously known about the experimental condition when
conducting a new experiment, but incorporating this prior information into future analyses is an
essential part of Bayesian approaches. Prior information is incorporated by using the feature
which most distinguishes Bayesian statistics, the prior probability.
Thomas Bayes’s solution to a problem of “inverse probability” (e.g., estimating the unknown
likelihood of an event happening given the known likelihood of a certain condition) contained a
description of the formula which has come to be known as Bayes’ theorem. As noted, a
6 A Bayesian alternative to null hypothesis testing
Shiken Research Bulletin 16(1). May 2012.
distinctive feature of the formula is the prior probability (the prior). In a basic application of
Bayes’ formula, the multiplied product of the prior and the probability of data given a certain
parameter is divided by the probability of the parameter defining the sample space to produce a
posterior probability (the posterior):
! ! ! = ! ! ! !(!)
!(!)
where A is the parameter under investigation and B is the data.
Let us make our introduction to Bayes less abstract with a simple example (adapted from Bonilla,
2011; for another non-technical example of Bayes’ formula, see Yudkowsky, 2003). The data
used in the first t test could be categorized as individuals who passed and failed the
comprehension test. If we consider test scores of 12 (60%) or higher as “pass” and those below as
“fail,” then 6 of 25 students (24%) passed the test in the boring text condition, and 15 of 25
students (60%) passed in the interesting text condition. To understand how Bayes’ formula works,
it is useful to concentrate on how the Interest condition relates to the Pass scores (see Figure 2).
Figure 2. Interesting and boring text conditions divided into passed (shaded areas) and
failed (unshaded areas) results on comprehension tests.
The rectangle on the left indicates the Interesting condition, the rectangle on the right the boring
condition, The shaded areas indicate the proportions of students in each condition that passed the
test. The shaded rectangle to the left of the center dividing line represents the intersect of students
who found the text interesting and passed the test; it is denoted as Int " Pass, which can be read
as “Int and Pass happen together”. Likewise, the shaded portion of the “Boring” condition
indicates the intersect of students who found the text boring with those who passed the test (Bor
" Pass).
What is the probability that a student passed the test if he read the interesting text? In conditional
probability notation, this is signified by P(Pass | Int), which is read, “the probability of the event
of a student’s passing given the event that the student read the interesting text”. We can think of
this as the answer to the question, “how much of the Interesting rectangle is accounted for by the
shaded Passed area?” The answer is already given as 60%.
This is not what the researcher really wants to know, however. The researcher is interested not in
the probability of passing given that the text is interesting, but in the probability of the text being
interesting given that the student passed. This is represented by P(Int | Pass), which means, “the
probability the text was interesting given that the test was passed”. We can easily calculate this
information from Bayes’ formula as follows:
! !"# !"## =
! !"## !"# !(!"#)
!(!"##)
Eidswick 7
Shiken Research Bulletin 16(1). May 2012.
The values in the numerator are already known—the probability a student passed given that he
thought the text was interesting is 0.60:
! !"## !"# = .60
and the probability that the student found the text interesting is 0.50, as half the scores came from
the interesting condition:
!(!"#) = .50
The shaded Pass area has two parts: (A) the section contributed by the Int condition, and (B) the
section contributed by the non-Int (boring) condition. To calculate !(!"##), these two parts are
added.
In calculating (A), we are asking,!how much of the Pass area is made up of passing scores in the
context of the Interest rectangle? The probability of a passing score within the Interest rectangle,
P(Pass | Int), is .60. To find out how much of this probability contributes to the Pass area, we
simply multiply it by P(Int), which is the probability of the student finding the text interesting, or
50%:
.60 × .50 = .30.
Likewise, in calculating (B), we are asking “how much of the Pass area is comprised of passing
scores in the context of the Boring condition?” Mathematically, this is P(Pass | B) × P(B). We
know that 24% of the students who read the boring text passed the test and that 50% of the scores
came from this condition. Therefore, (B) is calculated:
.24 × .50 = .12.
The denominator in Bayes formula, !(!"##), then, is:
.30 + .12 = .42.
Plugging our values into Bayes’ formula, we obtain:
! !"! !"## =
.!"
.!"
= .71
Therefore, if we randomly draw a student with a passing test score from this group, there is a 71%
chance that he read the interesting text. If we were to calculate P(B | Pass) using Bayes formula,
we would obtain the remaining percentage of this region, that is, 29%. Of course, since
probability of a given space must add up to 1, we could also simply subtract .71 from 1 to
derive .29. We can now add these probabilities to the previous diagram:
8 A Bayesian alternative to null hypothesis testing
Shiken Research Bulletin 16(1). May 2012.
Figure 3. Bayes formula provides probabilities of passing conditions.
Although in this simple example the difference between pass and fail percentages is stark;
however, it should be noted that the results are not always so obvious. If far more students found
the texts boring than interesting, it is possible that a student that passed will still have a higher
likelihood of having thought his book was boring, even if a much higher proportion of students
who thought the texts were interesting passed. Bayes’ rule adjusts for differences in sample sizes
between conditions when calculating these probabilities.
Prior probabilities
The simple example above might be useful for illustrating the basic dimensions of Bayes theorem,
but it elides over some important points, chiefly to do with the assignment of the prior probability.
Unlike classical statistics, Bayesian approaches enable researchers to include relevant prior
information in formal experimentation. If previous research indicates one outcome is more likely
than another, a Bayesian can integrate this information into his hypothesis formation and testing
(Figure 3). The revised probability resulting from the new experiment can then influence the
selection of priors used in subsequent investigations to further refine probability estimations in
support of one hypothesis or other. The prior probability is a summary of a researcher’s belief
about the outcome of a given experiment.
In the example above, for simplicity, the prior,!!(!), was given as a known value and as a simple
mean, but in a normal Bayesian analysis, the prior would be designated based on personal belief
of the researcher. This personal belief could be drawn from previous research, or even just the
researcher’s conjecture. Since Bayesians, unlike frequentists, regard unknown values under
investigation as random variables (that is, variables that manifest as values with certain
probabilities), the conjectured outcomes for these values, expressed by the prior, take the form of
probability distributions, indicated concretely by parameters like mean, standard deviation, and
range. If prior information is lacking, the researcher can use a prior that expresses a high degree
of uncertainty. High uncertainty can be related by designating a prior with a large standard
deviation and by maximizing the range (Klugkist & Mulder, 2008). When probability
distributions are used in Bayesian procedures, the calculations become much more complicated
than those of our example. They are accomplished using calculus and sophisticated algorithms
(such as Markov Chain Monte Carlo) that require a computer to generate. The good news is that
software for using these procedures is available.
10 15 6 19
Interesting
(n = 25)
Boring
(n = 25)
Passed
(n = 21)
P(Pass | Interesting) = 71% P(Pass | Boring) = 29%
Eidswick 9
Shiken Research Bulletin 16(1). May 2012.
Figure 4. Bayesian approaches combine prior information, in the form of a prior probability,
to produce an updated view of phenomena, in the form of a posterior probability (adapted
from Stevens, 2009).
Why use a prior?
To understand why Bayesians incorporate prior information into statistical inference, it is helpful
to understand the quite different perceptions frequentists and Bayesians have of probability and
the different goals the two kinds of researchers have in hypothesis testing. For frequentists,
probability is the likelihood that a certain unknown (and ultimately unknowable) value lies within
a distribution of values drawn from many samplings of a population, with the goal of analyses
being to estimate whether sampled data would occur less than five percent of the time (p < 0.05)
given the null hypothesis is true. For Bayesians, probability is conceived as a degree of personal
belief which can be refined by confrontation with real-world evidence. In Bayesian statistics, the
goal is to modify a given state of knowledge about a phenomenon by connecting it to data; to do
so without concretely representing the state of knowledge would be impossible. This existing
state of knowledge is represented using the prior. Moreover, because the prior summarizes
researcher belief about experimental outcomes, it can also be considered an expression of a
hypothesis, a prediction subject to modification given new information collected during the new
experiment.
To make this clearer, let’s look at another example. Our first researcher, devastated by her t test
debacle, throws away her data. A second researcher, a Bayesian, discovers her data while rooting
through the trash bin. He decides to analyze it using a Bayesian approach.
Our Bayesian researcher considers some choices for a prior. In the absence of much prior
information or a defined hypothesis, he might choose a prior that indicates only that a range exists
in scores, from 0 to 20, with each score having equal probability of occurring. The X-axis of the
uniform prior (Figure 4) shows the range of comprehension test scores from zero to 20, and the
Y-axis shows the probability of those scores according to the prior. This kind of uniform,
approximately objective, prior conveys much uncertainty and provides little information, so the
data will dominate the calculation of the posterior probability.
10 A Bayesian alternative to null hypothesis testing
Shiken Research Bulletin 16(1). May 2012.
Figure 4. Uniform prior where each score on the comprehension test has an equal
probability of occurring. While this prior would be approximately objective, it would also
likely be an unrealistic representation of the data.
Our researcher might view a uniform prior as unrealistic, since data are unlikely to be flatly
distributed. Also, while the results of the scavenged t tests were contradictory in terms of
significance, they do suggest a modest degree of variance attributable to the interesting text
condition. Our researcher gleans further in a literature review that related (fictional) studies
indicate that interest contributes about 5% to increases in text comprehension. He could assign a
prior with a mean score 5% higher than would occur by chance (i.e. one point higher than a mean
of 10) with a standard deviation of 5. The standard deviation for a normal distribution can be
estimated by dividing the highest extreme of the range of scores, in this case 20, by four. Figure 5
shows the distribution of this subjective prior.
The X-axis shows the range of comprehension scores, and the Y-axis shows the probability of the
scores occurring. For example, a score of 11 (the mean) would have a probability of
approximately .16 or 16% of occurring whereas a score of 5 would have about .01 or 1% chance
of occurring. Using this subjective prior would involve the meeting of the hypothesized outcome
represented by the prior (interest influences comprehension positively by a predicted amount,
with a predicted degree of dispersion) with the data. The probabilities predicted by this prior
would be somewhat higher than those predicted to occur by chance, so while this prior is
subjective, it is also quite conservative.
Our Bayesian decides to use the more informative prior to test his hypothesis. To aid in the
calculations, and to compare the relative support of his hypothesis with that of the null, he uses a
Bayes factor.
0.1
0.2
0.3
0.4
0.5
0.6
0.7
0.8
0.9
1
0 5 10 15 20
Probability
of
score
occurring
Possible comprehension test scores
Eidswick 11
Shiken Research Bulletin 16(1). May 2012.
Figure 5. Prior with a normal distribution and a mean of 11. This somewhat subjective prior
would reflect a hypothesized distribution based on previous research.
Bayes factors
In a Bayesian version of a t test, the probability of H0 and its alternative are compared to produce
a statistic called a Bayes factor (BF). Put simply, the BF is a ratio that compares the likelihood of
one model over another, thereby showing the relative support for the researcher’s hypothesis
versus another hypothesis (which may or may not be the null).
Interpretation of the BF is straightforward. For example, a BF of 4 for H1 versus H0 indicates
support for H1 is 4 times that of H0. A BF of .5 provides two times the support for H0 than for H1
(Klugkist, 2008). Bayes factors between .3 and 3 do not provide much evidence to differentiate
the two hypotheses (Jeffreys, 1939, 1998).
In order to run the necessary calculations, the researcher uses an online Bayes factor calculator,
provided at the following link (Dienes, 2008):
http://www.lifesci.sussex.ac.uk/home/Zoltan_Dienes/inference/bayes_factor.swf
The calculator provides a limited range of priors templates for calculating a simple BF for a
Bayesian “t test” that shows the relative support for the null hypothesis, as manifested by a
population value with a mean of 0, and a hypothesis, as expressed by the mean differences and
distributions assigned by the researcher (For supporting explanation, see Dienes, 2011).
Some simple modifications to our researcher’s data are required to use the calculator. Our
researcher chooses a normal distribution option and enters a mean difference of 5% with a range
of 1% to 10% and a standard deviation of 2.5. With the t test data (N=50), the BF produced is .45.
This indicates slightly more support for the null versus the interest hypothesis. This contrasts with
the finding of statistical significance in the second t test, and that our researcher’s interpretation of
the BF involves neither rejecting nor failing to reject the null, but instead making inferences based
on the comparative likelihoods of H0 and H1.
0
0.02
0.04
0.06
0.08
0.1
0.12
0.14
0.16
0.18
0 5 10 15 20
Possible comprehension test scores
Probability
of
score
occurring
12 A Bayesian alternative to null hypothesis testing
Shiken Research Bulletin 16(1). May 2012.
Given this result, the researcher would be inclined to align his confidence somewhat away from
the findings of other research in L1-based contexts. He might give careful consideration to the
special characteristics of L2 readers and design future studies to explore in a more nuanced way
potential effects of interest on reading comprehension. In the service of using accumulated
experiences to update and refine knowledge, the results of a Bayesian analysis are used to
contribute to new hypotheses and to shape the priors assigned in future studies. Note that this kind
of statistical reasoning is essentially different from that of many researchers interpreting the
results of a NHST. In the case of the example t tests, our first researcher either rejects the null
hypothesis (with the higher N size) or does not reject the null hypothesis (with the lower N size),
and then draws only peripherally related conclusions.
Bayesian benefits
Several qualities of Bayesian statistics might render them useful in L2 learning research,
including:
• Flexibility. Bayesian approaches permit direct comparisons between multiple hypotheses
by incorporating inequality constraints; null hypothesis-based comparisons of multiple
hypotheses require secondary procedures, such as post hoc tests, which can result in
reduced statistical power and can yield mutually inconsistent results.
• Protection against fallacious “significance”. Power and N sizes are not irrelevant to
Bayesian approaches, but, unlike NHST, high numbers of cases do not inevitably result in
something akin to “significance.” Instead, in a Bayesian t test where the null is
approximately correct, higher N sizes drive the BF toward zero (Dienes, 2011).
• Validity: Bayesian methods directly address questions researchers are trying to answer.
Unlike frequentists, who test “’nothing is going on’ versus ‘something is going on but I
don’t know what’” (Boelen & Hoijtink, 2008, p. 10), Bayesians ask, “what is the chance
my hypothesis is true given the evidence?”
• Possible: A variety of Bayesian software packages are available, some reasonably
user-friendly. For example, the Bayesian Inequality and Equality Model Selection (BIEMS)
program (Mulder, Hoijtink, & de Leeuw, 2012; Mulder, Hoijtink, & Klugkist, 2010;
Mulder, Klugkist, van de Schoot, Meeus, Selfhout, & Hoijtink, 2009) is available for free
and has a Windows user interface. For a thoroughgoing description of available software
packages for Bayesian approaches, see Hoijtink, (2012).
• Objective: Perhaps the most pervasive criticism of Bayesian approaches relates to the prior,
which entails, it is believed, a subjective and therefore biased decision by the researcher.
However, vague or uninformative priors can be assigned which are approximately
objective.
Conclusion
Researchers in L2 learning use NHST almost exclusively. However, many researchers are
unfamiliar with the limitations of NHST and unaware that alternative procedures, such as those
related to Bayes’ theorem, exist. Despite the growing wealth of explanatory materials and
availability of software by which even non-statisticians can avail themselves to Bayesian
statistical methods, to date, no researcher to my knowledge has attempted to use these potentially
advantageous procedures in research focused on L2 learning.
Eidswick 13
Shiken Research Bulletin 16(1). May 2012.
References
Abelson, R. P. (1997). On the surprising longevity of flogged horses: Why there is a case for the
significance test. Psychological Science, 8, 12-15.
Boelen, P. A., & Hoijtink, H. (2008). Illustrative psychological data and hypotheses for Bayesian
inequality constrained analysis of variance. In H. Hoijtink, I. Klugkist, & P. A. Boelen (Eds.),
Bayesian evaluation of informative hypotheses (pp.7-26). New York: Springer.
Bonilla, O. (2011). Visualizing Bayes’ theorem. Math115.com. Retrieved from
http://math115.com/2011/02/visualizing-bayes%e2%80%99-theorem/
Cohen J. (1994) The earth is round (p < 0.05). American Psychologist, 49(12), 997–1003.
Dienes, Z. (2008). Understanding psychology as a science: An introduction to scientific and
statistical inference [Supplemental material]. Hampshire, England: Palgrave Macmillan.
Retrieved from http://www.lifesci.sussex.ac.uk/home/Zoltan_Dienes/inference/
Dienes, Z. (2011). Bayesian Versus Orthodox Statistics: Which Side Are You On? Perspectives
on Psychological Science 6(3) 274–290 DOI: 10.1177/1745691611406920
Field, A. (2009). Discovering statistics using SPSS. London: Sage.
Fisher, R. A. (1925). Statistical methods for research workers. Edinburgh: Oliver and Boyd.
Hidi, S. & Renninger, K. A. (2006). The four-phase model of interest development. Educational
Psychologist, 41, 111-127.
Hoijtink, H. (2012). Informative hypotheses: Theory and practice for behavioral and social
scientists. London: CRC Press.
Kass, R. E., & Raftery, A. E. (1995). Bayes factors. Journal of the American Statistical
Association, 90, 773-795.
Klugkist, I. & Mulder, J. (2008). Bayesian estimation for inequality constrained analysis of
variance. In H. Hoijtink, I. Klugkist, & P. A. Boelen (Eds.), Bayesian evaluation of informative
hypotheses (pp. 27-52). New York: Springer.
Jeffreys, H. (1939, 1998). Theory of probability. 3rd Ed. Oxford: Oxford University Press.
Klugvist, I. (2008). Encompassing prior based model selection for inequality constrained
analysis of variance. In H. Hoijtink, I. Klugkist, & P. A. Boelen (Eds.), Bayesian evaluation
of informative hypotheses (pp.53-83). New York: Springer.
Mulder, J., Hoijtink, H. & de Leeuw, C. (2012). BIEMS: A Fortran90 program for calculating
Bayes factors for inequality and equality constrained models. Journal of Statistical Software,
46(2), 1-39.
Mulder, J., Hoijtink, H., & Klugkist, I. (2010). Equality and inequality constrained multivariate
linear models: Objective model selection using constrained posterior priors. Journal of
Statistical Planning and Inference, 140, 887-906.
Mulder, J. Klugkist, I., van de Schoot, R., Meeus, W., Selfhout, M., and Hoijtink, H. (2009).
Bayesian model selection of informative hypotheses for repeated measurements. Journal of
Mathematical Psychology, 53, 530-546.
14 A Bayesian alternative to null hypothesis testing
Shiken Research Bulletin 16(1). May 2012.
Stevens, J. W. (2009). What is Bayesian statistics? Retrieved from
http://www.medicine.ox.ac.uk/bandolier/painres/download/whatis/What_is_Bay_stats.pdf
Wagenmakers, E. (2007). A practical solution to the pervasive problems of p values.
Psychonomic Bulletin & Review, 14(5), 779-804.
Wessa, P. (2008). Random number generator for the normal distribution (v1.0.8). Free Statistics
Software (v1.1.23-r7), Office for Research Development and Education. Retrieved from
http://www.wessa.net/rwasp_rngnorm.wasp/
Yudkowsky, E. S. (2003). An intuitive explanation of Bayes’ theorem. Retrieved from
http://yudkowsky.net/rational/bayes

More Related Content

Similar to A Bayesian Alternative To Null Hypothesis Significance Testing

Mayo minnesota 28 march 2 (1)
Mayo minnesota 28 march 2 (1)Mayo minnesota 28 march 2 (1)
Mayo minnesota 28 march 2 (1)jemille6
 
Reviewing quantitative articles_and_checklist
Reviewing quantitative articles_and_checklistReviewing quantitative articles_and_checklist
Reviewing quantitative articles_and_checklistLasse Torkkeli
 
Replication Crises and the Statistics Wars: Hidden Controversies
Replication Crises and the Statistics Wars: Hidden ControversiesReplication Crises and the Statistics Wars: Hidden Controversies
Replication Crises and the Statistics Wars: Hidden Controversiesjemille6
 
Common Statistical Concerns in Clinical Trials
Common Statistical Concerns in Clinical TrialsCommon Statistical Concerns in Clinical Trials
Common Statistical Concerns in Clinical TrialsClin Plus
 
Power, Effect Sizes, Confidence Intervals, & Academic Integrity
Power, Effect Sizes, Confidence Intervals, & Academic IntegrityPower, Effect Sizes, Confidence Intervals, & Academic Integrity
Power, Effect Sizes, Confidence Intervals, & Academic IntegrityJames Neill
 
MethodUnderstandingStatisticalSignificanceMatthew .docx
MethodUnderstandingStatisticalSignificanceMatthew .docxMethodUnderstandingStatisticalSignificanceMatthew .docx
MethodUnderstandingStatisticalSignificanceMatthew .docxARIV4
 
Assessment 3 ContextYou will review the theory, logic, and a.docx
Assessment 3 ContextYou will review the theory, logic, and a.docxAssessment 3 ContextYou will review the theory, logic, and a.docx
Assessment 3 ContextYou will review the theory, logic, and a.docxgalerussel59292
 
Meta analysis with R
Meta analysis with RMeta analysis with R
Meta analysis with RAlberto Labarga
 
Hypothesis testing pdf bhavana.pdf
Hypothesis testing pdf bhavana.pdfHypothesis testing pdf bhavana.pdf
Hypothesis testing pdf bhavana.pdfSimhadri Bhavana
 
hypothesis testing overview
hypothesis testing overviewhypothesis testing overview
hypothesis testing overviewi i
 
Choosing statistical tests
Choosing statistical testsChoosing statistical tests
Choosing statistical testsAkiode Noah
 
TEST of hypothesis
TEST of hypothesisTEST of hypothesis
TEST of hypothesisKrushal Kakadia
 
An Alternative To Null-Hypothesis Significance Tests
An Alternative To Null-Hypothesis Significance TestsAn Alternative To Null-Hypothesis Significance Tests
An Alternative To Null-Hypothesis Significance TestsSarah Morrow
 
P-Value: a true test of significance in agricultural research
P-Value: a true test of significance in agricultural researchP-Value: a true test of significance in agricultural research
P-Value: a true test of significance in agricultural researchJiban Shrestha
 
Hypothesis testing
Hypothesis testingHypothesis testing
Hypothesis testingRashmi Vaishya
 
P-Value "Reforms": Fixing Science or Threat to Replication and Falsification
P-Value "Reforms": Fixing Science or Threat to Replication and FalsificationP-Value "Reforms": Fixing Science or Threat to Replication and Falsification
P-Value "Reforms": Fixing Science or Threat to Replication and Falsificationjemille6
 
importance of P value and its uses in the realtime Significance
importance of P value and its uses in the realtime Significanceimportance of P value and its uses in the realtime Significance
importance of P value and its uses in the realtime SignificanceSukumarReddy43
 
Statistical Significance Tests.pptx
Statistical Significance Tests.pptxStatistical Significance Tests.pptx
Statistical Significance Tests.pptxAldofChrist
 

Similar to A Bayesian Alternative To Null Hypothesis Significance Testing (20)

Mayo minnesota 28 march 2 (1)
Mayo minnesota 28 march 2 (1)Mayo minnesota 28 march 2 (1)
Mayo minnesota 28 march 2 (1)
 
Day 3 SPSS
Day 3 SPSSDay 3 SPSS
Day 3 SPSS
 
HYPOTHESIS
HYPOTHESISHYPOTHESIS
HYPOTHESIS
 
Reviewing quantitative articles_and_checklist
Reviewing quantitative articles_and_checklistReviewing quantitative articles_and_checklist
Reviewing quantitative articles_and_checklist
 
Replication Crises and the Statistics Wars: Hidden Controversies
Replication Crises and the Statistics Wars: Hidden ControversiesReplication Crises and the Statistics Wars: Hidden Controversies
Replication Crises and the Statistics Wars: Hidden Controversies
 
Common Statistical Concerns in Clinical Trials
Common Statistical Concerns in Clinical TrialsCommon Statistical Concerns in Clinical Trials
Common Statistical Concerns in Clinical Trials
 
Power, Effect Sizes, Confidence Intervals, & Academic Integrity
Power, Effect Sizes, Confidence Intervals, & Academic IntegrityPower, Effect Sizes, Confidence Intervals, & Academic Integrity
Power, Effect Sizes, Confidence Intervals, & Academic Integrity
 
MethodUnderstandingStatisticalSignificanceMatthew .docx
MethodUnderstandingStatisticalSignificanceMatthew .docxMethodUnderstandingStatisticalSignificanceMatthew .docx
MethodUnderstandingStatisticalSignificanceMatthew .docx
 
Assessment 3 ContextYou will review the theory, logic, and a.docx
Assessment 3 ContextYou will review the theory, logic, and a.docxAssessment 3 ContextYou will review the theory, logic, and a.docx
Assessment 3 ContextYou will review the theory, logic, and a.docx
 
Meta analysis with R
Meta analysis with RMeta analysis with R
Meta analysis with R
 
Hypothesis testing pdf bhavana.pdf
Hypothesis testing pdf bhavana.pdfHypothesis testing pdf bhavana.pdf
Hypothesis testing pdf bhavana.pdf
 
hypothesis testing overview
hypothesis testing overviewhypothesis testing overview
hypothesis testing overview
 
Choosing statistical tests
Choosing statistical testsChoosing statistical tests
Choosing statistical tests
 
TEST of hypothesis
TEST of hypothesisTEST of hypothesis
TEST of hypothesis
 
An Alternative To Null-Hypothesis Significance Tests
An Alternative To Null-Hypothesis Significance TestsAn Alternative To Null-Hypothesis Significance Tests
An Alternative To Null-Hypothesis Significance Tests
 
P-Value: a true test of significance in agricultural research
P-Value: a true test of significance in agricultural researchP-Value: a true test of significance in agricultural research
P-Value: a true test of significance in agricultural research
 
Hypothesis testing
Hypothesis testingHypothesis testing
Hypothesis testing
 
P-Value "Reforms": Fixing Science or Threat to Replication and Falsification
P-Value "Reforms": Fixing Science or Threat to Replication and FalsificationP-Value "Reforms": Fixing Science or Threat to Replication and Falsification
P-Value "Reforms": Fixing Science or Threat to Replication and Falsification
 
importance of P value and its uses in the realtime Significance
importance of P value and its uses in the realtime Significanceimportance of P value and its uses in the realtime Significance
importance of P value and its uses in the realtime Significance
 
Statistical Significance Tests.pptx
Statistical Significance Tests.pptxStatistical Significance Tests.pptx
Statistical Significance Tests.pptx
 

More from Dustin Pytko

Critique Response Sample Peer Review Feedback Fo
Critique Response Sample Peer Review Feedback FoCritique Response Sample Peer Review Feedback Fo
Critique Response Sample Peer Review Feedback FoDustin Pytko
 
How To Write Better Essays (12 Best Tips)
How To Write Better Essays (12 Best Tips)How To Write Better Essays (12 Best Tips)
How To Write Better Essays (12 Best Tips)Dustin Pytko
 
How To Write A 500-Word Essay About - Agnew Text
How To Write A 500-Word Essay About - Agnew TextHow To Write A 500-Word Essay About - Agnew Text
How To Write A 500-Word Essay About - Agnew TextDustin Pytko
 
Sample On Project Management By Instant E
Sample On Project Management By Instant ESample On Project Management By Instant E
Sample On Project Management By Instant EDustin Pytko
 
Gingerbread Stationary Stationary Printable Free,
Gingerbread Stationary Stationary Printable Free,Gingerbread Stationary Stationary Printable Free,
Gingerbread Stationary Stationary Printable Free,Dustin Pytko
 
The Creative Spirit Graffiti Challenge 55 Graffiti Art Lett
The Creative Spirit Graffiti Challenge 55 Graffiti Art LettThe Creative Spirit Graffiti Challenge 55 Graffiti Art Lett
The Creative Spirit Graffiti Challenge 55 Graffiti Art LettDustin Pytko
 
My First Day At College - GCSE English - Marked B
My First Day At College - GCSE English - Marked BMy First Day At College - GCSE English - Marked B
My First Day At College - GCSE English - Marked BDustin Pytko
 
💋 The Help Movie Analysis Essay. The Help Film Anal.pdf
💋 The Help Movie Analysis Essay. The Help Film Anal.pdf💋 The Help Movie Analysis Essay. The Help Film Anal.pdf
💋 The Help Movie Analysis Essay. The Help Film Anal.pdfDustin Pytko
 
Essay Writing Step-By-Step A Newsweek Education Pr
Essay Writing Step-By-Step A Newsweek Education PrEssay Writing Step-By-Step A Newsweek Education Pr
Essay Writing Step-By-Step A Newsweek Education PrDustin Pytko
 
Writing A Dialogue Paper. How To Format Dialogue (Includes Exampl
Writing A Dialogue Paper. How To Format Dialogue (Includes ExamplWriting A Dialogue Paper. How To Format Dialogue (Includes Exampl
Writing A Dialogue Paper. How To Format Dialogue (Includes ExamplDustin Pytko
 
Sociology Essay Writing. Online assignment writing service.
Sociology Essay Writing. Online assignment writing service.Sociology Essay Writing. Online assignment writing service.
Sociology Essay Writing. Online assignment writing service.Dustin Pytko
 
Essay On Importance Of Education In 150 Words. Sh
Essay On Importance Of Education In 150 Words. ShEssay On Importance Of Education In 150 Words. Sh
Essay On Importance Of Education In 150 Words. ShDustin Pytko
 
Types Of Essays We Can Write For You Types Of Essay, E
Types Of Essays We Can Write For You Types Of Essay, ETypes Of Essays We Can Write For You Types Of Essay, E
Types Of Essays We Can Write For You Types Of Essay, EDustin Pytko
 
Lined Paper For Writing Notebook Paper Template,
Lined Paper For Writing Notebook Paper Template,Lined Paper For Writing Notebook Paper Template,
Lined Paper For Writing Notebook Paper Template,Dustin Pytko
 
Research Paper Executive Summary Synopsis Writin
Research Paper Executive Summary Synopsis WritinResearch Paper Executive Summary Synopsis Writin
Research Paper Executive Summary Synopsis WritinDustin Pytko
 
Uk Best Essay Service. Order Best Essays In UK
Uk Best Essay Service. Order Best Essays In UKUk Best Essay Service. Order Best Essays In UK
Uk Best Essay Service. Order Best Essays In UKDustin Pytko
 
What Is The Body Of A Paragraph. How To Write A Body Paragraph For A
What Is The Body Of A Paragraph. How To Write A Body Paragraph For AWhat Is The Body Of A Paragraph. How To Write A Body Paragraph For A
What Is The Body Of A Paragraph. How To Write A Body Paragraph For ADustin Pytko
 
My Handwriting , . Online assignment writing service.
My Handwriting , . Online assignment writing service.My Handwriting , . Online assignment writing service.
My Handwriting , . Online assignment writing service.Dustin Pytko
 
How To Stay Calm During Exam And Term Paper Writi
How To Stay Calm During Exam And Term Paper WritiHow To Stay Calm During Exam And Term Paper Writi
How To Stay Calm During Exam And Term Paper WritiDustin Pytko
 
Image Result For Fundations Letter Formation Page Fundations
Image Result For Fundations Letter Formation Page FundationsImage Result For Fundations Letter Formation Page Fundations
Image Result For Fundations Letter Formation Page FundationsDustin Pytko
 

More from Dustin Pytko (20)

Critique Response Sample Peer Review Feedback Fo
Critique Response Sample Peer Review Feedback FoCritique Response Sample Peer Review Feedback Fo
Critique Response Sample Peer Review Feedback Fo
 
How To Write Better Essays (12 Best Tips)
How To Write Better Essays (12 Best Tips)How To Write Better Essays (12 Best Tips)
How To Write Better Essays (12 Best Tips)
 
How To Write A 500-Word Essay About - Agnew Text
How To Write A 500-Word Essay About - Agnew TextHow To Write A 500-Word Essay About - Agnew Text
How To Write A 500-Word Essay About - Agnew Text
 
Sample On Project Management By Instant E
Sample On Project Management By Instant ESample On Project Management By Instant E
Sample On Project Management By Instant E
 
Gingerbread Stationary Stationary Printable Free,
Gingerbread Stationary Stationary Printable Free,Gingerbread Stationary Stationary Printable Free,
Gingerbread Stationary Stationary Printable Free,
 
The Creative Spirit Graffiti Challenge 55 Graffiti Art Lett
The Creative Spirit Graffiti Challenge 55 Graffiti Art LettThe Creative Spirit Graffiti Challenge 55 Graffiti Art Lett
The Creative Spirit Graffiti Challenge 55 Graffiti Art Lett
 
My First Day At College - GCSE English - Marked B
My First Day At College - GCSE English - Marked BMy First Day At College - GCSE English - Marked B
My First Day At College - GCSE English - Marked B
 
💋 The Help Movie Analysis Essay. The Help Film Anal.pdf
💋 The Help Movie Analysis Essay. The Help Film Anal.pdf💋 The Help Movie Analysis Essay. The Help Film Anal.pdf
💋 The Help Movie Analysis Essay. The Help Film Anal.pdf
 
Essay Writing Step-By-Step A Newsweek Education Pr
Essay Writing Step-By-Step A Newsweek Education PrEssay Writing Step-By-Step A Newsweek Education Pr
Essay Writing Step-By-Step A Newsweek Education Pr
 
Writing A Dialogue Paper. How To Format Dialogue (Includes Exampl
Writing A Dialogue Paper. How To Format Dialogue (Includes ExamplWriting A Dialogue Paper. How To Format Dialogue (Includes Exampl
Writing A Dialogue Paper. How To Format Dialogue (Includes Exampl
 
Sociology Essay Writing. Online assignment writing service.
Sociology Essay Writing. Online assignment writing service.Sociology Essay Writing. Online assignment writing service.
Sociology Essay Writing. Online assignment writing service.
 
Essay On Importance Of Education In 150 Words. Sh
Essay On Importance Of Education In 150 Words. ShEssay On Importance Of Education In 150 Words. Sh
Essay On Importance Of Education In 150 Words. Sh
 
Types Of Essays We Can Write For You Types Of Essay, E
Types Of Essays We Can Write For You Types Of Essay, ETypes Of Essays We Can Write For You Types Of Essay, E
Types Of Essays We Can Write For You Types Of Essay, E
 
Lined Paper For Writing Notebook Paper Template,
Lined Paper For Writing Notebook Paper Template,Lined Paper For Writing Notebook Paper Template,
Lined Paper For Writing Notebook Paper Template,
 
Research Paper Executive Summary Synopsis Writin
Research Paper Executive Summary Synopsis WritinResearch Paper Executive Summary Synopsis Writin
Research Paper Executive Summary Synopsis Writin
 
Uk Best Essay Service. Order Best Essays In UK
Uk Best Essay Service. Order Best Essays In UKUk Best Essay Service. Order Best Essays In UK
Uk Best Essay Service. Order Best Essays In UK
 
What Is The Body Of A Paragraph. How To Write A Body Paragraph For A
What Is The Body Of A Paragraph. How To Write A Body Paragraph For AWhat Is The Body Of A Paragraph. How To Write A Body Paragraph For A
What Is The Body Of A Paragraph. How To Write A Body Paragraph For A
 
My Handwriting , . Online assignment writing service.
My Handwriting , . Online assignment writing service.My Handwriting , . Online assignment writing service.
My Handwriting , . Online assignment writing service.
 
How To Stay Calm During Exam And Term Paper Writi
How To Stay Calm During Exam And Term Paper WritiHow To Stay Calm During Exam And Term Paper Writi
How To Stay Calm During Exam And Term Paper Writi
 
Image Result For Fundations Letter Formation Page Fundations
Image Result For Fundations Letter Formation Page FundationsImage Result For Fundations Letter Formation Page Fundations
Image Result For Fundations Letter Formation Page Fundations
 

Recently uploaded

URLs and Routing in the Odoo 17 Website App
URLs and Routing in the Odoo 17 Website AppURLs and Routing in the Odoo 17 Website App
URLs and Routing in the Odoo 17 Website AppCeline George
 
The basics of sentences session 2pptx copy.pptx
The basics of sentences session 2pptx copy.pptxThe basics of sentences session 2pptx copy.pptx
The basics of sentences session 2pptx copy.pptxheathfieldcps1
 
Science 7 - LAND and SEA BREEZE and its Characteristics
Science 7 - LAND and SEA BREEZE and its CharacteristicsScience 7 - LAND and SEA BREEZE and its Characteristics
Science 7 - LAND and SEA BREEZE and its CharacteristicsKarinaGenton
 
Introduction to ArtificiaI Intelligence in Higher Education
Introduction to ArtificiaI Intelligence in Higher EducationIntroduction to ArtificiaI Intelligence in Higher Education
Introduction to ArtificiaI Intelligence in Higher Educationpboyjonauth
 
Solving Puzzles Benefits Everyone (English).pptx
Solving Puzzles Benefits Everyone (English).pptxSolving Puzzles Benefits Everyone (English).pptx
Solving Puzzles Benefits Everyone (English).pptxOH TEIK BIN
 
Class 11 Legal Studies Ch-1 Concept of State .pdf
Class 11 Legal Studies Ch-1 Concept of State .pdfClass 11 Legal Studies Ch-1 Concept of State .pdf
Class 11 Legal Studies Ch-1 Concept of State .pdfakmcokerachita
 
“Oh GOSH! Reflecting on Hackteria's Collaborative Practices in a Global Do-It...
“Oh GOSH! Reflecting on Hackteria's Collaborative Practices in a Global Do-It...“Oh GOSH! Reflecting on Hackteria's Collaborative Practices in a Global Do-It...
“Oh GOSH! Reflecting on Hackteria's Collaborative Practices in a Global Do-It...Marc Dusseiller Dusjagr
 
The Most Excellent Way | 1 Corinthians 13
The Most Excellent Way | 1 Corinthians 13The Most Excellent Way | 1 Corinthians 13
The Most Excellent Way | 1 Corinthians 13Steve Thomason
 
Presentation by Andreas Schleicher Tackling the School Absenteeism Crisis 30 ...
Presentation by Andreas Schleicher Tackling the School Absenteeism Crisis 30 ...Presentation by Andreas Schleicher Tackling the School Absenteeism Crisis 30 ...
Presentation by Andreas Schleicher Tackling the School Absenteeism Crisis 30 ...EduSkills OECD
 
BASLIQ CURRENT LOOKBOOK LOOKBOOK(1) (1).pdf
BASLIQ CURRENT LOOKBOOK  LOOKBOOK(1) (1).pdfBASLIQ CURRENT LOOKBOOK  LOOKBOOK(1) (1).pdf
BASLIQ CURRENT LOOKBOOK LOOKBOOK(1) (1).pdfSoniaTolstoy
 
microwave assisted reaction. General introduction
microwave assisted reaction. General introductionmicrowave assisted reaction. General introduction
microwave assisted reaction. General introductionMaksud Ahmed
 
Contemporary philippine arts from the regions_PPT_Module_12 [Autosaved] (1).pptx
Contemporary philippine arts from the regions_PPT_Module_12 [Autosaved] (1).pptxContemporary philippine arts from the regions_PPT_Module_12 [Autosaved] (1).pptx
Contemporary philippine arts from the regions_PPT_Module_12 [Autosaved] (1).pptxRoyAbrique
 
Mastering the Unannounced Regulatory Inspection
Mastering the Unannounced Regulatory InspectionMastering the Unannounced Regulatory Inspection
Mastering the Unannounced Regulatory InspectionSafetyChain Software
 
Concept of Vouching. B.Com(Hons) /B.Compdf
Concept of Vouching. B.Com(Hons) /B.CompdfConcept of Vouching. B.Com(Hons) /B.Compdf
Concept of Vouching. B.Com(Hons) /B.CompdfUmakantAnnand
 
SOCIAL AND HISTORICAL CONTEXT - LFTVD.pptx
SOCIAL AND HISTORICAL CONTEXT - LFTVD.pptxSOCIAL AND HISTORICAL CONTEXT - LFTVD.pptx
SOCIAL AND HISTORICAL CONTEXT - LFTVD.pptxiammrhaywood
 
Presiding Officer Training module 2024 lok sabha elections
Presiding Officer Training module 2024 lok sabha electionsPresiding Officer Training module 2024 lok sabha elections
Presiding Officer Training module 2024 lok sabha electionsanshu789521
 
Alper Gobel In Media Res Media Component
Alper Gobel In Media Res Media ComponentAlper Gobel In Media Res Media Component
Alper Gobel In Media Res Media ComponentInMediaRes1
 

Recently uploaded (20)

URLs and Routing in the Odoo 17 Website App
URLs and Routing in the Odoo 17 Website AppURLs and Routing in the Odoo 17 Website App
URLs and Routing in the Odoo 17 Website App
 
The basics of sentences session 2pptx copy.pptx
The basics of sentences session 2pptx copy.pptxThe basics of sentences session 2pptx copy.pptx
The basics of sentences session 2pptx copy.pptx
 
Science 7 - LAND and SEA BREEZE and its Characteristics
Science 7 - LAND and SEA BREEZE and its CharacteristicsScience 7 - LAND and SEA BREEZE and its Characteristics
Science 7 - LAND and SEA BREEZE and its Characteristics
 
Introduction to ArtificiaI Intelligence in Higher Education
Introduction to ArtificiaI Intelligence in Higher EducationIntroduction to ArtificiaI Intelligence in Higher Education
Introduction to ArtificiaI Intelligence in Higher Education
 
Solving Puzzles Benefits Everyone (English).pptx
Solving Puzzles Benefits Everyone (English).pptxSolving Puzzles Benefits Everyone (English).pptx
Solving Puzzles Benefits Everyone (English).pptx
 
Class 11 Legal Studies Ch-1 Concept of State .pdf
Class 11 Legal Studies Ch-1 Concept of State .pdfClass 11 Legal Studies Ch-1 Concept of State .pdf
Class 11 Legal Studies Ch-1 Concept of State .pdf
 
Staff of Color (SOC) Retention Efforts DDSD
Staff of Color (SOC) Retention Efforts DDSDStaff of Color (SOC) Retention Efforts DDSD
Staff of Color (SOC) Retention Efforts DDSD
 
“Oh GOSH! Reflecting on Hackteria's Collaborative Practices in a Global Do-It...
“Oh GOSH! Reflecting on Hackteria's Collaborative Practices in a Global Do-It...“Oh GOSH! Reflecting on Hackteria's Collaborative Practices in a Global Do-It...
“Oh GOSH! Reflecting on Hackteria's Collaborative Practices in a Global Do-It...
 
The Most Excellent Way | 1 Corinthians 13
The Most Excellent Way | 1 Corinthians 13The Most Excellent Way | 1 Corinthians 13
The Most Excellent Way | 1 Corinthians 13
 
Presentation by Andreas Schleicher Tackling the School Absenteeism Crisis 30 ...
Presentation by Andreas Schleicher Tackling the School Absenteeism Crisis 30 ...Presentation by Andreas Schleicher Tackling the School Absenteeism Crisis 30 ...
Presentation by Andreas Schleicher Tackling the School Absenteeism Crisis 30 ...
 
BASLIQ CURRENT LOOKBOOK LOOKBOOK(1) (1).pdf
BASLIQ CURRENT LOOKBOOK  LOOKBOOK(1) (1).pdfBASLIQ CURRENT LOOKBOOK  LOOKBOOK(1) (1).pdf
BASLIQ CURRENT LOOKBOOK LOOKBOOK(1) (1).pdf
 
microwave assisted reaction. General introduction
microwave assisted reaction. General introductionmicrowave assisted reaction. General introduction
microwave assisted reaction. General introduction
 
CĂłdigo Creativo y Arte de Software | Unidad 1
CĂłdigo Creativo y Arte de Software | Unidad 1CĂłdigo Creativo y Arte de Software | Unidad 1
CĂłdigo Creativo y Arte de Software | Unidad 1
 
Contemporary philippine arts from the regions_PPT_Module_12 [Autosaved] (1).pptx
Contemporary philippine arts from the regions_PPT_Module_12 [Autosaved] (1).pptxContemporary philippine arts from the regions_PPT_Module_12 [Autosaved] (1).pptx
Contemporary philippine arts from the regions_PPT_Module_12 [Autosaved] (1).pptx
 
Mastering the Unannounced Regulatory Inspection
Mastering the Unannounced Regulatory InspectionMastering the Unannounced Regulatory Inspection
Mastering the Unannounced Regulatory Inspection
 
Model Call Girl in Tilak Nagar Delhi reach out to us at 🔝9953056974🔝
Model Call Girl in Tilak Nagar Delhi reach out to us at 🔝9953056974🔝Model Call Girl in Tilak Nagar Delhi reach out to us at 🔝9953056974🔝
Model Call Girl in Tilak Nagar Delhi reach out to us at 🔝9953056974🔝
 
Concept of Vouching. B.Com(Hons) /B.Compdf
Concept of Vouching. B.Com(Hons) /B.CompdfConcept of Vouching. B.Com(Hons) /B.Compdf
Concept of Vouching. B.Com(Hons) /B.Compdf
 
SOCIAL AND HISTORICAL CONTEXT - LFTVD.pptx
SOCIAL AND HISTORICAL CONTEXT - LFTVD.pptxSOCIAL AND HISTORICAL CONTEXT - LFTVD.pptx
SOCIAL AND HISTORICAL CONTEXT - LFTVD.pptx
 
Presiding Officer Training module 2024 lok sabha elections
Presiding Officer Training module 2024 lok sabha electionsPresiding Officer Training module 2024 lok sabha elections
Presiding Officer Training module 2024 lok sabha elections
 
Alper Gobel In Media Res Media Component
Alper Gobel In Media Res Media ComponentAlper Gobel In Media Res Media Component
Alper Gobel In Media Res Media Component
 

A Bayesian Alternative To Null Hypothesis Significance Testing

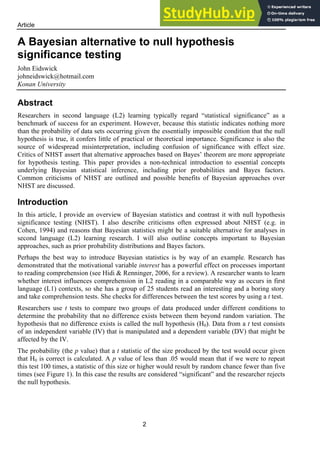
  • 1. Article 2 A Bayesian alternative to null hypothesis significance testing John Eidswick johneidswick@hotmail.com Konan University Abstract Researchers in second language (L2) learning typically regard “statistical significance” as a benchmark of success for an experiment. However, because this statistic indicates nothing more than the probability of data sets occurring given the essentially impossible condition that the null hypothesis is true, it confers little of practical or theoretical importance. Significance is also the source of widespread misinterpretation, including confusion of significance with effect size. Critics of NHST assert that alternative approaches based on Bayes’ theorem are more appropriate for hypothesis testing. This paper provides a non-technical introduction to essential concepts underlying Bayesian statistical inference, including prior probabilities and Bayes factors. Common criticisms of NHST are outlined and possible benefits of Bayesian approaches over NHST are discussed. Introduction In this article, I provide an overview of Bayesian statistics and contrast it with null hypothesis significance testing (NHST). I also describe criticisms often expressed about NHST (e.g. in Cohen, 1994) and reasons that Bayesian statistics might be a suitable alternative for analyses in second language (L2) learning research. I will also outline concepts important to Bayesian approaches, such as prior probability distributions and Bayes factors. Perhaps the best way to introduce Bayesian statistics is by way of an example. Research has demonstrated that the motivational variable interest has a powerful effect on processes important to reading comprehension (see Hidi & Renninger, 2006, for a review). A researcher wants to learn whether interest influences comprehension in L2 reading in a comparable way as occurs in first language (L1) contexts, so she has a group of 25 students read an interesting and a boring story and take comprehension tests. She checks for differences between the test scores by using a t test. Researchers use t tests to compare two groups of data produced under different conditions to determine the probability that no difference exists between them beyond random variation. The hypothesis that no difference exists is called the null hypothesis (H0). Data from a t test consists of an independent variable (IV) that is manipulated and a dependent variable (DV) that might be affected by the IV. The probability (the p value) that a t statistic of the size produced by the test would occur given that H0 is correct is calculated. A p value of less than .05 would mean that if we were to repeat this test 100 times, a statistic of this size or higher would result by random chance fewer than five times (see Figure 1). In this case the results are considered “significant” and the researcher rejects the null hypothesis.
  • 2. Eidswick 3 Shiken Research Bulletin 16(1). May 2012. Figure 1. Idealized distribution of scores with threshold p=.05 marked. If the t statistic falls to the right of this line, the mean difference between H0 and H1 is considered statistically significant. Note that space constraints do not permit detailed discussion in this article of one- and two-tailed tests, t distributions, degrees of freedom, confidence intervals, effect sizes, or statistical power, but these are also important aspects of NHST. Readers unfamiliar with these concepts are encouraged to read explanations that can be found in many introductory statistics textbooks (e.g. Field, 2009). Our researcher performs a t test on the data (in reality, the data was produced using a random number generator for normal distributions at Wessa, 2008). Table 1 shows the descriptive statistics and the results are provided in Table 2. Table 1. Descriptive Statistics for Boring and Interesting Text Conditions Text Group N M SD SE Boring 25 10.24 2.13 .43 Interesting 25 10.92 3.76 .75 Table 2. T Test Results for Boring and Interesting Text Conditions Df SED MD T p (one-tailed) 24 .489 .68 1.69 .098 Note: p<.05. As can be seen, the results are insignificant at p<.05, because .098 is larger than .05. The researcher therefore is inclined not to reject the null hypothesis. A colleague of our researcher, on a lark, does the same experiment with a very similar group of students and adds the scores to the original data. The t test is performed again, now with an N size of 50. The new descriptive statistics and t test results are provided in Tables 3 and 4. Table 3. Descriptive Statistics for Boring and Interesting Text Conditions -4 -3 -2 -1 0 1 2 3 4 Region to the right of this line is p<.05.
  • 3. 4 A Bayesian alternative to null hypothesis testing Shiken Research Bulletin 16(1). May 2012. Text Group N M SD SE Boring 50 10.24 2.10 .30 Interesting 50 10.92 3.72 .53 Table 4. T Test Results for Boring and Interesting Text Conditions Df SED MD T p (one-tailed) 49 .342 .68 1.99 .026* Note. *p<.05. As we can see, the descriptives have changed little, but the results of the t test are now significant. By convention, these results are now considered publishable, despite the fact that for all practical purposes they are identical to those of the previous experiment. This poses a serious dilemma for our researchers. Should they reject or not reject the null hypothesis? In order to get published, should they favor the second results and pretend those of the original study did not occur? The source of the dilemma lies in the fact that finding significance is reliant on statistical power, which is related to sample size. Such is the relationship between N size and significance that in the case of a large enough number of cases, finding significance is all but certain, irrespective of an actual experimental effect. This is one of several problems described by critics of NHST. Criticism of null hypothesis significance testing Criticism of NHST can be divided into two categories: 1) weaknesses of NHST as an evaluative tool, and 2) misinterpretations of what NHST results mean. Weaknesses Problematic qualities of NHST cited by critics include: • The primacy of significance. Editors of L2 learning academic journals tend to view significance as the mark of success, but using the p value as a Litmus test for “success” is problematic. As noted, variations of sample size can change the likelihood of finding significance, a characteristic that leads some statisticians to argue that NHST p values do not qualify as measures of statistical evidence, much less success, because identical p values do not convey identical levels of evidence when sample sizes differ (Wagenmakers, 2007). • The primacy of significance thresholds. R.A. Fisher, whose work underpinned the development of the p value, did not himself regard p values as rigid cut-off points (Salsburg, 2001). In fact, Fisher’s selection of these benchmarks was at least somewhat arbitrary; he identified p value thresholds in his book Statistical Methods for Research Workers (1925) by providing critical values tables, which were limited to .05, .02, and .01, to “save space” (Field, 2009, p. 51). As Abelson (1997) commented, “Literal insistence on the .05 level is as silly as would be other arbitrarily rigid quality standards for research results, like 30% generality, or more interestingness than three quarters of the existing literature” (p. 14). • Power issues. Statistical power refers to the probability that a test can detect an effect. Adjustments made in analyses to reduce the chances of incorrectly rejecting H0 (Type I errors) or incorrectly failing to reject H0 (Type II errors), inevitable in a range of NHST-based tests, involve a loss of statistical power.
  • 4. Eidswick 5 Shiken Research Bulletin 16(1). May 2012. Misconceptions Misconceptions persist regarding what NHST in fact measures and what its results mean. Some are outlined below. • The meaning of significance. It is tempting to conclude that statistical significance indicates that the null hypothesis is false and the alternate hypothesis is true, but this is not correct. The finding of significance really means nothing more than the researcher is inclined to reject the null hypothesis based on a low probability (defined by a somewhat arbitrarily chosen threshold) that the data at hand would occur randomly in many recursions of it. Significance does not mean the null hypothesis is formally invalid. Rejecting H0 does not prove H1, but instead merely offers an indirect and rather flimsy indicator of support for it. • The meaning of lack of significance. Because NHST purports to test the hypothesis that the null hypothesis is true, one might well be inclined to infer that an “insignificant” finding means just that: the null hypothesis is true. In fact, situations where mean differences are literally zero virtually never occur in the real world. • Substitution of a conditional probability for its inverse. The notion that the probability of certain data given that H0 is true, that is, P(D|H0), is equivalent to the probability that H0 is true given certain data, or P(H0|D), is intuitively appealing, but the difference between these two becomes clear when contemplating the probability of having a runny nose given the condition of having the flu versus having the flu given the condition of having a runny nose; one can have a runny nose for many reasons besides the flu. • The idea that “significance” means “importance”. Significance does not refer to the magnitude of an experimental effect. Reporting effect sizes in published studies would help clarify this misunderstanding, but few L2 researchers do so. While the issues outlined above might create obstacles to rigorous hypothesis construction and testing, critics of NHST assert that a solution to many of these problems lies in Bayesian statistics. Bayesian statistics Bayesian statistical approaches are drawn from the work of 18th century mathematician Thomas Bayes. Bayesian and classical statistical approaches differ crucially in two areas. The first relates to how analyses are interpreted. Frequentist approaches like NHST produce p values that estimate the likelihood that the data would occur given that the null hypothesis is true. Rather than stating a “cut point” after which one hypothesis is chosen over another, Bayesian analyses result in probability values that are used to compare the relative support for one hypothesis over another. In short, frequentists seek significance and Bayesians seek probability support for a hypothesis. The second area where the two kinds of approaches differ is the formal use of prior information. Frequentists ignore what was previously known about the experimental condition when conducting a new experiment, but incorporating this prior information into future analyses is an essential part of Bayesian approaches. Prior information is incorporated by using the feature which most distinguishes Bayesian statistics, the prior probability. Thomas Bayes’s solution to a problem of “inverse probability” (e.g., estimating the unknown likelihood of an event happening given the known likelihood of a certain condition) contained a description of the formula which has come to be known as Bayes’ theorem. As noted, a
  • 5. 6 A Bayesian alternative to null hypothesis testing Shiken Research Bulletin 16(1). May 2012. distinctive feature of the formula is the prior probability (the prior). In a basic application of Bayes’ formula, the multiplied product of the prior and the probability of data given a certain parameter is divided by the probability of the parameter defining the sample space to produce a posterior probability (the posterior): ! ! ! = ! ! ! !(!) !(!) where A is the parameter under investigation and B is the data. Let us make our introduction to Bayes less abstract with a simple example (adapted from Bonilla, 2011; for another non-technical example of Bayes’ formula, see Yudkowsky, 2003). The data used in the first t test could be categorized as individuals who passed and failed the comprehension test. If we consider test scores of 12 (60%) or higher as “pass” and those below as “fail,” then 6 of 25 students (24%) passed the test in the boring text condition, and 15 of 25 students (60%) passed in the interesting text condition. To understand how Bayes’ formula works, it is useful to concentrate on how the Interest condition relates to the Pass scores (see Figure 2). Figure 2. Interesting and boring text conditions divided into passed (shaded areas) and failed (unshaded areas) results on comprehension tests. The rectangle on the left indicates the Interesting condition, the rectangle on the right the boring condition, The shaded areas indicate the proportions of students in each condition that passed the test. The shaded rectangle to the left of the center dividing line represents the intersect of students who found the text interesting and passed the test; it is denoted as Int " Pass, which can be read as “Int and Pass happen together”. Likewise, the shaded portion of the “Boring” condition indicates the intersect of students who found the text boring with those who passed the test (Bor " Pass). What is the probability that a student passed the test if he read the interesting text? In conditional probability notation, this is signified by P(Pass | Int), which is read, “the probability of the event of a student’s passing given the event that the student read the interesting text”. We can think of this as the answer to the question, “how much of the Interesting rectangle is accounted for by the shaded Passed area?” The answer is already given as 60%. This is not what the researcher really wants to know, however. The researcher is interested not in the probability of passing given that the text is interesting, but in the probability of the text being interesting given that the student passed. This is represented by P(Int | Pass), which means, “the probability the text was interesting given that the test was passed”. We can easily calculate this information from Bayes’ formula as follows: ! !"# !"## = ! !"## !"# !(!"#) !(!"##)
  • 6. Eidswick 7 Shiken Research Bulletin 16(1). May 2012. The values in the numerator are already known—the probability a student passed given that he thought the text was interesting is 0.60: ! !"## !"# = .60 and the probability that the student found the text interesting is 0.50, as half the scores came from the interesting condition: !(!"#) = .50 The shaded Pass area has two parts: (A) the section contributed by the Int condition, and (B) the section contributed by the non-Int (boring) condition. To calculate !(!"##), these two parts are added. In calculating (A), we are asking,!how much of the Pass area is made up of passing scores in the context of the Interest rectangle? The probability of a passing score within the Interest rectangle, P(Pass | Int), is .60. To find out how much of this probability contributes to the Pass area, we simply multiply it by P(Int), which is the probability of the student finding the text interesting, or 50%: .60 × .50 = .30. Likewise, in calculating (B), we are asking “how much of the Pass area is comprised of passing scores in the context of the Boring condition?” Mathematically, this is P(Pass | B) × P(B). We know that 24% of the students who read the boring text passed the test and that 50% of the scores came from this condition. Therefore, (B) is calculated: .24 × .50 = .12. The denominator in Bayes formula, !(!"##), then, is: .30 + .12 = .42. Plugging our values into Bayes’ formula, we obtain: ! !"! !"## = .!" .!" = .71 Therefore, if we randomly draw a student with a passing test score from this group, there is a 71% chance that he read the interesting text. If we were to calculate P(B | Pass) using Bayes formula, we would obtain the remaining percentage of this region, that is, 29%. Of course, since probability of a given space must add up to 1, we could also simply subtract .71 from 1 to derive .29. We can now add these probabilities to the previous diagram:
  • 7. 8 A Bayesian alternative to null hypothesis testing Shiken Research Bulletin 16(1). May 2012. Figure 3. Bayes formula provides probabilities of passing conditions. Although in this simple example the difference between pass and fail percentages is stark; however, it should be noted that the results are not always so obvious. If far more students found the texts boring than interesting, it is possible that a student that passed will still have a higher likelihood of having thought his book was boring, even if a much higher proportion of students who thought the texts were interesting passed. Bayes’ rule adjusts for differences in sample sizes between conditions when calculating these probabilities. Prior probabilities The simple example above might be useful for illustrating the basic dimensions of Bayes theorem, but it elides over some important points, chiefly to do with the assignment of the prior probability. Unlike classical statistics, Bayesian approaches enable researchers to include relevant prior information in formal experimentation. If previous research indicates one outcome is more likely than another, a Bayesian can integrate this information into his hypothesis formation and testing (Figure 3). The revised probability resulting from the new experiment can then influence the selection of priors used in subsequent investigations to further refine probability estimations in support of one hypothesis or other. The prior probability is a summary of a researcher’s belief about the outcome of a given experiment. In the example above, for simplicity, the prior,!!(!), was given as a known value and as a simple mean, but in a normal Bayesian analysis, the prior would be designated based on personal belief of the researcher. This personal belief could be drawn from previous research, or even just the researcher’s conjecture. Since Bayesians, unlike frequentists, regard unknown values under investigation as random variables (that is, variables that manifest as values with certain probabilities), the conjectured outcomes for these values, expressed by the prior, take the form of probability distributions, indicated concretely by parameters like mean, standard deviation, and range. If prior information is lacking, the researcher can use a prior that expresses a high degree of uncertainty. High uncertainty can be related by designating a prior with a large standard deviation and by maximizing the range (Klugkist & Mulder, 2008). When probability distributions are used in Bayesian procedures, the calculations become much more complicated than those of our example. They are accomplished using calculus and sophisticated algorithms (such as Markov Chain Monte Carlo) that require a computer to generate. The good news is that software for using these procedures is available. 10 15 6 19 Interesting (n = 25) Boring (n = 25) Passed (n = 21) P(Pass | Interesting) = 71% P(Pass | Boring) = 29%
  • 8. Eidswick 9 Shiken Research Bulletin 16(1). May 2012. Figure 4. Bayesian approaches combine prior information, in the form of a prior probability, to produce an updated view of phenomena, in the form of a posterior probability (adapted from Stevens, 2009). Why use a prior? To understand why Bayesians incorporate prior information into statistical inference, it is helpful to understand the quite different perceptions frequentists and Bayesians have of probability and the different goals the two kinds of researchers have in hypothesis testing. For frequentists, probability is the likelihood that a certain unknown (and ultimately unknowable) value lies within a distribution of values drawn from many samplings of a population, with the goal of analyses being to estimate whether sampled data would occur less than five percent of the time (p < 0.05) given the null hypothesis is true. For Bayesians, probability is conceived as a degree of personal belief which can be refined by confrontation with real-world evidence. In Bayesian statistics, the goal is to modify a given state of knowledge about a phenomenon by connecting it to data; to do so without concretely representing the state of knowledge would be impossible. This existing state of knowledge is represented using the prior. Moreover, because the prior summarizes researcher belief about experimental outcomes, it can also be considered an expression of a hypothesis, a prediction subject to modification given new information collected during the new experiment. To make this clearer, let’s look at another example. Our first researcher, devastated by her t test debacle, throws away her data. A second researcher, a Bayesian, discovers her data while rooting through the trash bin. He decides to analyze it using a Bayesian approach. Our Bayesian researcher considers some choices for a prior. In the absence of much prior information or a defined hypothesis, he might choose a prior that indicates only that a range exists in scores, from 0 to 20, with each score having equal probability of occurring. The X-axis of the uniform prior (Figure 4) shows the range of comprehension test scores from zero to 20, and the Y-axis shows the probability of those scores according to the prior. This kind of uniform, approximately objective, prior conveys much uncertainty and provides little information, so the data will dominate the calculation of the posterior probability.
  • 9. 10 A Bayesian alternative to null hypothesis testing Shiken Research Bulletin 16(1). May 2012. Figure 4. Uniform prior where each score on the comprehension test has an equal probability of occurring. While this prior would be approximately objective, it would also likely be an unrealistic representation of the data. Our researcher might view a uniform prior as unrealistic, since data are unlikely to be flatly distributed. Also, while the results of the scavenged t tests were contradictory in terms of significance, they do suggest a modest degree of variance attributable to the interesting text condition. Our researcher gleans further in a literature review that related (fictional) studies indicate that interest contributes about 5% to increases in text comprehension. He could assign a prior with a mean score 5% higher than would occur by chance (i.e. one point higher than a mean of 10) with a standard deviation of 5. The standard deviation for a normal distribution can be estimated by dividing the highest extreme of the range of scores, in this case 20, by four. Figure 5 shows the distribution of this subjective prior. The X-axis shows the range of comprehension scores, and the Y-axis shows the probability of the scores occurring. For example, a score of 11 (the mean) would have a probability of approximately .16 or 16% of occurring whereas a score of 5 would have about .01 or 1% chance of occurring. Using this subjective prior would involve the meeting of the hypothesized outcome represented by the prior (interest influences comprehension positively by a predicted amount, with a predicted degree of dispersion) with the data. The probabilities predicted by this prior would be somewhat higher than those predicted to occur by chance, so while this prior is subjective, it is also quite conservative. Our Bayesian decides to use the more informative prior to test his hypothesis. To aid in the calculations, and to compare the relative support of his hypothesis with that of the null, he uses a Bayes factor. 0.1 0.2 0.3 0.4 0.5 0.6 0.7 0.8 0.9 1 0 5 10 15 20 Probability of score occurring Possible comprehension test scores
  • 10. Eidswick 11 Shiken Research Bulletin 16(1). May 2012. Figure 5. Prior with a normal distribution and a mean of 11. This somewhat subjective prior would reflect a hypothesized distribution based on previous research. Bayes factors In a Bayesian version of a t test, the probability of H0 and its alternative are compared to produce a statistic called a Bayes factor (BF). Put simply, the BF is a ratio that compares the likelihood of one model over another, thereby showing the relative support for the researcher’s hypothesis versus another hypothesis (which may or may not be the null). Interpretation of the BF is straightforward. For example, a BF of 4 for H1 versus H0 indicates support for H1 is 4 times that of H0. A BF of .5 provides two times the support for H0 than for H1 (Klugkist, 2008). Bayes factors between .3 and 3 do not provide much evidence to differentiate the two hypotheses (Jeffreys, 1939, 1998). In order to run the necessary calculations, the researcher uses an online Bayes factor calculator, provided at the following link (Dienes, 2008): http://www.lifesci.sussex.ac.uk/home/Zoltan_Dienes/inference/bayes_factor.swf The calculator provides a limited range of priors templates for calculating a simple BF for a Bayesian “t test” that shows the relative support for the null hypothesis, as manifested by a population value with a mean of 0, and a hypothesis, as expressed by the mean differences and distributions assigned by the researcher (For supporting explanation, see Dienes, 2011). Some simple modifications to our researcher’s data are required to use the calculator. Our researcher chooses a normal distribution option and enters a mean difference of 5% with a range of 1% to 10% and a standard deviation of 2.5. With the t test data (N=50), the BF produced is .45. This indicates slightly more support for the null versus the interest hypothesis. This contrasts with the finding of statistical significance in the second t test, and that our researcher’s interpretation of the BF involves neither rejecting nor failing to reject the null, but instead making inferences based on the comparative likelihoods of H0 and H1. 0 0.02 0.04 0.06 0.08 0.1 0.12 0.14 0.16 0.18 0 5 10 15 20 Possible comprehension test scores Probability of score occurring
  • 11. 12 A Bayesian alternative to null hypothesis testing Shiken Research Bulletin 16(1). May 2012. Given this result, the researcher would be inclined to align his confidence somewhat away from the findings of other research in L1-based contexts. He might give careful consideration to the special characteristics of L2 readers and design future studies to explore in a more nuanced way potential effects of interest on reading comprehension. In the service of using accumulated experiences to update and refine knowledge, the results of a Bayesian analysis are used to contribute to new hypotheses and to shape the priors assigned in future studies. Note that this kind of statistical reasoning is essentially different from that of many researchers interpreting the results of a NHST. In the case of the example t tests, our first researcher either rejects the null hypothesis (with the higher N size) or does not reject the null hypothesis (with the lower N size), and then draws only peripherally related conclusions. Bayesian benefits Several qualities of Bayesian statistics might render them useful in L2 learning research, including: • Flexibility. Bayesian approaches permit direct comparisons between multiple hypotheses by incorporating inequality constraints; null hypothesis-based comparisons of multiple hypotheses require secondary procedures, such as post hoc tests, which can result in reduced statistical power and can yield mutually inconsistent results. • Protection against fallacious “significance”. Power and N sizes are not irrelevant to Bayesian approaches, but, unlike NHST, high numbers of cases do not inevitably result in something akin to “significance.” Instead, in a Bayesian t test where the null is approximately correct, higher N sizes drive the BF toward zero (Dienes, 2011). • Validity: Bayesian methods directly address questions researchers are trying to answer. Unlike frequentists, who test “’nothing is going on’ versus ‘something is going on but I don’t know what’” (Boelen & Hoijtink, 2008, p. 10), Bayesians ask, “what is the chance my hypothesis is true given the evidence?” • Possible: A variety of Bayesian software packages are available, some reasonably user-friendly. For example, the Bayesian Inequality and Equality Model Selection (BIEMS) program (Mulder, Hoijtink, & de Leeuw, 2012; Mulder, Hoijtink, & Klugkist, 2010; Mulder, Klugkist, van de Schoot, Meeus, Selfhout, & Hoijtink, 2009) is available for free and has a Windows user interface. For a thoroughgoing description of available software packages for Bayesian approaches, see Hoijtink, (2012). • Objective: Perhaps the most pervasive criticism of Bayesian approaches relates to the prior, which entails, it is believed, a subjective and therefore biased decision by the researcher. However, vague or uninformative priors can be assigned which are approximately objective. Conclusion Researchers in L2 learning use NHST almost exclusively. However, many researchers are unfamiliar with the limitations of NHST and unaware that alternative procedures, such as those related to Bayes’ theorem, exist. Despite the growing wealth of explanatory materials and availability of software by which even non-statisticians can avail themselves to Bayesian statistical methods, to date, no researcher to my knowledge has attempted to use these potentially advantageous procedures in research focused on L2 learning.
  • 12. Eidswick 13 Shiken Research Bulletin 16(1). May 2012. References Abelson, R. P. (1997). On the surprising longevity of flogged horses: Why there is a case for the significance test. Psychological Science, 8, 12-15. Boelen, P. A., & Hoijtink, H. (2008). Illustrative psychological data and hypotheses for Bayesian inequality constrained analysis of variance. In H. Hoijtink, I. Klugkist, & P. A. Boelen (Eds.), Bayesian evaluation of informative hypotheses (pp.7-26). New York: Springer. Bonilla, O. (2011). Visualizing Bayes’ theorem. Math115.com. Retrieved from http://math115.com/2011/02/visualizing-bayes%e2%80%99-theorem/ Cohen J. (1994) The earth is round (p < 0.05). American Psychologist, 49(12), 997–1003. Dienes, Z. (2008). Understanding psychology as a science: An introduction to scientific and statistical inference [Supplemental material]. Hampshire, England: Palgrave Macmillan. Retrieved from http://www.lifesci.sussex.ac.uk/home/Zoltan_Dienes/inference/ Dienes, Z. (2011). Bayesian Versus Orthodox Statistics: Which Side Are You On? Perspectives on Psychological Science 6(3) 274–290 DOI: 10.1177/1745691611406920 Field, A. (2009). Discovering statistics using SPSS. London: Sage. Fisher, R. A. (1925). Statistical methods for research workers. Edinburgh: Oliver and Boyd. Hidi, S. & Renninger, K. A. (2006). The four-phase model of interest development. Educational Psychologist, 41, 111-127. Hoijtink, H. (2012). Informative hypotheses: Theory and practice for behavioral and social scientists. London: CRC Press. Kass, R. E., & Raftery, A. E. (1995). Bayes factors. Journal of the American Statistical Association, 90, 773-795. Klugkist, I. & Mulder, J. (2008). Bayesian estimation for inequality constrained analysis of variance. In H. Hoijtink, I. Klugkist, & P. A. Boelen (Eds.), Bayesian evaluation of informative hypotheses (pp. 27-52). New York: Springer. Jeffreys, H. (1939, 1998). Theory of probability. 3rd Ed. Oxford: Oxford University Press. Klugvist, I. (2008). Encompassing prior based model selection for inequality constrained analysis of variance. In H. Hoijtink, I. Klugkist, & P. A. Boelen (Eds.), Bayesian evaluation of informative hypotheses (pp.53-83). New York: Springer. Mulder, J., Hoijtink, H. & de Leeuw, C. (2012). BIEMS: A Fortran90 program for calculating Bayes factors for inequality and equality constrained models. Journal of Statistical Software, 46(2), 1-39. Mulder, J., Hoijtink, H., & Klugkist, I. (2010). Equality and inequality constrained multivariate linear models: Objective model selection using constrained posterior priors. Journal of Statistical Planning and Inference, 140, 887-906. Mulder, J. Klugkist, I., van de Schoot, R., Meeus, W., Selfhout, M., and Hoijtink, H. (2009). Bayesian model selection of informative hypotheses for repeated measurements. Journal of Mathematical Psychology, 53, 530-546.
  • 13. 14 A Bayesian alternative to null hypothesis testing Shiken Research Bulletin 16(1). May 2012. Stevens, J. W. (2009). What is Bayesian statistics? Retrieved from http://www.medicine.ox.ac.uk/bandolier/painres/download/whatis/What_is_Bay_stats.pdf Wagenmakers, E. (2007). A practical solution to the pervasive problems of p values. Psychonomic Bulletin & Review, 14(5), 779-804. Wessa, P. (2008). Random number generator for the normal distribution (v1.0.8). Free Statistics Software (v1.1.23-r7), Office for Research Development and Education. Retrieved from http://www.wessa.net/rwasp_rngnorm.wasp/ Yudkowsky, E. S. (2003). An intuitive explanation of Bayes’ theorem. Retrieved from http://yudkowsky.net/rational/bayes