14_H00141747_Doula Isham_B30UC_Power System Transient Stability_Poster_2015-16
1. POWER SYSTEM STABILITY – TRANSIENT STABILITY STUDIES – Application of 3 - ∅ faults
Prepared by – Doula Isham Rashik, Mentor – Dr. Mounif Abdallah
ELECTRICAL AND ELECTRONICS ENGINEERING, HERIOT WATT UNIVERSITY DUBAI CAMPUS
• Study and analyze transient stability for one-machine and
multi-machine systems using appropriate techniques.
• Perform manual computations for one machine system.
• Develop MATLAB program for one machine system.
• Develop MATLAB program for IEEE 14 Bus system.
• Programs finally to be interfaced with GUI.
DESIGN, MODELLING AND METHODOLOGY
“Transient Stability” is one of the critical issues in power
systems which poses major challenge to power engineers. It
is the stability concerns maintaining synchronism of the
generators when subject to severe disturbance. 3 - ∅ fault is
the most severe disturbance among all. Hence transient
stability analysis for application of 3 - ∅ fault for one and
multi – machine systems is chosen as final year EEE project.
TEST SYSTEMS
• For one machine system, Equal Area Criterion or EAC
technique will be applied to find critical clearing angle.
• For 14 Bus system, to obtain load flow solution, Newton –
Raphson method will be used. To solve swing equations
powerful Runge – Kutta technique will be used and
critical clearing time will be obtained.
MATLAB programs will be developed followed by transforming
them into set of GUI tools using MATLAB GUIDE based on the
mentioned techniques.
∅
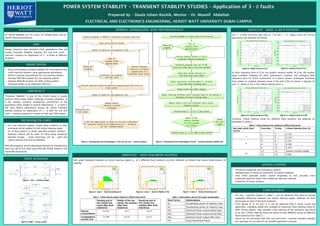
Figure 3: Development and methodology of EAC tool for one – machine system
EAC graph obtained followed by critical clearing angles 𝛿𝑐𝑟 at 3 different fault locations via both methods as follows that allows determination of
stability.
Figure 5: Case 1 - Fault at Sending end Figure 6: Case 2 – Fault at Middle of line Figure 7: Case 3 – Fault at Receiving end
Sending end of
line (faulty line
intact after fault
clearance)
Middle of the line
(faulty line isolated
after fault
clearance)
Receiving end of
line (faulty line
isolated after fault
clearance)
Manual
Computations
72.3320
49.10
44.210
Computations
via EAC tool
72.3380
49.160
44.210
Table 1: Critical clearing angles obtained at different fault points
Figure 1: One – machine system
Figure 2: IEEE – 14 Bus system
∅
Figure 4: Development and methodology of multi – machine transient stability tool
For 3 - ∅ fault occurring near bus no. 7 at line 7 – 9, swing curves for PV bus
generators are obtained as follows.
At fault clearance time of 0.3s, the system remains stable. At 0.4s, the system
goes unstable. Keeping all other parameters constant and changing fault
clearance time for 0.01s increments, it is found system undergoes transition
from stable to unstable between times 0.35s and 0.36s as shown in figures 10
and 11. Hence 0.35s is the critical clearing time 𝑡 𝑐𝑟.
Similarly, critical clearing times for different fault locations are obtained as
tabulated in table 3.
Bus near which fault
occurs
From Bus To Bus Critical clearing time (s)
1
1 2 0.125
1 5 0.119
6
5 6 0.371
6 11 0.395
6 13 0.397
13
12 13 System remains stable
13 14 0.561
Table 3: Critical clearing times obtained at different fault points
Dr. Mounif Abdallah, Dr. P.K. Soori, Dr. Mutasim Nour and Dr.
Senthil Muthukumarswamy
Figure 8: Swing curves at 0.3s Figure 9: Swing curves at 0.4s
• Preventive measures and emergency actions.
• Establishment of relays for automatic re-closure breakers.
• Train fresh graduate power system engineers as GUI provides more
interactive features rather than traditional learning methods.
• Expansion of power systems.
• For one – machine system in table 1, can be observed that there is almost
negligible difference between the critical clearing angles obtained via both
techniques at each of the fault locations.
• From figures 8, 9, 10 and 11 it can be observed that 4 swing curves are
generated, indicating stable and unstable for particular fault clearing times for
IEEE 14 Bus system. Also reduced y-bus matrices at all conditions was found
to be 5x5. Critical clearing times are found to have different values at different
fault locations from table 3.
• Hence can be concluded both EAC tool and multi - machine transient stability
tool package can be used for its suitable application purpose.
TECHNIQUES USED
OBJECTIVES
ACKNOWLEDGMENTS
ABSTRACT
RESULTS – ONE MACHINE SYSTEM
RESULTS – IEEE 14 BUS SYSTEM
APPLICATIONS
CONCLUSION
Design Graphical User Interface (GUI) applications that will
enable Transient Stability Analysis for one and multi –
machine systems for Application of 3 - ∅ faults at different
locations.
AIM
Short forms Abbreviations
A1 Accelerating power of rotating mass
A2 Decelerating power of rotating mass
Pe1 Electrical Power output before fault
Pe2 Electrical Power output during fault
Pe3 Electrical Power output after fault
Pm Input Mechanical Power
Table 2: Abbreviations used for EAC graph representation
Figure 10: Swing curves at 0.35s Figure 11: Swing curves at 0.36s