A Measurement Device for an Air Conditioning Unit
•
0 likes•519 views

Design and production of a measurement device; which measures temperature, pressure and flow rate inside of an air conditioning unit.

Recommended
Recommended
More Related Content
What's hot
What's hot (20)
Viewers also liked
Similar to A Measurement Device for an Air Conditioning Unit
Similar to A Measurement Device for an Air Conditioning Unit (20)
Recently uploaded
Recently uploaded (20)
A Measurement Device for an Air Conditioning Unit
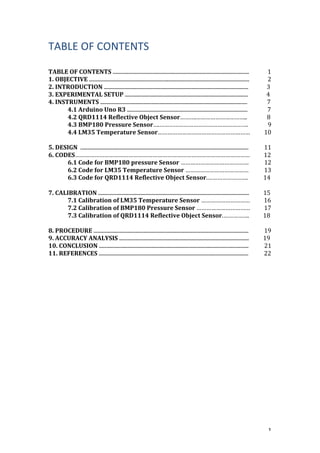
- 1. 1 TABLE OF CONTENTS TABLE OF CONTENTS ....................................................................................................... 1 1. OBJECTIVE ......................................................................................................................... 2 2. INTRODUCTION ............................................................................................................. 3 3. EXPERIMENTAL SETUP ............................................................................................. 4 4. INSTRUMENTS ............................................................................................................... 7 4.1 Arduino Uno R3 ........................................................................................... 7 4.2 QRD1114 Reflective Object Sensor……….………………………….. 8 4.3 BMP180 Pressure Sensor….………………………………………………. 9 4.4 LM35 Temperature Sensor………………………………………………… 10 5. DESIGN ............................................................................................................................... 11 6. CODES……………………………………………………………………………………………… 12 6.1 Code for BMP180 pressure Sensor …………………………………… 12 6.2 Code for LM35 Temperature Sensor ………………………………… 13 6.3 Code for QRD1114 Reflective Object Sensor.……………………. 14 7. CALIBRATION .................................................................................................................. 15 7.1 Calibration of LM35 Temperature Sensor ………………………… 16 7.2 Calibration of BMP180 Pressure Sensor …………………………… 17 7.3 Calibration of QRD1114 Reflective Object Sensor.……………. 18 8. PROCEDURE ..................................................................................................................... 19 9. ACCURACY ANALYSIS .................................................................................................. 19 10. CONCLUSION ................................................................................................................. 21 11. REFERENCES ................................................................................................................. 22
- 2. 2 1. OBJECTIVE The main objective of this experiment is to measure the temperature, pressure, velocity and mass flow rate of the air in an air conditioning unit. To do this, the measurement sensors that recognize the changes in system and provide output are used. The other aim is to analyze the measured data in terms of averages, minimums and maximums, etc. Lastly it is purposed that the uncertainty analysis.
- 3. 3 2. INTRODUCTION For this project, different sensors are used for temperature, flow rate and pressure measurements. QRD1114 reflective object sensor is used to measure the flow rate. By using this sensor, rotation number of the propeller in an air conditioning unit is measured and converted in to mass flow rate by the formulas in the code. To make the propeller reflective the propeller is painted in to white. The other sensor used to measure temperature is LM35 precision centigrade temperature sensor. The sensor gives voltage output, which is linearly proportional to the temperature in centigrade. The pressure sensor that is chosen as BMP180 and the signal is received as a function of pressure to sensor. The sensor measures the barometric pressure. By using these sensors, the temperature, pressure and flow rate are measured for the project.
- 4. 4 3. EXPERIMENTAL SETUP Three type of sensors are used in this experiment LM35 Temperature Sensor, BMP180 Pressure Sensor & QRD1114 Reflective Sensor. Their wiring diagrams of these sensors are drawn in fritzing software and shown below. (Fig.1-‐2-‐3) Fig.1 Wiring diagram of LM35 Two LM35 are used in this system in order to measure the temperature difference between the back and front side of serpenter in the air conditioner unit. Lm35 has three legs, which are connected to 5V, Ground, A0 & A1 (two sensors, two outputs).
- 5. 5 Fig.2 Wiring diagram of QRD1114 QRD1114 reflective sensor is used in this system in order to measure the velocity and the mass flow rate of air in the system. This sensor uses 5v input. It has 4 legs and these legs are connected to 5V, Ground, A0 & A1 pins on the arduino.
- 6. 6 Fig.3 Wiring diagram of BMP180 BMP180 digital pressure sensor is used in this system in order to measure the pressure in front of the fan. This sensor uses 5v input. It has 4 holes, which are connected to 5V, Ground, A4, & A5 pins on the arduino.
- 7. 7 4. INSTRUMENTS 1. Arduino UNO R3 2. Breadboards (x 2) 3. Jumper Wires 4. QRD1114 5. BMP180 Pressure Sensor 6. LM35 Temperature Sensor (x 2) 7. A propeller with 12 cm diameter 8. Resistors (200 Ohm 5.6 kOhm) 1. Arduino UNO R3: Arduino Uno R3 is a board which is micro controlled by ATmega328. Arduino UNO has 6 analog output, 14 digital input and output pins. Moreover, for the connection it has a power jack and a USB connection. It has a 32 KB flash memory, ICSP header, and a reset button. It is really easy to use, everything is ready to use so to get started you only need to connect it to a computer with a USB cable or you can use a battery or an adapter to power it. Arduino Uno R3 is the latest product of the arduino series, which is faster than the previous versions. Fig.4 Arduino Uno R3
- 8. 8 2. QRD1114 Reflective Object Sensor QRD1114 is a device that consists of an IR Emitter and a phototransistor. It has a sensing distance up to 3cm. The phototransistor responds to radiation emitted from the diode when a reflective object passes by in front of the detector. In order to create a reflective surface, the propeller is painted into white color. Moreover, this sensor has a daylight filter so it distinguishes the reflected light. Fig.5 QRD1114 reflective object sensor This sensor is used to measure the wind speed in the air conditioner unit. When the propeller passes in front of this sensor, the sensor gives a voltage output. This voltage output is converted in to RPM by using the formula written in the code.
- 9. 9 3. BMP180 Pressure Sensor BMP180 is a digital pressure sensor based on piezoresistive technology. It measures temperature and barometric pressure. Moreover it consists of 3.3V regulator, pull-‐up resistors and I2C level shifter. This sensor measures pressure values between the range of 30000 to 110000 Pa. It has a pressure accuracy of +-‐ 200 Pa. Also, it has a temperature range of -‐40 to +85°C and temperature accuracy of +-‐2°C . This device could be used as a temperature sensor in the system but LM35 is preferred due to its better accuracy which is +-‐0.5 °C. Fig.6 BMP180 Pressure sensor
- 10. 10 4. LM35 Temperature Sensor LM35 is a temperature sensor, which gives voltage output that is linearly proportional to the temperature in Centigrade. (Better than sensors calibrated in Kelvin) It has an operating range of −55°C to +150°C and accuracy of ±0.5°C (at 25°C) Fig.7 LM35 temperature sensor and the functions of its legs. The image cannot be displayed. Your computer may not have enough memory to open the image, or the image may have been corrupted. Restart your computer, and then open the file again. If the red x still appears, you may have to delete the image and then insert it again.
- 11. 11 9. DESIGN The design and the size specification of the system can be seen below. (Fig.9-‐ 10) Fig.8 3D modeling of the design Fig.9 2D Technical drawing of the design
- 12. 12 10. CODES 1. Code for BMP180 pressure sensor #include "Wire.h" #include "Adafruit_BMP085.h" Adafruit_BMP085 mySensor; float maxi=0; float mini=999999999; float avgp=0; //sets the initial average to 0 float tempC; float pressure; float i=0; //sets the counter value to 0 void setup(){ Serial.begin(9600); mySensor.begin(); } void loop() { pressure=mySensor.readPressure(); if(pressure > maxi) {maxi = pressure;} // set max temperature if(pressure < mini) {mini = pressure;} // set min temperature if(pressure >16.0) ; i=i+1; avgp=avgp+pressure; //adds the new pressure into the average Serial.println("t"); Serial.print("Average Pressure: "); Serial.print(avgp/i); Serial.print("t"); Serial.print("Max Pressure: "); //prints max,min, average pressure Serial.print(maxi); Serial.print("t"); Serial.print("t"); Serial.print("Min Pressure: "); Serial.print(mini); Serial.print("t"); Serial.println("t"); delay(800); //the outputs are shown with a delay }
- 13. 13 2. Code for LM35 temperature sensor float maxi=0,mini=100; //sets the initial maximum and minimum float i=0; //sets the counter value to 0 float avgt=0; //sets the initial average to 0 void setup() { Serial.begin(9600); } void loop() { int rawvoltage= analogRead(A1); //gets the voltage output from A1 float millivolts= (rawvoltage/1024.0) * 5000; //converts the output into milivolts float T1= (millivolts/10)-‐0.45; //converts the millivolts into celcius int rawvoltage2= analogRead(A2); float millivolts2= (rawvoltage2/1024.0) * 5000; float T2= (millivolts2/10)+1.51; i=i+1; avgt=avgt+T1-‐T2; //adds the new temp. difference into the average if(abs(T1-‐T2) > maxi) {maxi = T1-‐T2;} // sets max. temp. difference if(abs(T1-‐T2) < mini) {mini = T1-‐T2;} // sets min. temp. difference if(abs(T1-‐T2) >16.0) Serial.println("t"); Serial.print("T1: "); Serial.print(T1); Serial.print("t"); Serial.print("T2: "); Serial.print(T2); Serial.print("t"); Serial.print("T1-‐T2: "); Serial.print(abs(T1-‐T2)); //prints max,min, average temp. difference Serial.print("t"); Serial.print("MAX: "); Serial.print(abs(maxi)); Serial.print("t"); Serial.print("MIN: "); Serial.print(abs(mini)); Serial.print("t"); Serial.print("AVG: "); Serial.print(avgt/i); //devides the sum to number of data Serial.println("t"); delay(500); //the outputs are shown with a delay }
- 14. 14 3. Code for QRD1114 reflective object sensor float avgf=0; //sets the initial flowrate average to 0 float i=0; //sets the counter value to 0 float avgrpm=0; //sets the initial rpm average to 0 float maxiFlow=0; float miniFlow=999999999; //sets the initial maximum and minimum flowrate void setup() { Serial.begin(9600); } void loop() { float rpm=((30*1000)/(1000000/pulseIn(A0,LOW,100000000))); //converts the voltage output in to rpm float velocity; velocity=-‐0.0655*rpm+8.2929; //converts the rpm into velocity float flowrate; flowrate=1.184*(velocity*0.290*0.290); //converts the velocity in to flowrate i=i+1; avgrpm=avgrpm+rpm; //adds the new rpm and flowrate data into average avgf=avgf+flowrate; if(abs(flowrate) > maxiFlow) {maxiFlow = flowrate;} // sets max if(abs(flowrate) < miniFlow) {miniFlow = flowrate;} // sets min if(abs(flowrate) >0) ; Serial.println("t"); Serial.print(" Velocity(m/s) : "); Serial.print(velocity,4); Serial.print("t"); Serial.print(" Flowrate(m3/s) : "); Serial.print(flowrate,4); Serial.print("t"); Serial.print(" AVG Flowrate : "); //prints max,min, average flowrate and velocity Serial.print(avgf/i,4); Serial.print("t"); Serial.print(" MAX Flowrate : "); Serial.print(maxiFlow,4); Serial.print("t"); Serial.print(" MIN Flowrate : "); Serial.print(miniFlow,4); Serial.println("t"); delay(800); //the outputs are shown with a delay }
- 15. 15 11. CALIBRATION: At first the sensors weren’t giving the desired results so these sensors are calibrated in different ways. 1. Calibration of LM35 temperature sensor In order to calibrate these sensors we used a kettle device which we know that it shuts itself off at 100 °C. The sensors put in the hot water with a thin plastic bag incase of the water damage the sensor. When the kettle blinks and shuts itself off, the output temperature value is investigated if it shows 100 °C or not. One of the LM35 was showing 98.45 °C while the other was 97.10 °C. To calibrate these values the conversion formulas are edited with the necessary operations (sum, extraction). The measurements are checked again after the calibration and the sensors started to Show the same value with a +-‐0.5 °C uncertainty. Fig.10 Calibration of LM35
- 16. 16 2. Calibration of BMP180 pressure sensor: In order to calibrate BMP180 pressure sensor, first the current altitude is learned by the Internet. After that the atmospheric pressure for this altitude is learned. Our device is turned on and the measurements are compared with that atmospheric pressure value. Calibration is finished by applying the necessary operations on the conversation formulas in the code. Fig.11 Atmospheric pressure at Yeditepe University
- 17. 17 3. Calibration of QRD1114 reflective sensor In order to calibrate QRD1114 and obtain the rpm to velocity formula. It is put in a wind tunnel device. In this wind tunnel, a pressure difference sensor, which helps us to calculate the actual air velocity in the tunnel, is placed also. The wind tunnel is turned on for different frequency values. The velocity calculated by the pressure difference sensor and the rpm value shown by our device are saved in to an excel file. The data are plotted and curve fitting is applied to obtain an equation. The equation is found as “Velocity=-‐0.0653*RPM+8.2886”. The equation is put into the code and velocity values are started to calculate by the rpm values. Fig.12 Calibration of QRD1114 in a wind tunnel
- 18. 18 12. PROCEDURE 1. Connect the sensors to the required 5V, Ground and the analog output pins. 2. Power the device with the computer by using the USB output of the arduino. 3. Put the device in front of the fan and put the LM35 cables back and front of the serpenter. 4. Upload the code to the device. 5. Turn on the air conditioning unit. 6. Apply different magnitudes of frequencies in order to observe the changes in flow rate, pressure and temperature.
- 19. 19 7. ACCURACY ANALYSIS Standard deviation formula: ! ! (𝑥! ! !!! − (𝑀𝑒𝑎𝑛)) Uncertainty formula: ! ! (𝑥! ! !!! − (𝑀𝑒𝑎𝑛)) 1. Velocity Calculations: The experiment was done at 8.27535255 m/s. 46 data is taken and calculated average, max min velocities, and it’s differences also standard deviation Velocity Average Velocity Max value Velocity Min value Max difference Minimum difference St deviation 8.27535255 8.27666255 8.27404255 0.00131 0.00131 0.000567247 If the standard deviation is divided by square root of number of data, it is equal to 8.364x10-‐5 and for our device the velocity is equal to 8.27535255±8.364x10-‐5 Fig. 13 Velocity vs. data If we think about Reynolds number: 𝑅𝑒 = 𝜌𝑑𝑣 𝜇 The uncertainty of the Reynolds number can be expressed as; ∆𝑅𝑒 = ( 𝜕𝑅𝑒 𝜕𝜌 ∆𝜌)! + ( 𝜕𝑅𝑒 𝜕𝑣 ∆𝑣)! + ( 𝜕𝑅𝑒 𝜕𝑑 ∆𝑑)! + ( 𝜕𝑅𝑒 𝜕𝜇 ∆𝜇)! y = -‐7E-‐06x + 8.2755 8.2735 8.274 8.2745 8.275 8.2755 8.276 8.2765 8.277 0 10 20 30 40 50 Velocity vs Data Velocity vs Data Linear (Velocity vs Data)
- 20. 20 ρ( kg/m3 ) v(m/s) D(m) μ (kg/s.m) 1.205±0.008% 8.27535255±8.364x10-‐ 5 0.29±0.0005 1.822x10-‐5 ±0.05% We found Reynolds number as 177774 and its uncertainty as 4996 so we can express Reynolds number as 177774±4996. 2. Temperature Uncertainty The experiment was done at 22.5 °C. 49 data is taken and calculated average, max, min temperatures, and standard deviation. TRUE Temp Value Our Temp Value(C) Temp max Temp min St. Deviation 22.5 22.28 22.5 22.01 0.243721152 If the standard deviation is divided by square root of number of data, it is equal to 3.481x10-‐2 and for our device the temperature can be expressed as 22.28±3.481x10-‐2
- 21. 21 8. CONCLUSION: To sum up, in our design project our aims were, measuring the flow rate, measuring the pressure and measuring the temperature difference between two stage of the air condition unit. When we started to design it, firstly we get a data acquisition card and some temperatures and pressure sensors, also after a while we decided to use an optical detector to get rpm values. When we finished our design we covered it with a box to avoid cable mess. Moreover, we calibrated all of the sensors and made the sensors working properly. After using this device, we have observed that the system is working properly and we can say that this device can be used at heat and ventilating systems with good accuracy and precision.
- 22. 22 9. REFERENCES 1. http://maelabs.ucsd.edu/mae171/watdocs/Reynolds%20experiment.ht m 2. https://www.wmo.int/pages/prog/gcos/documents/gruanmanuals/UK_ NPL/mgpg11.pdf 3. http://www.wikihow.com/Calculate-‐Uncertainty