Download to read offline
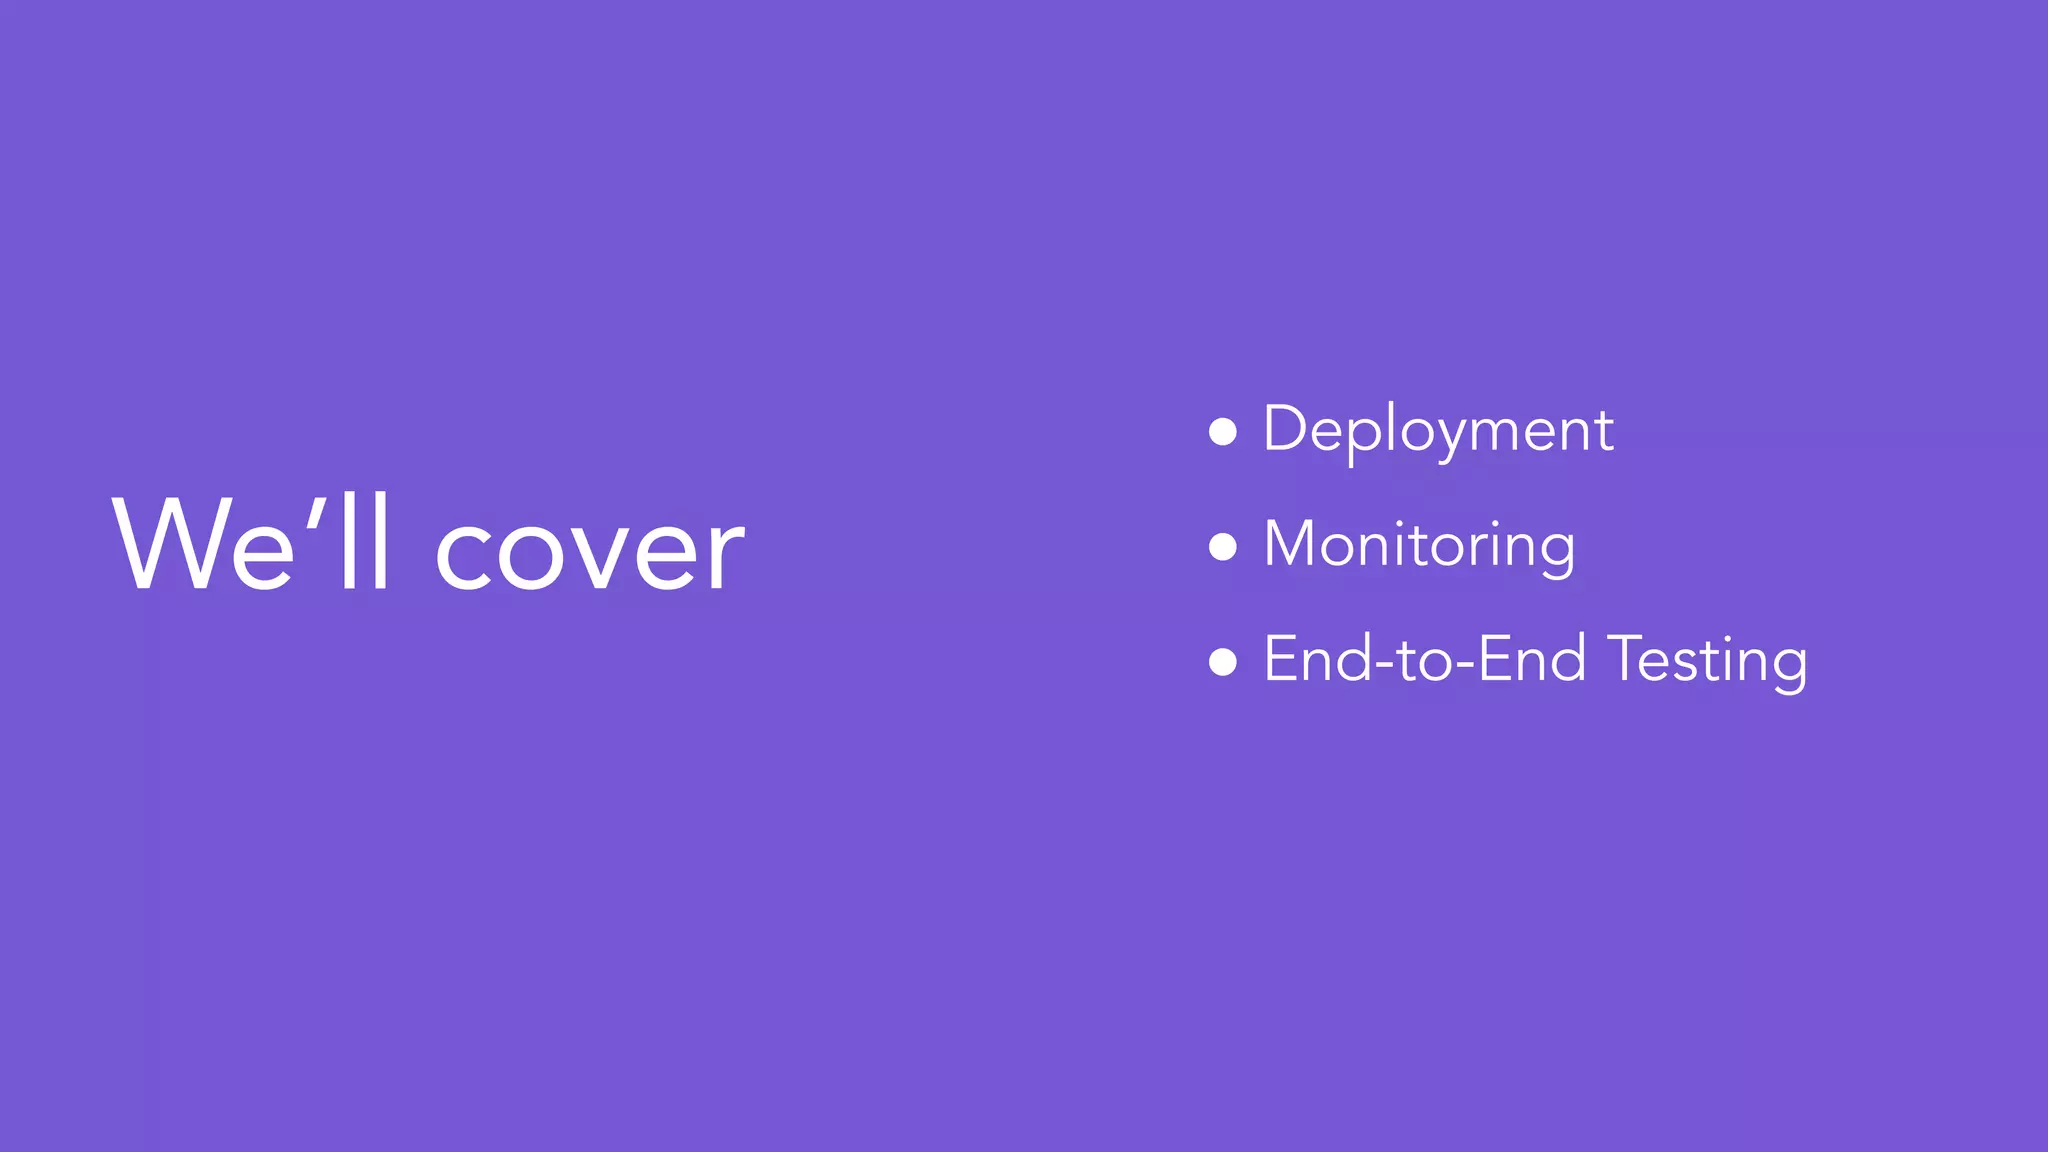


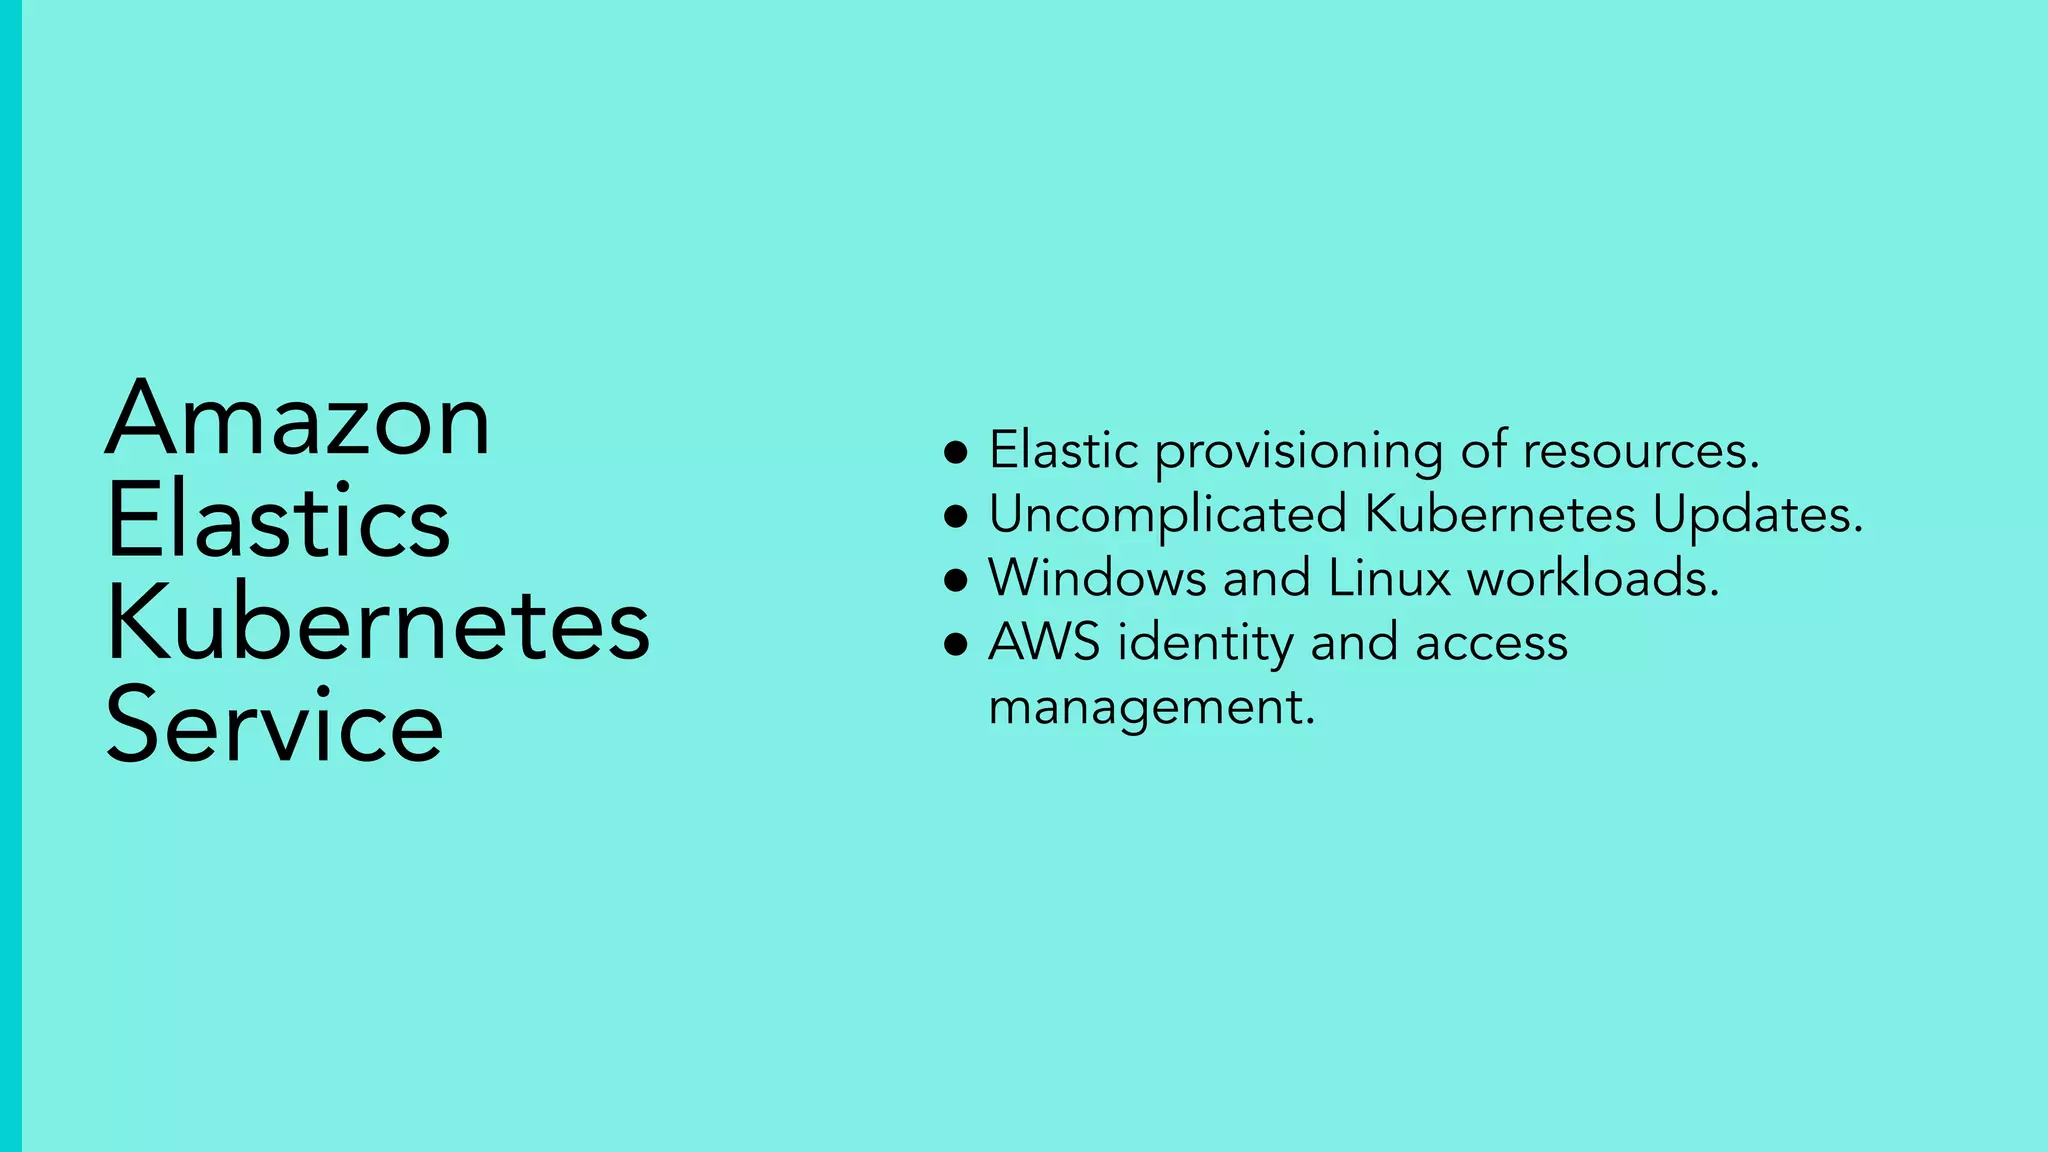
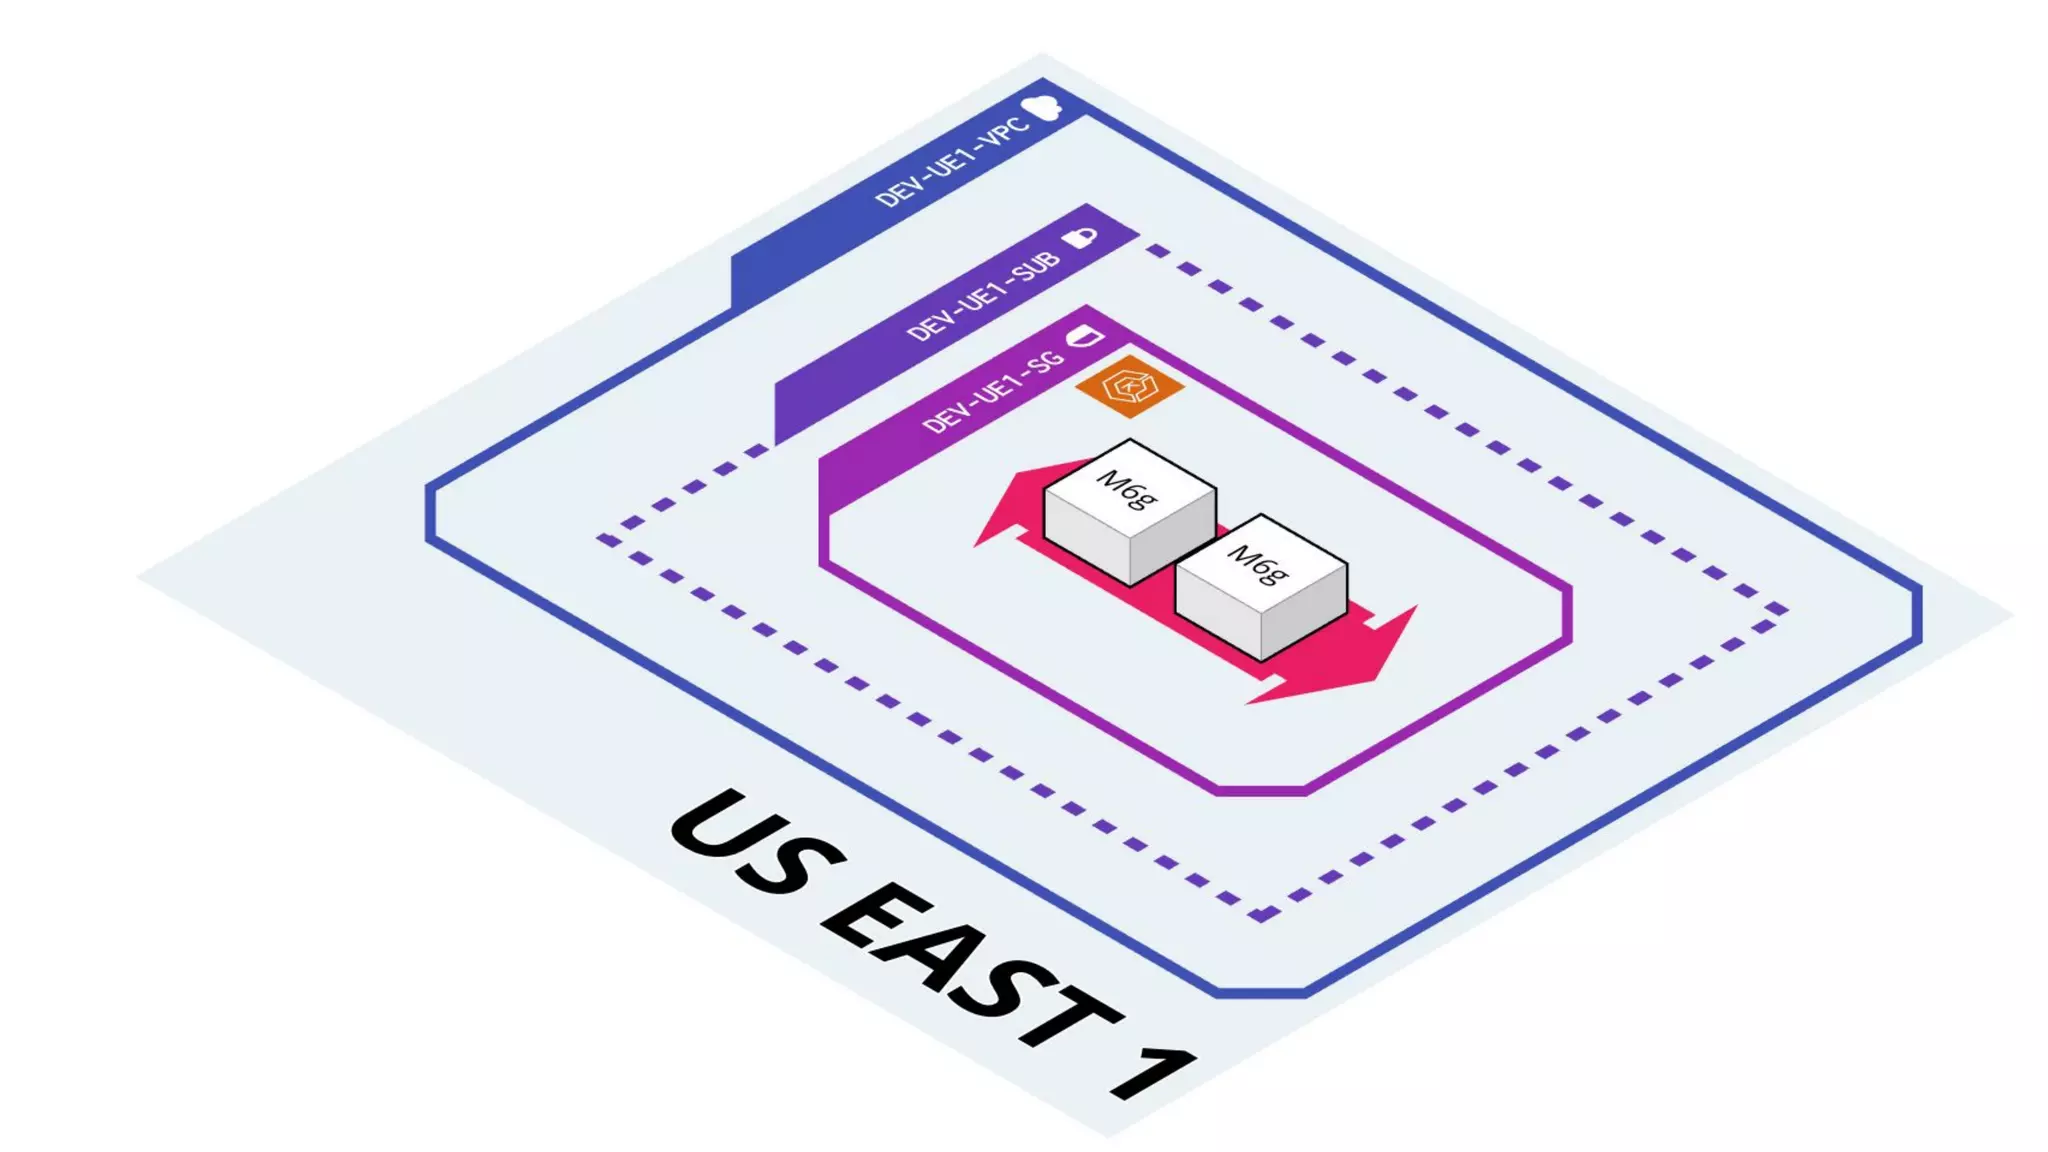


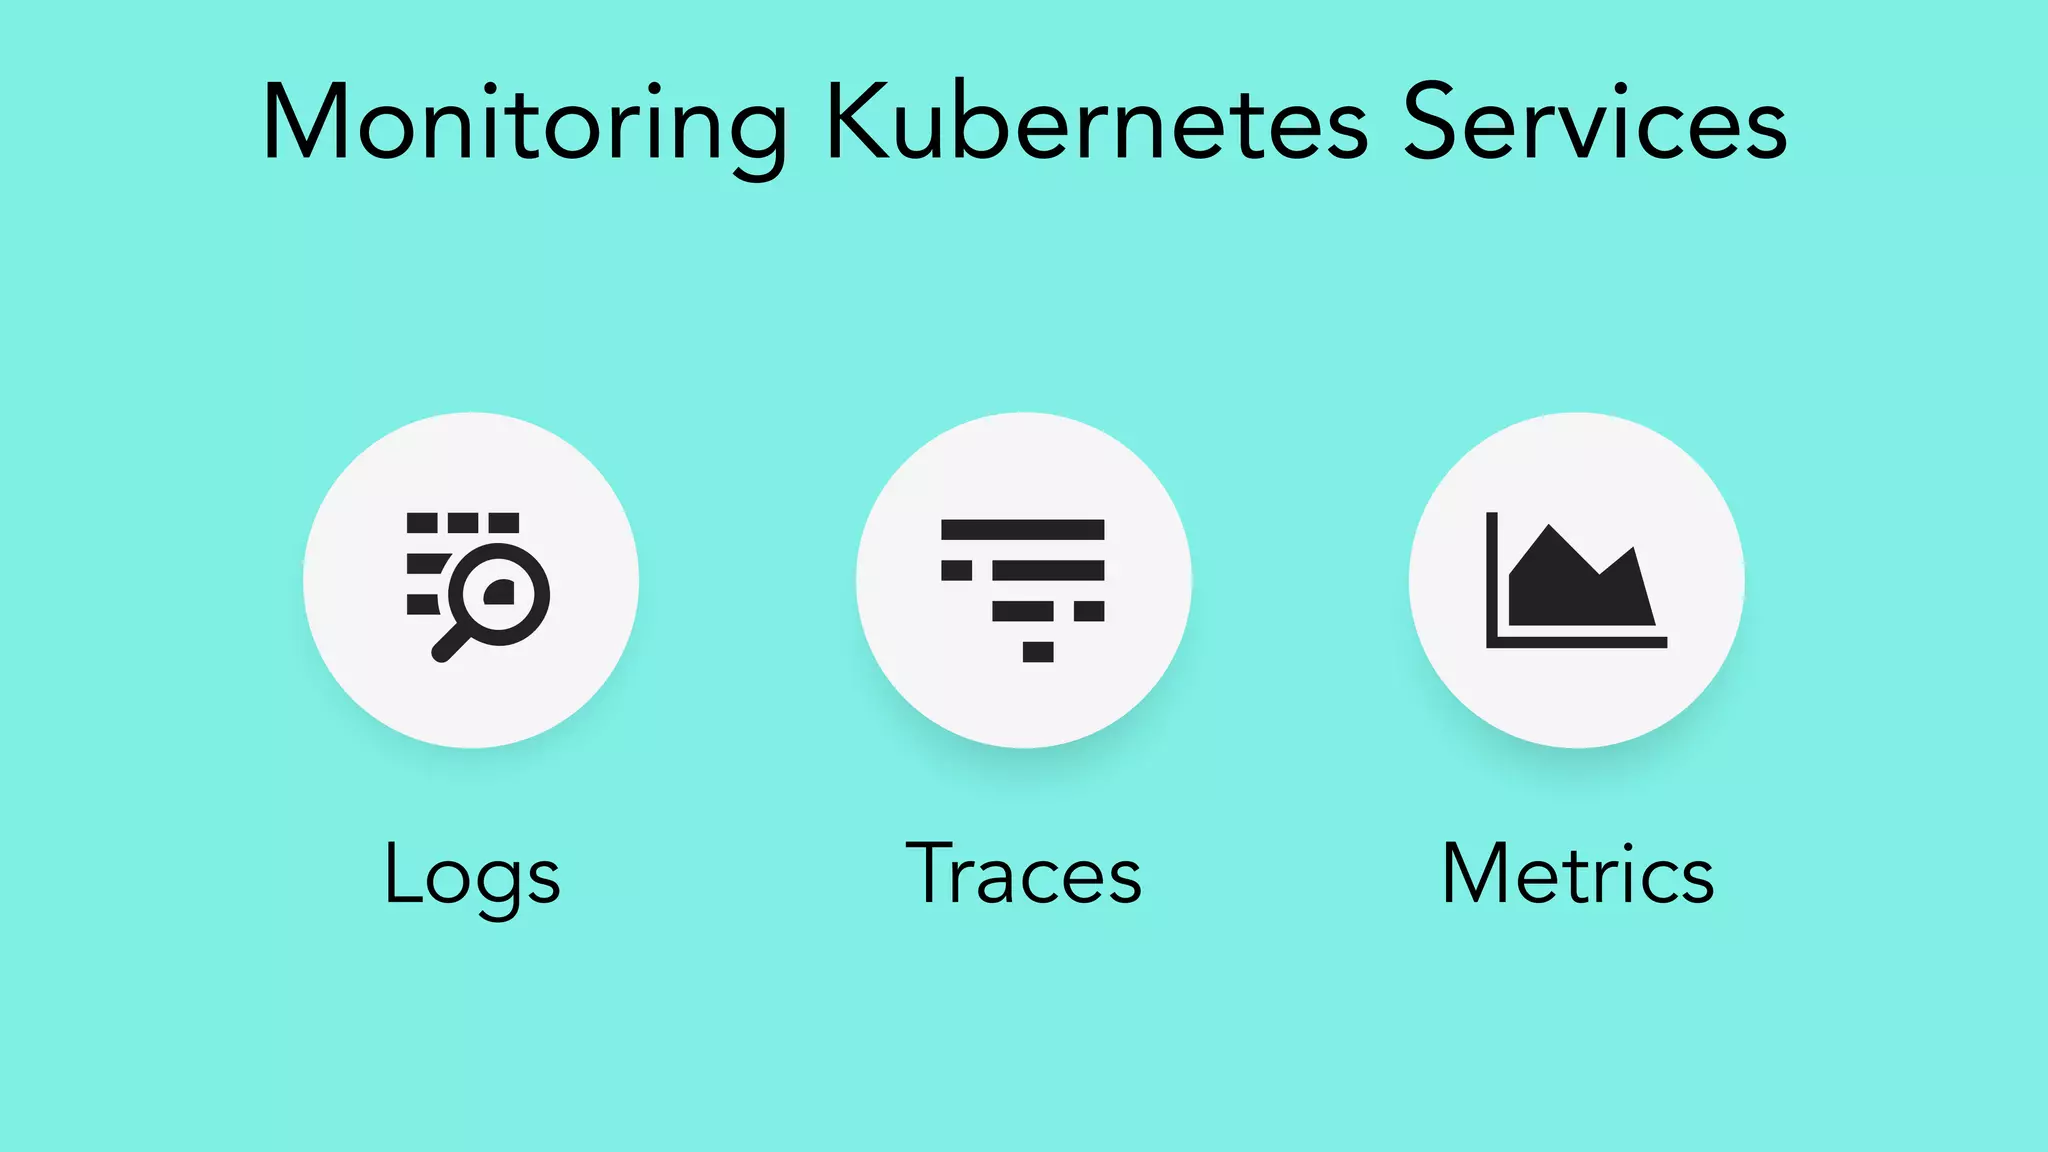
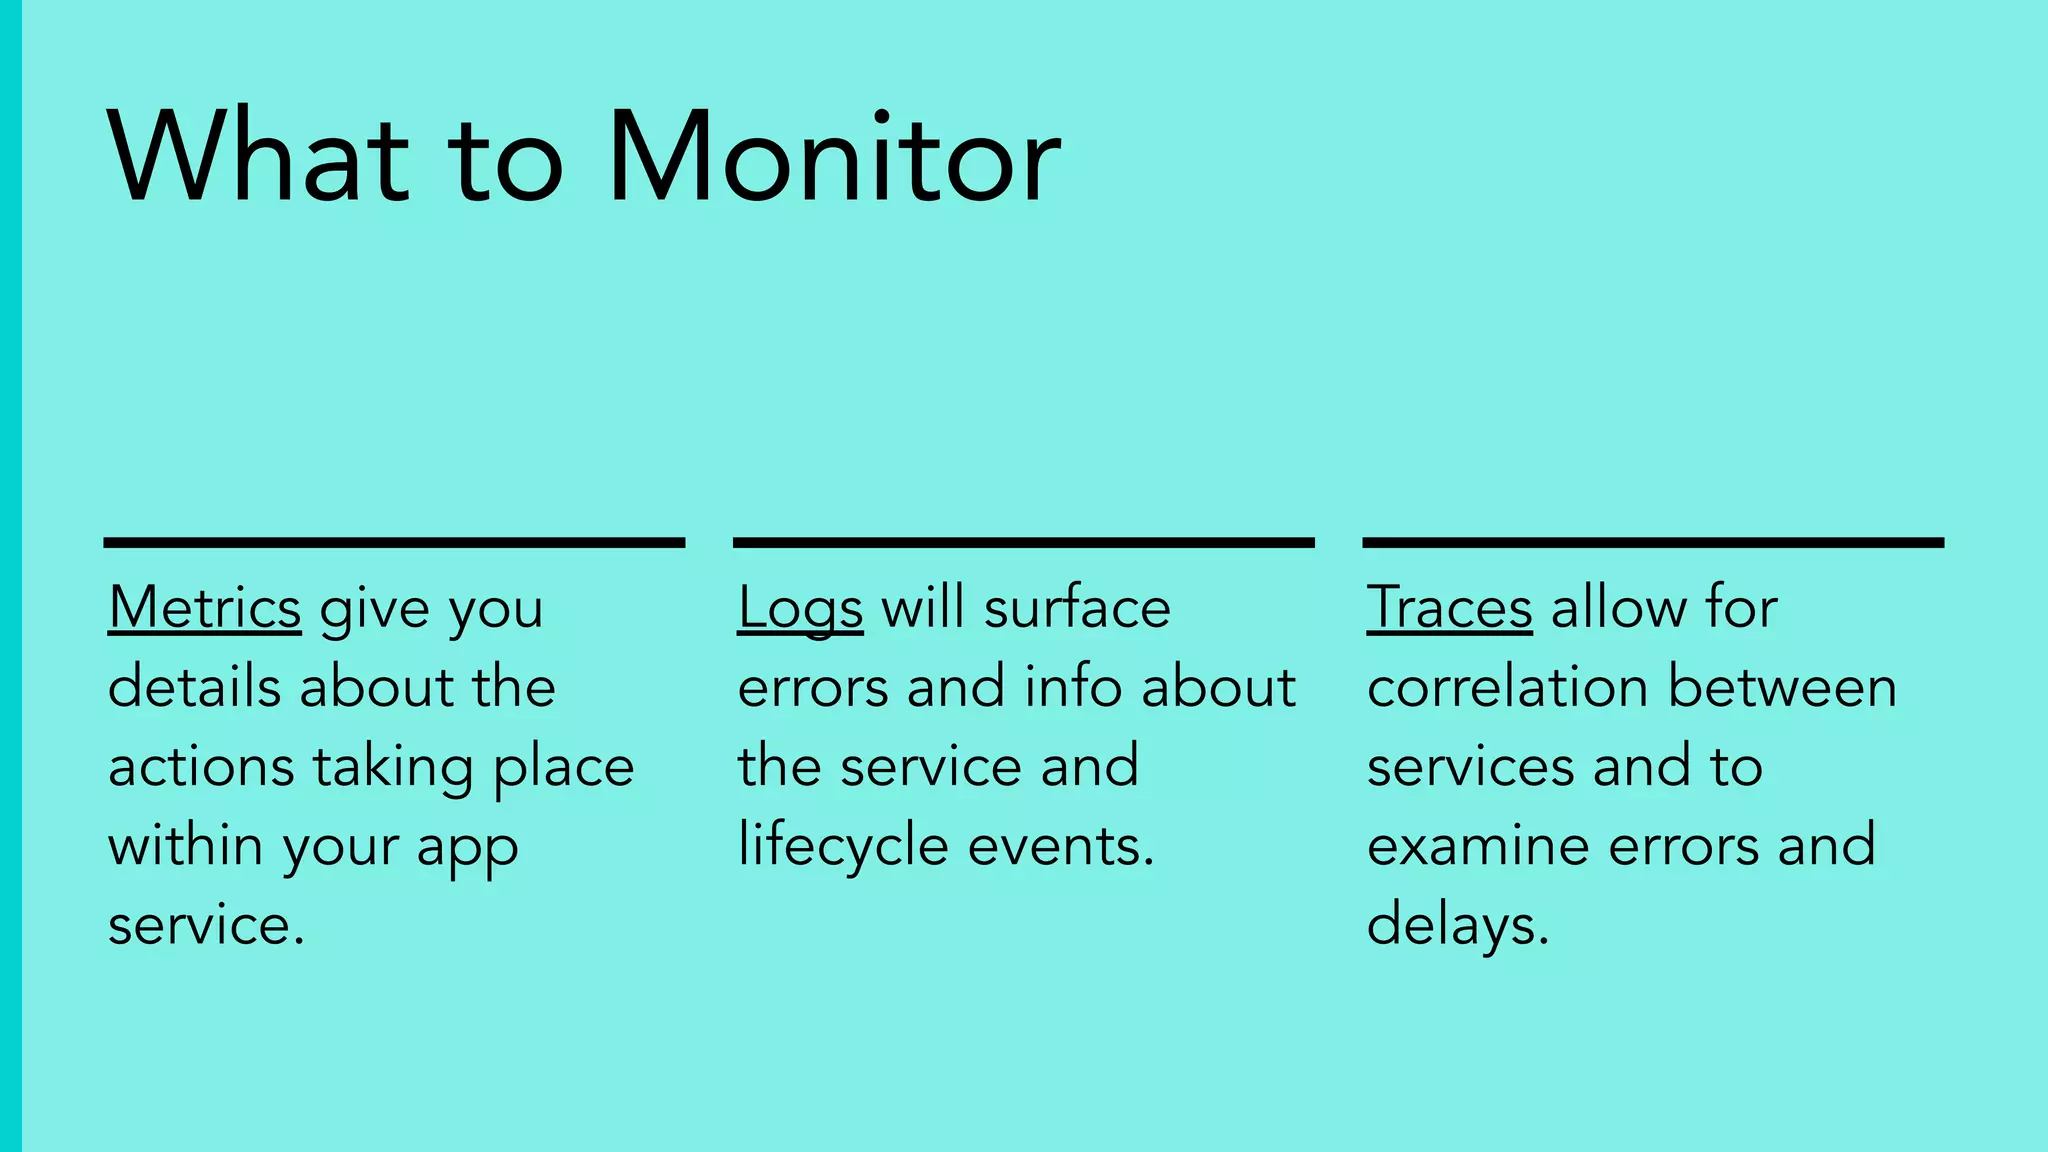

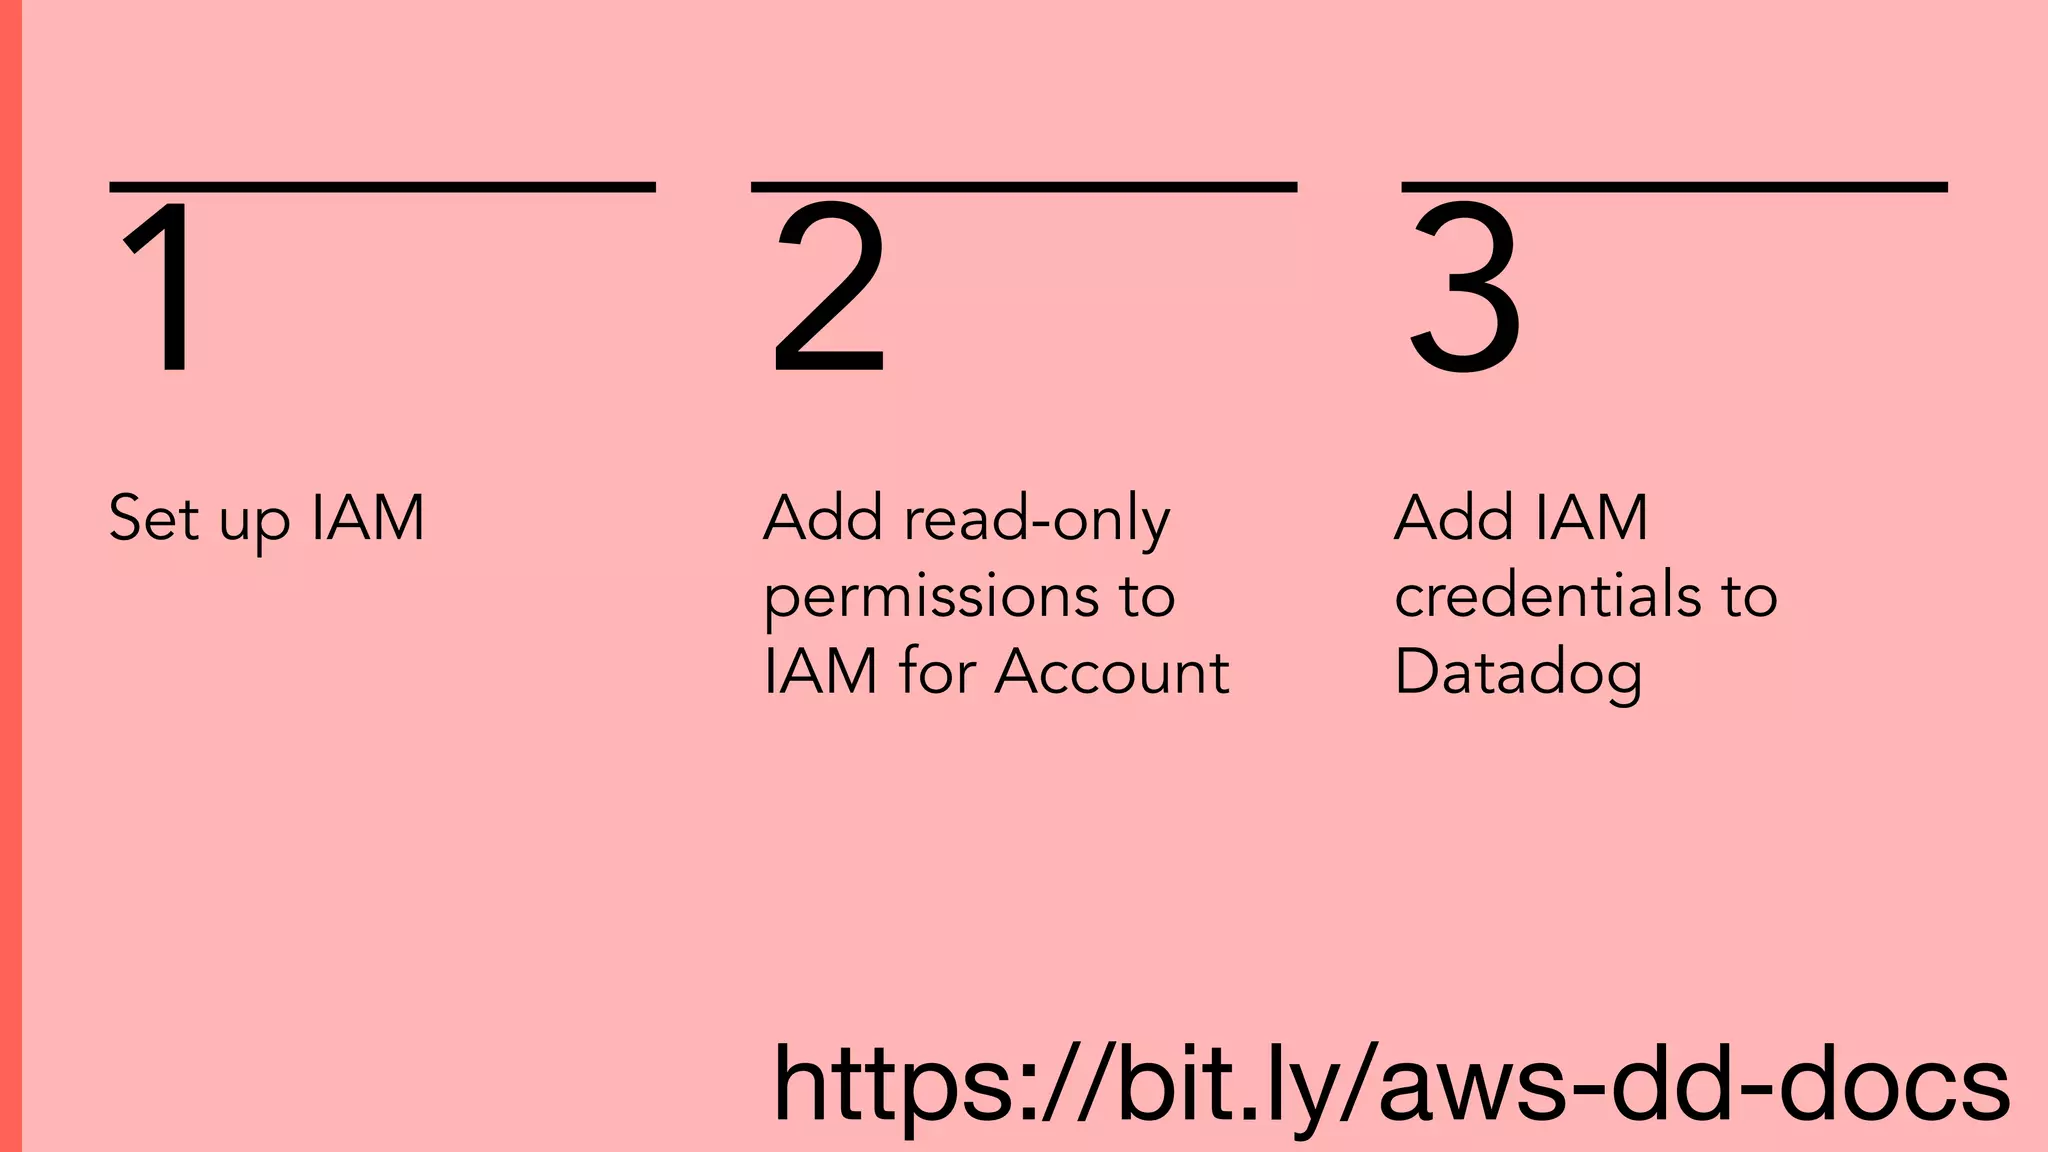
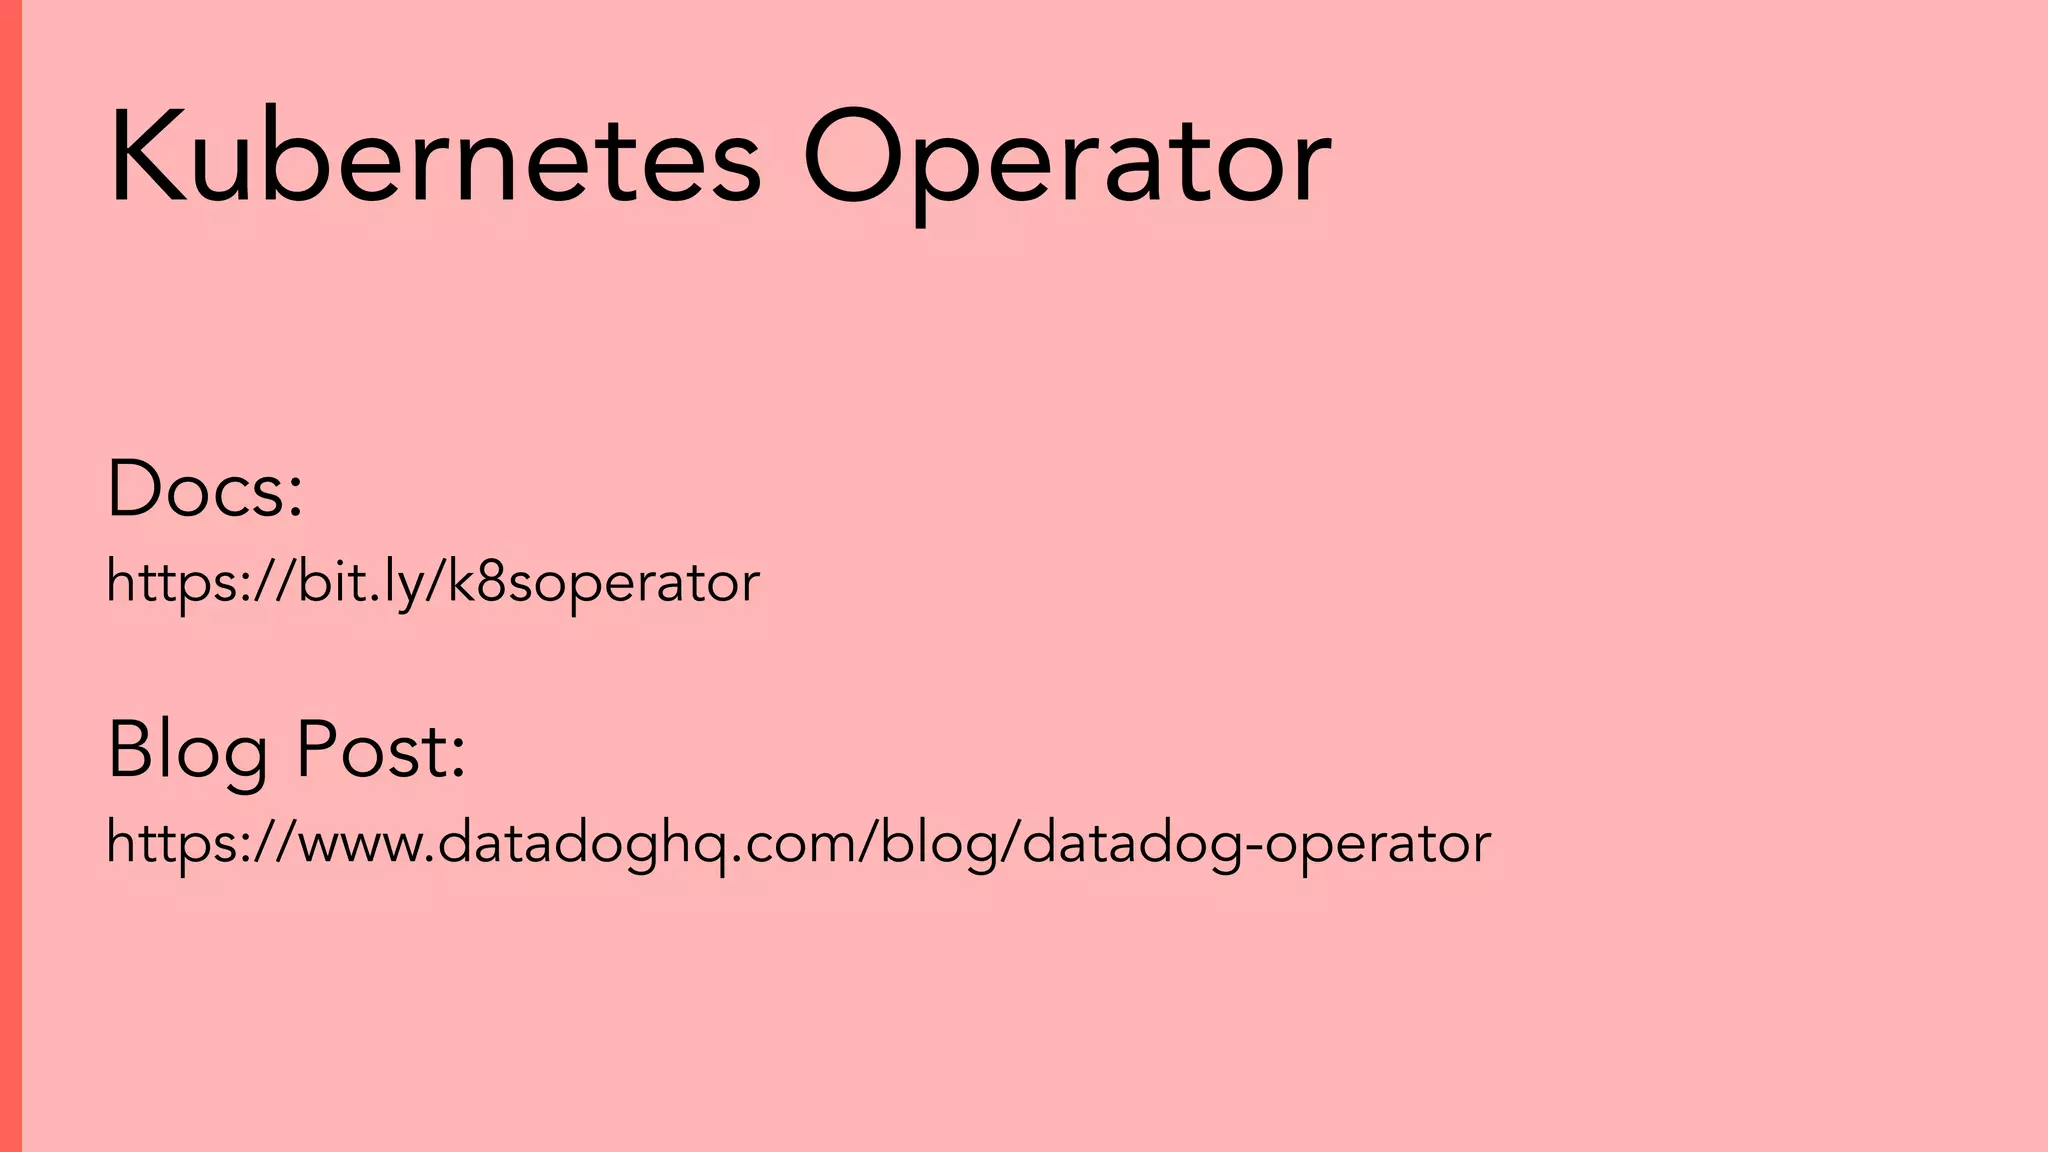
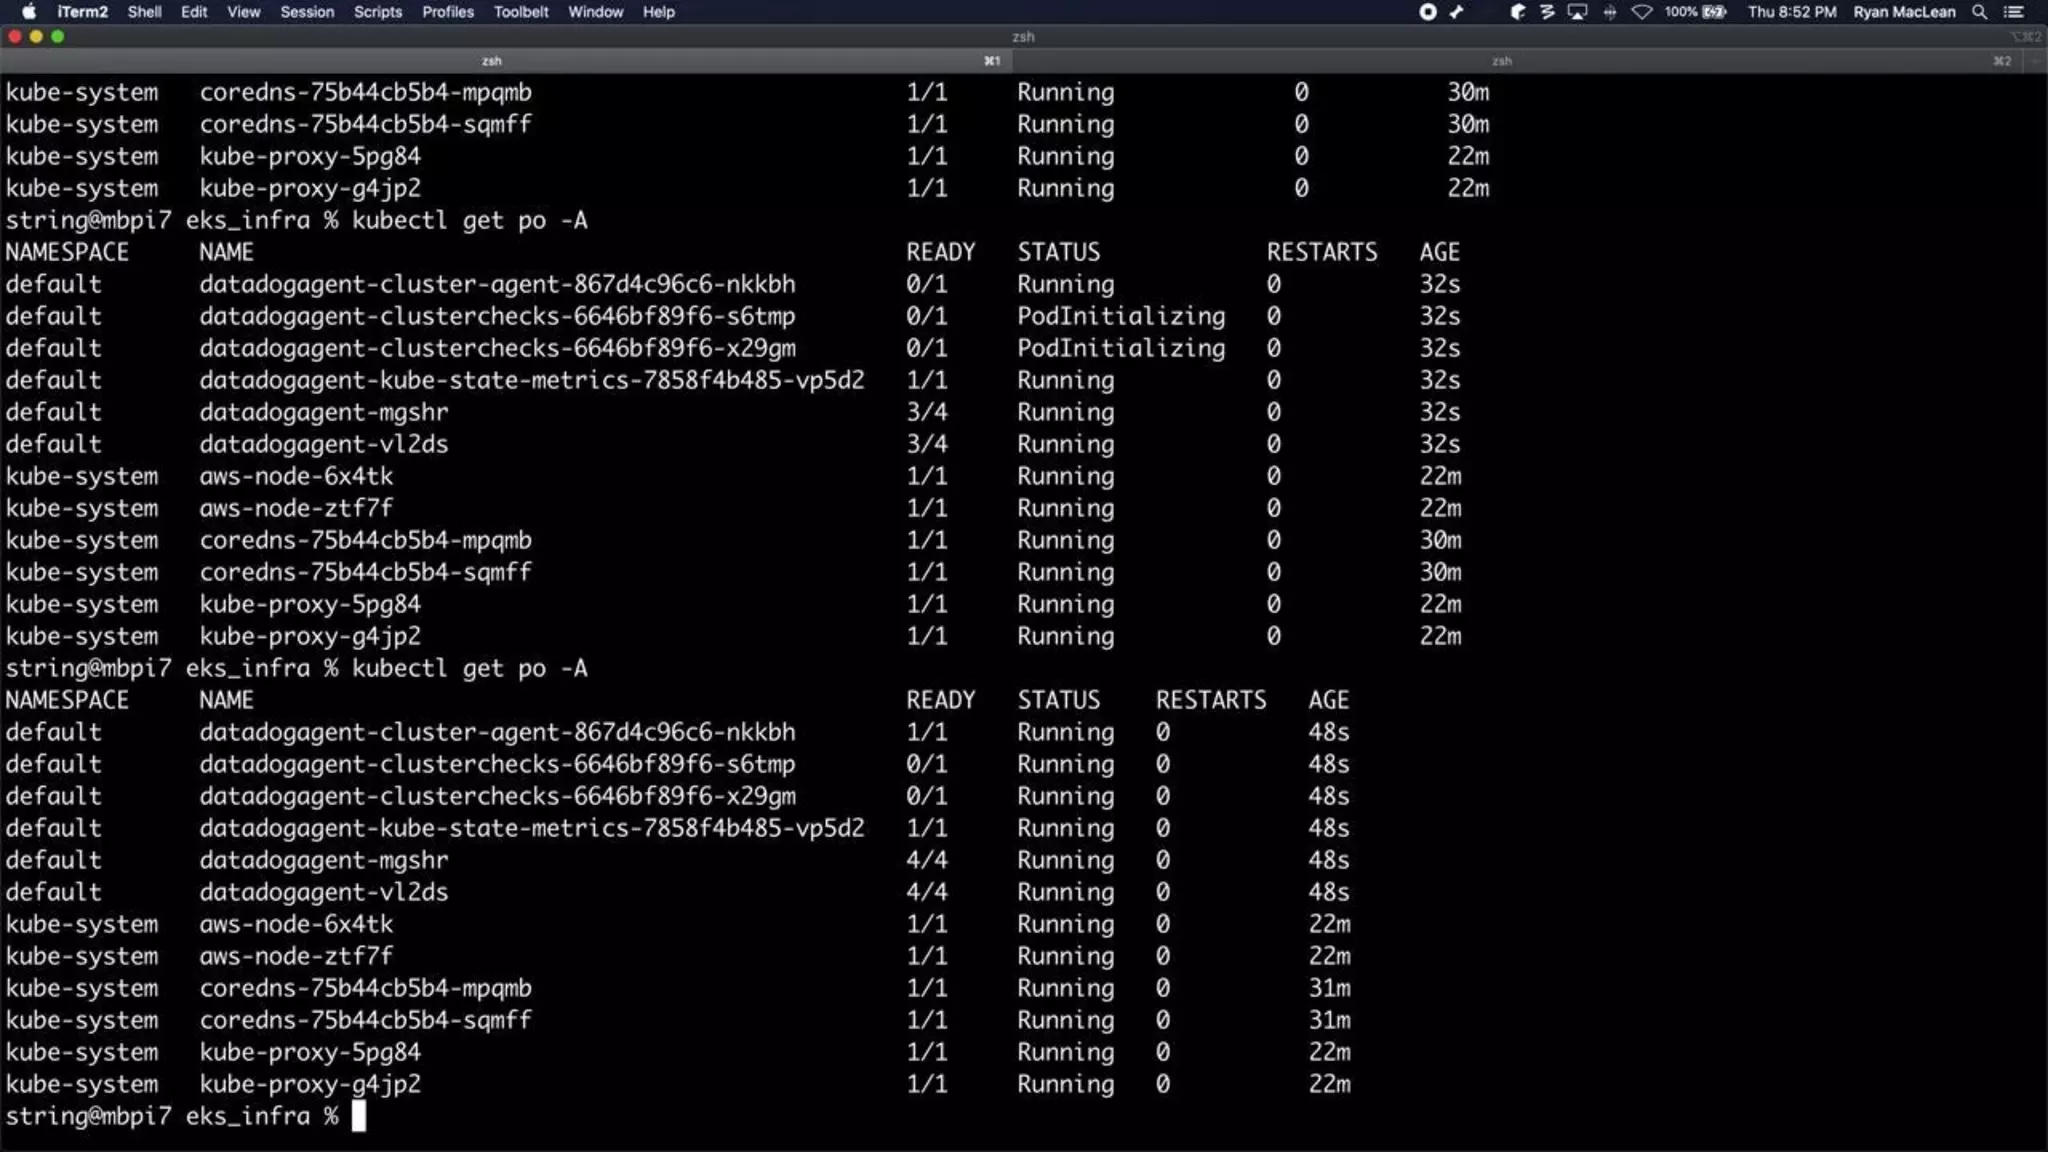
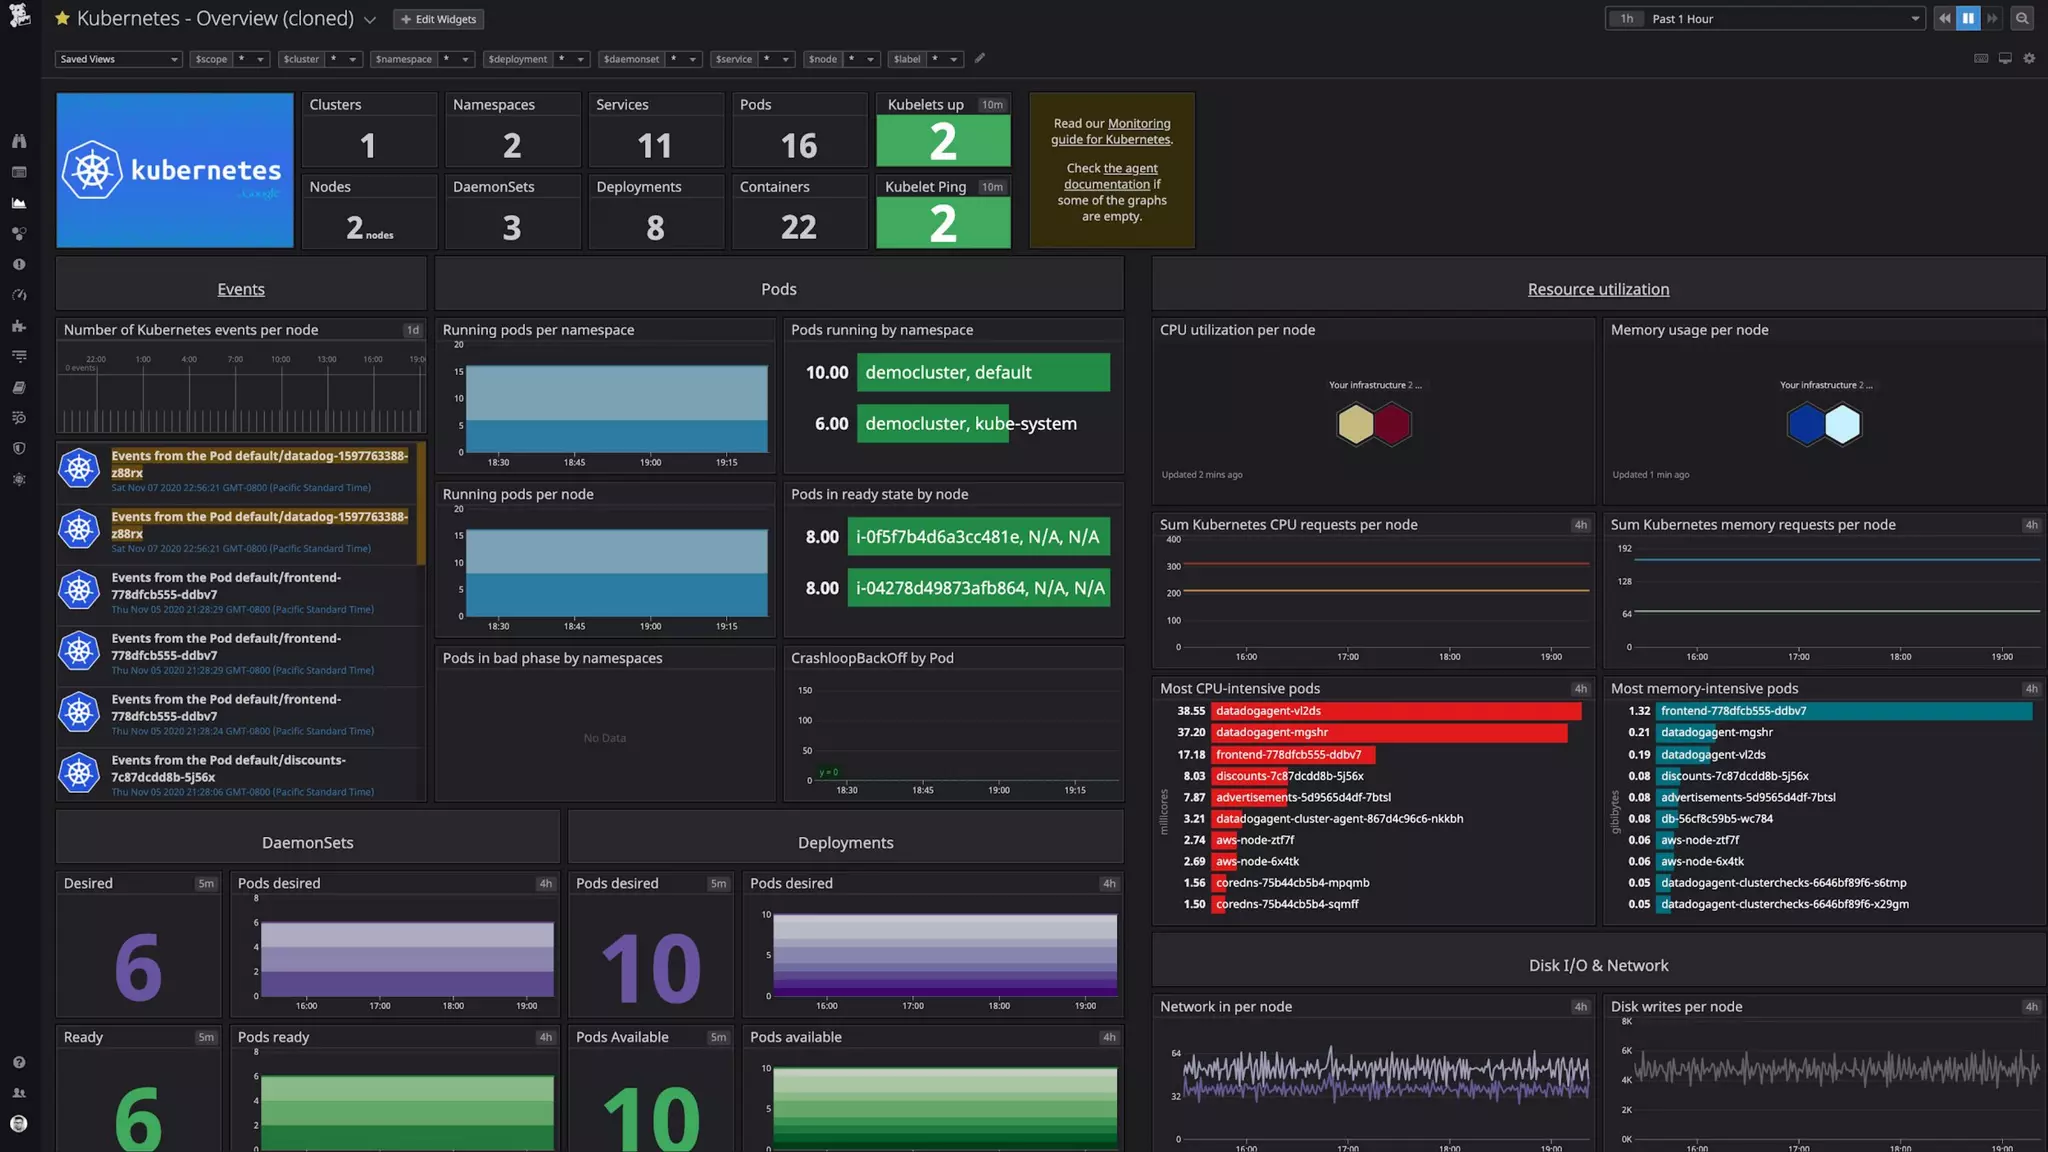
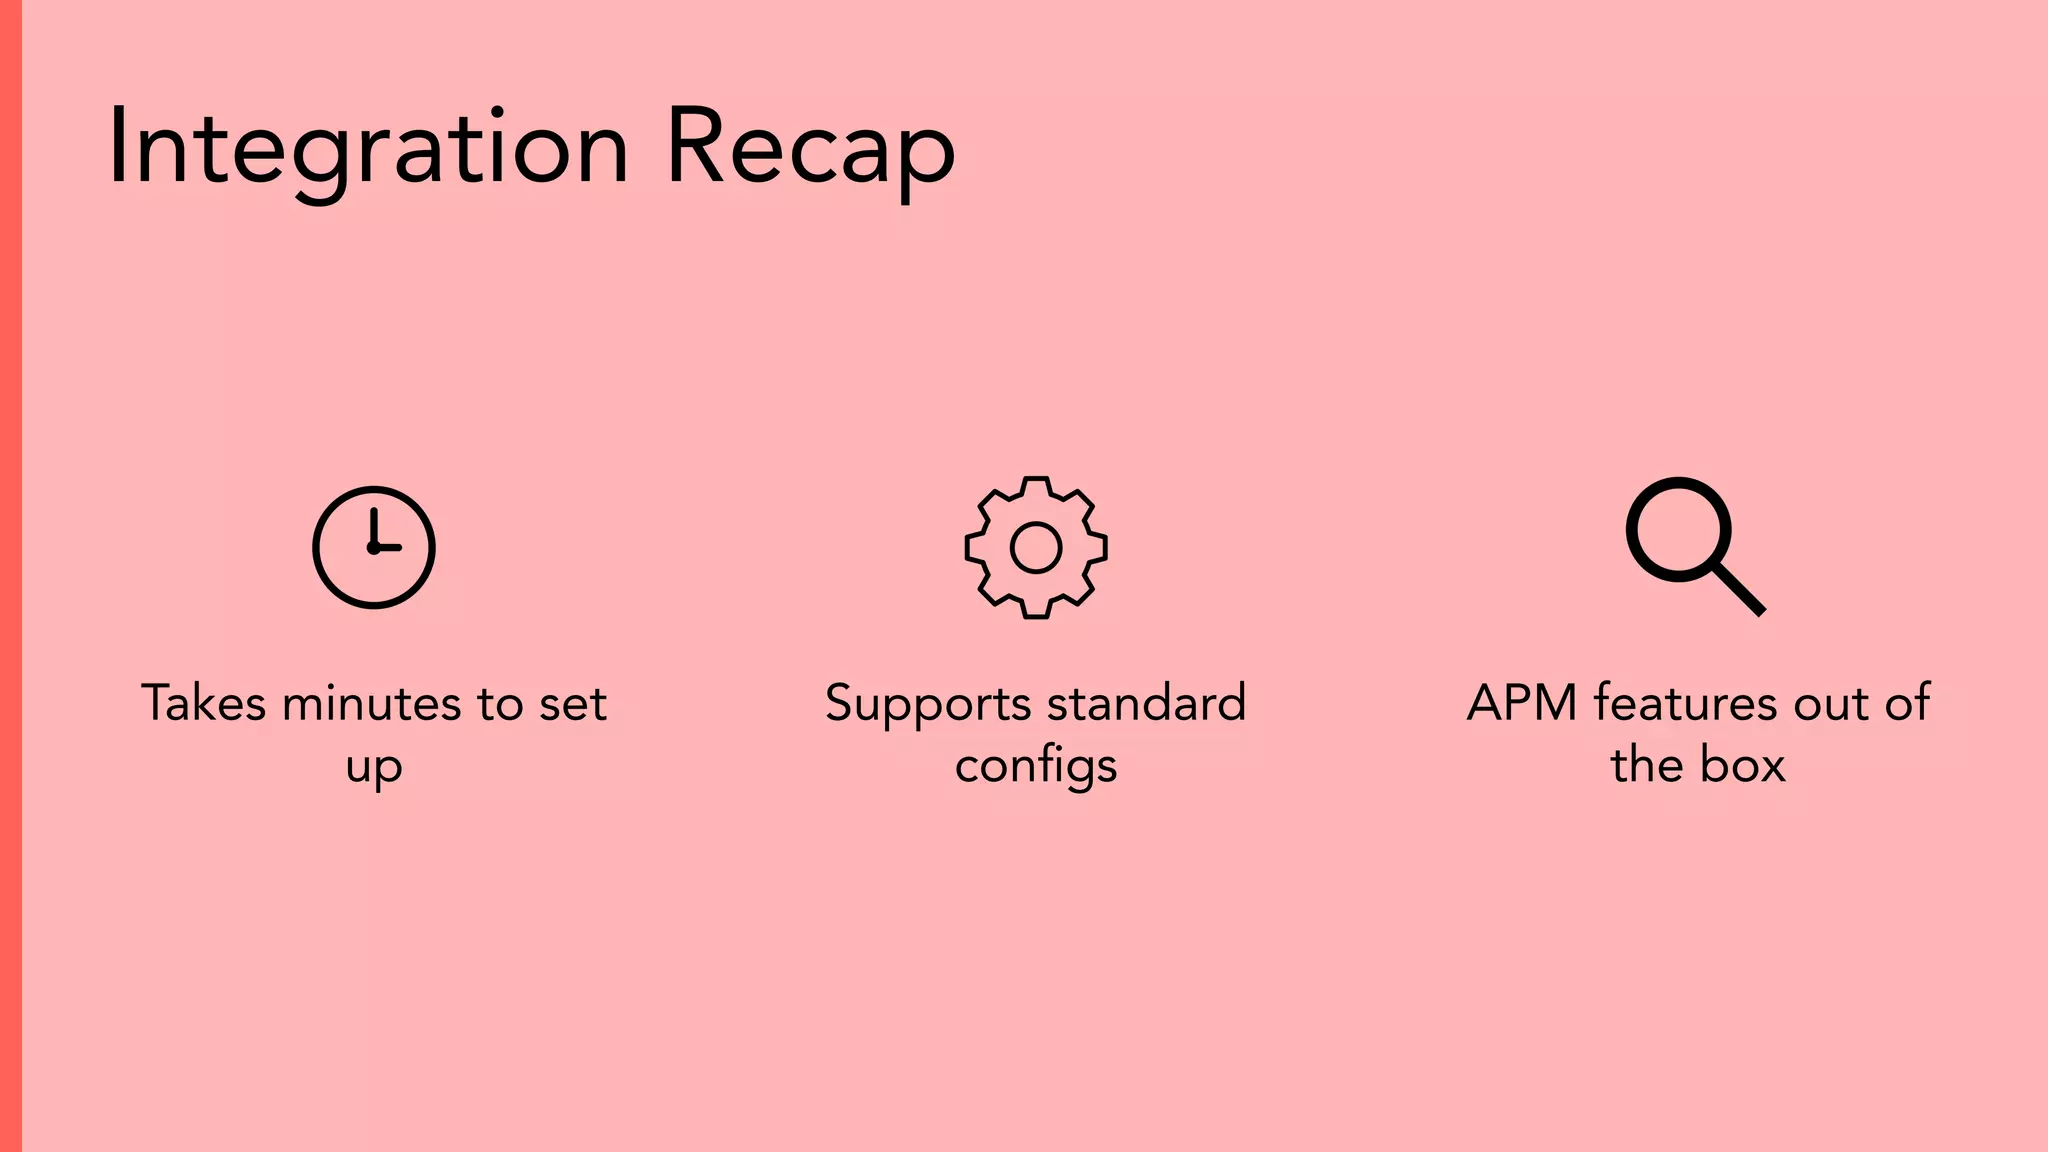
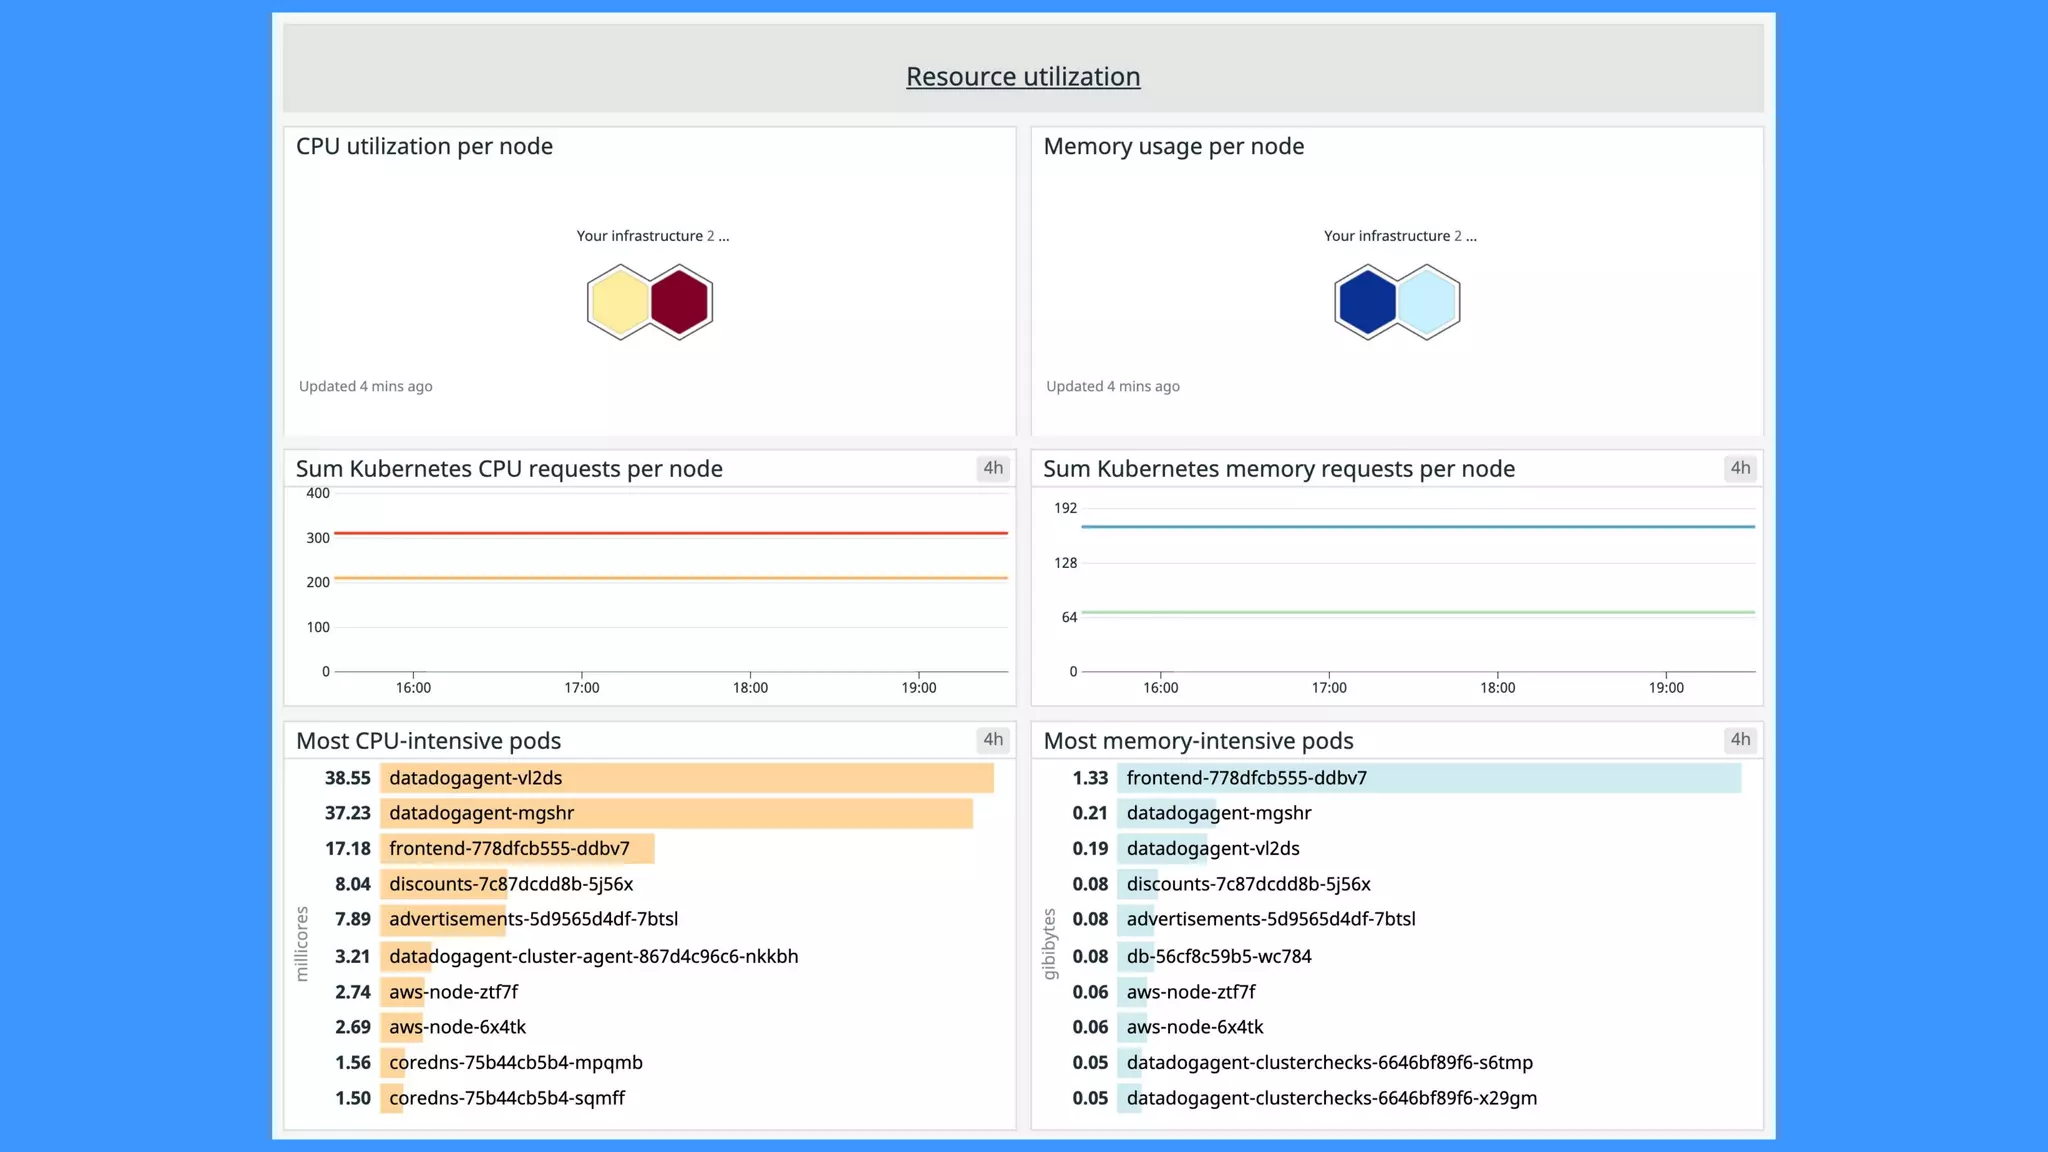
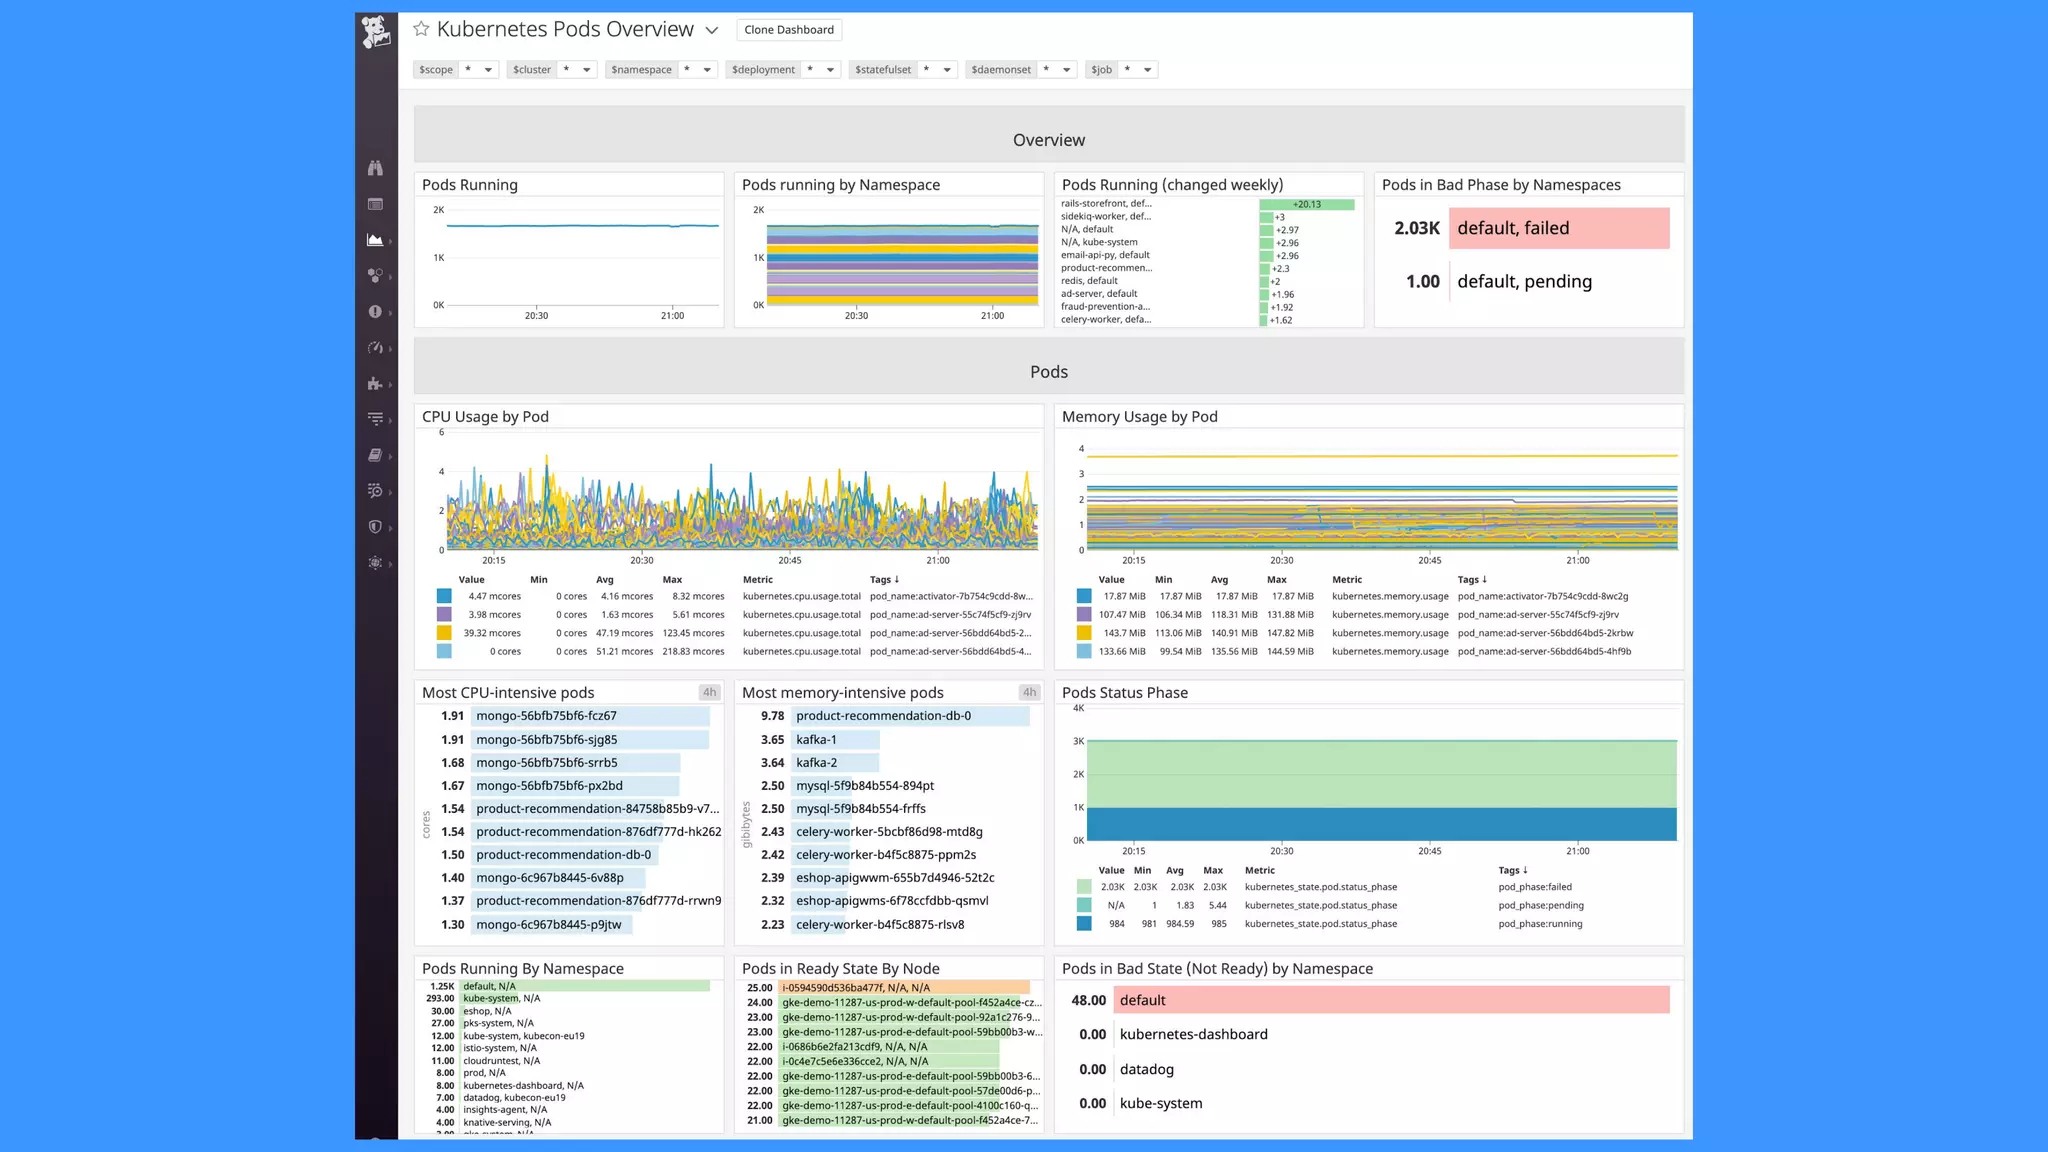

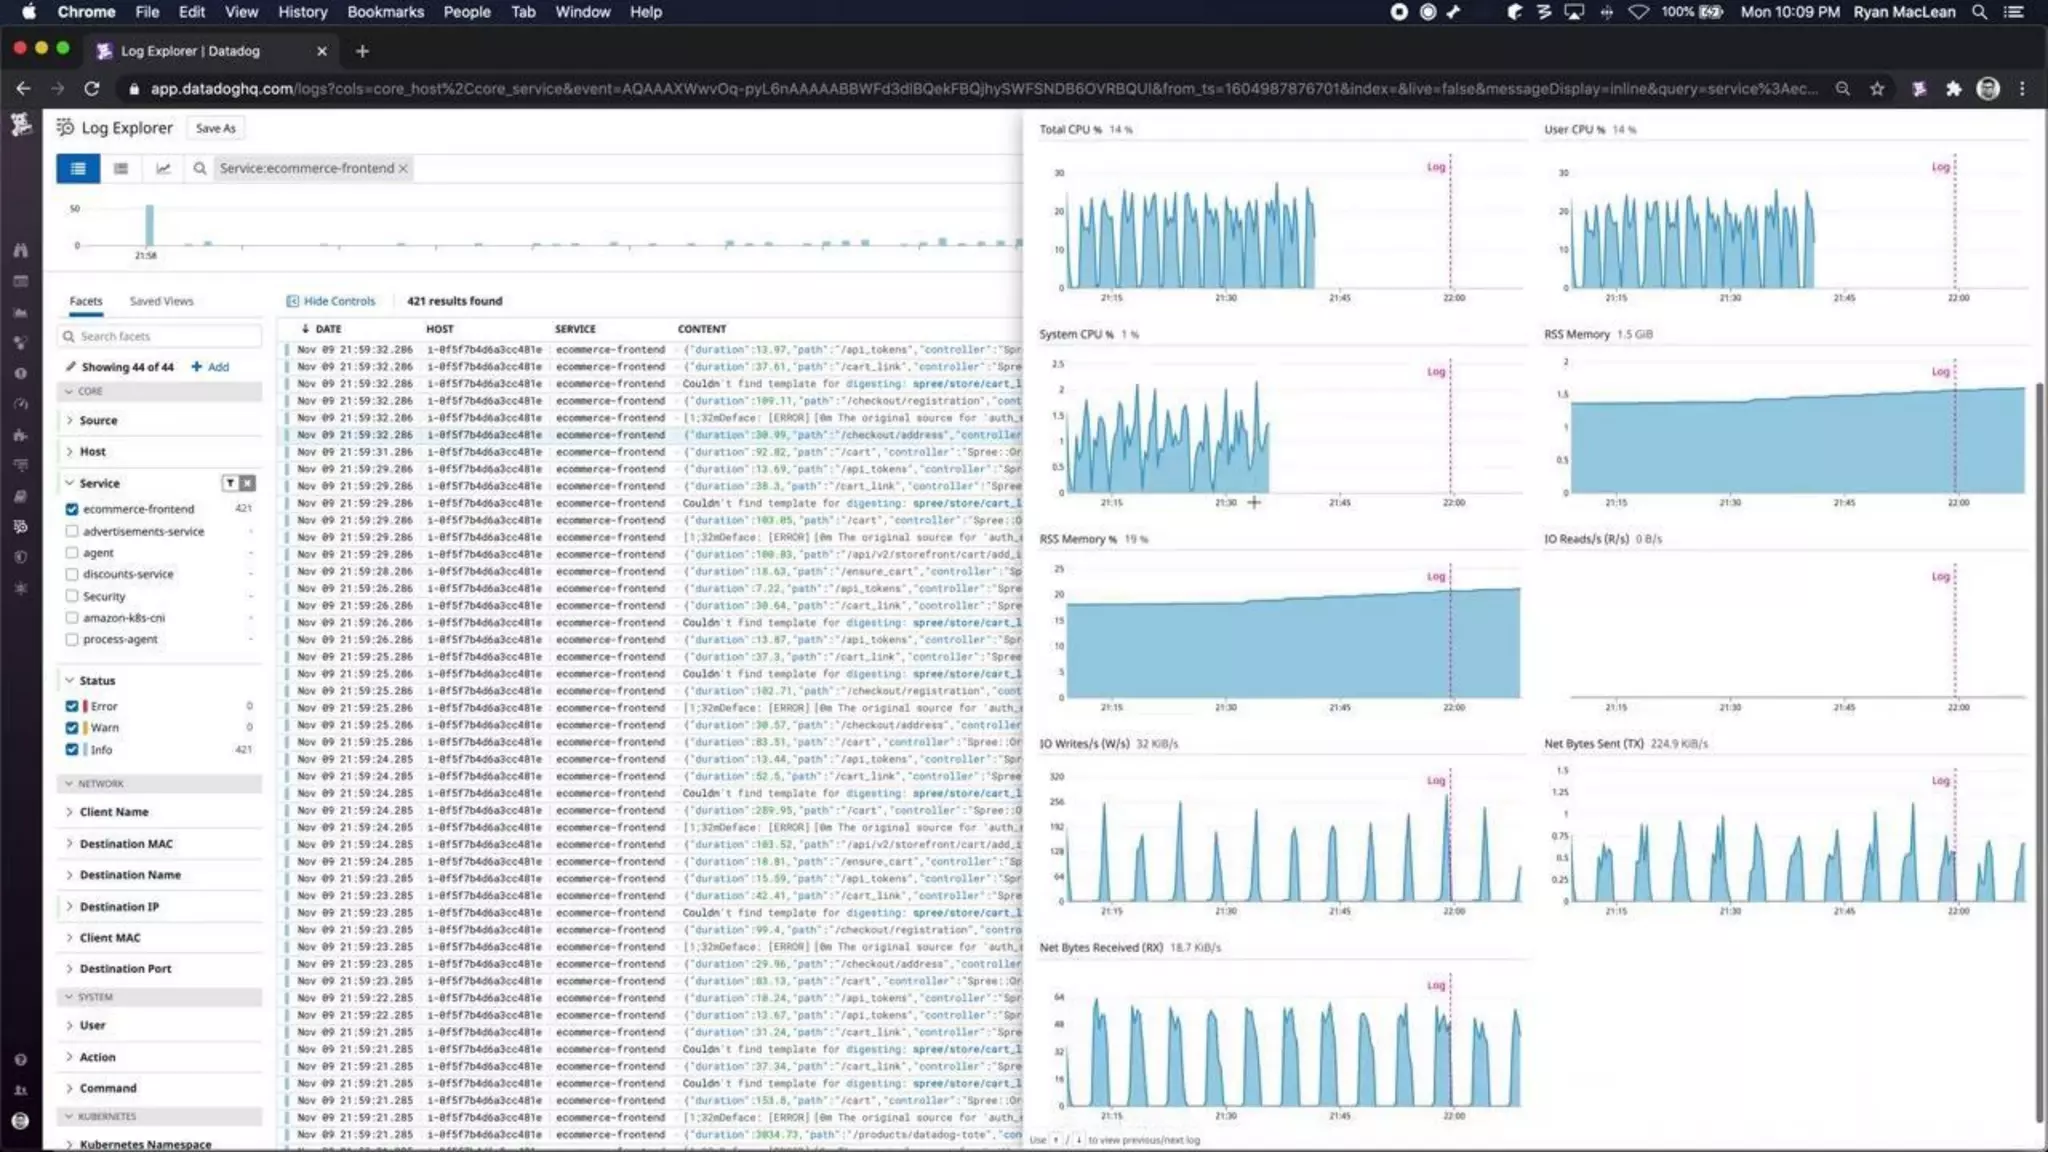
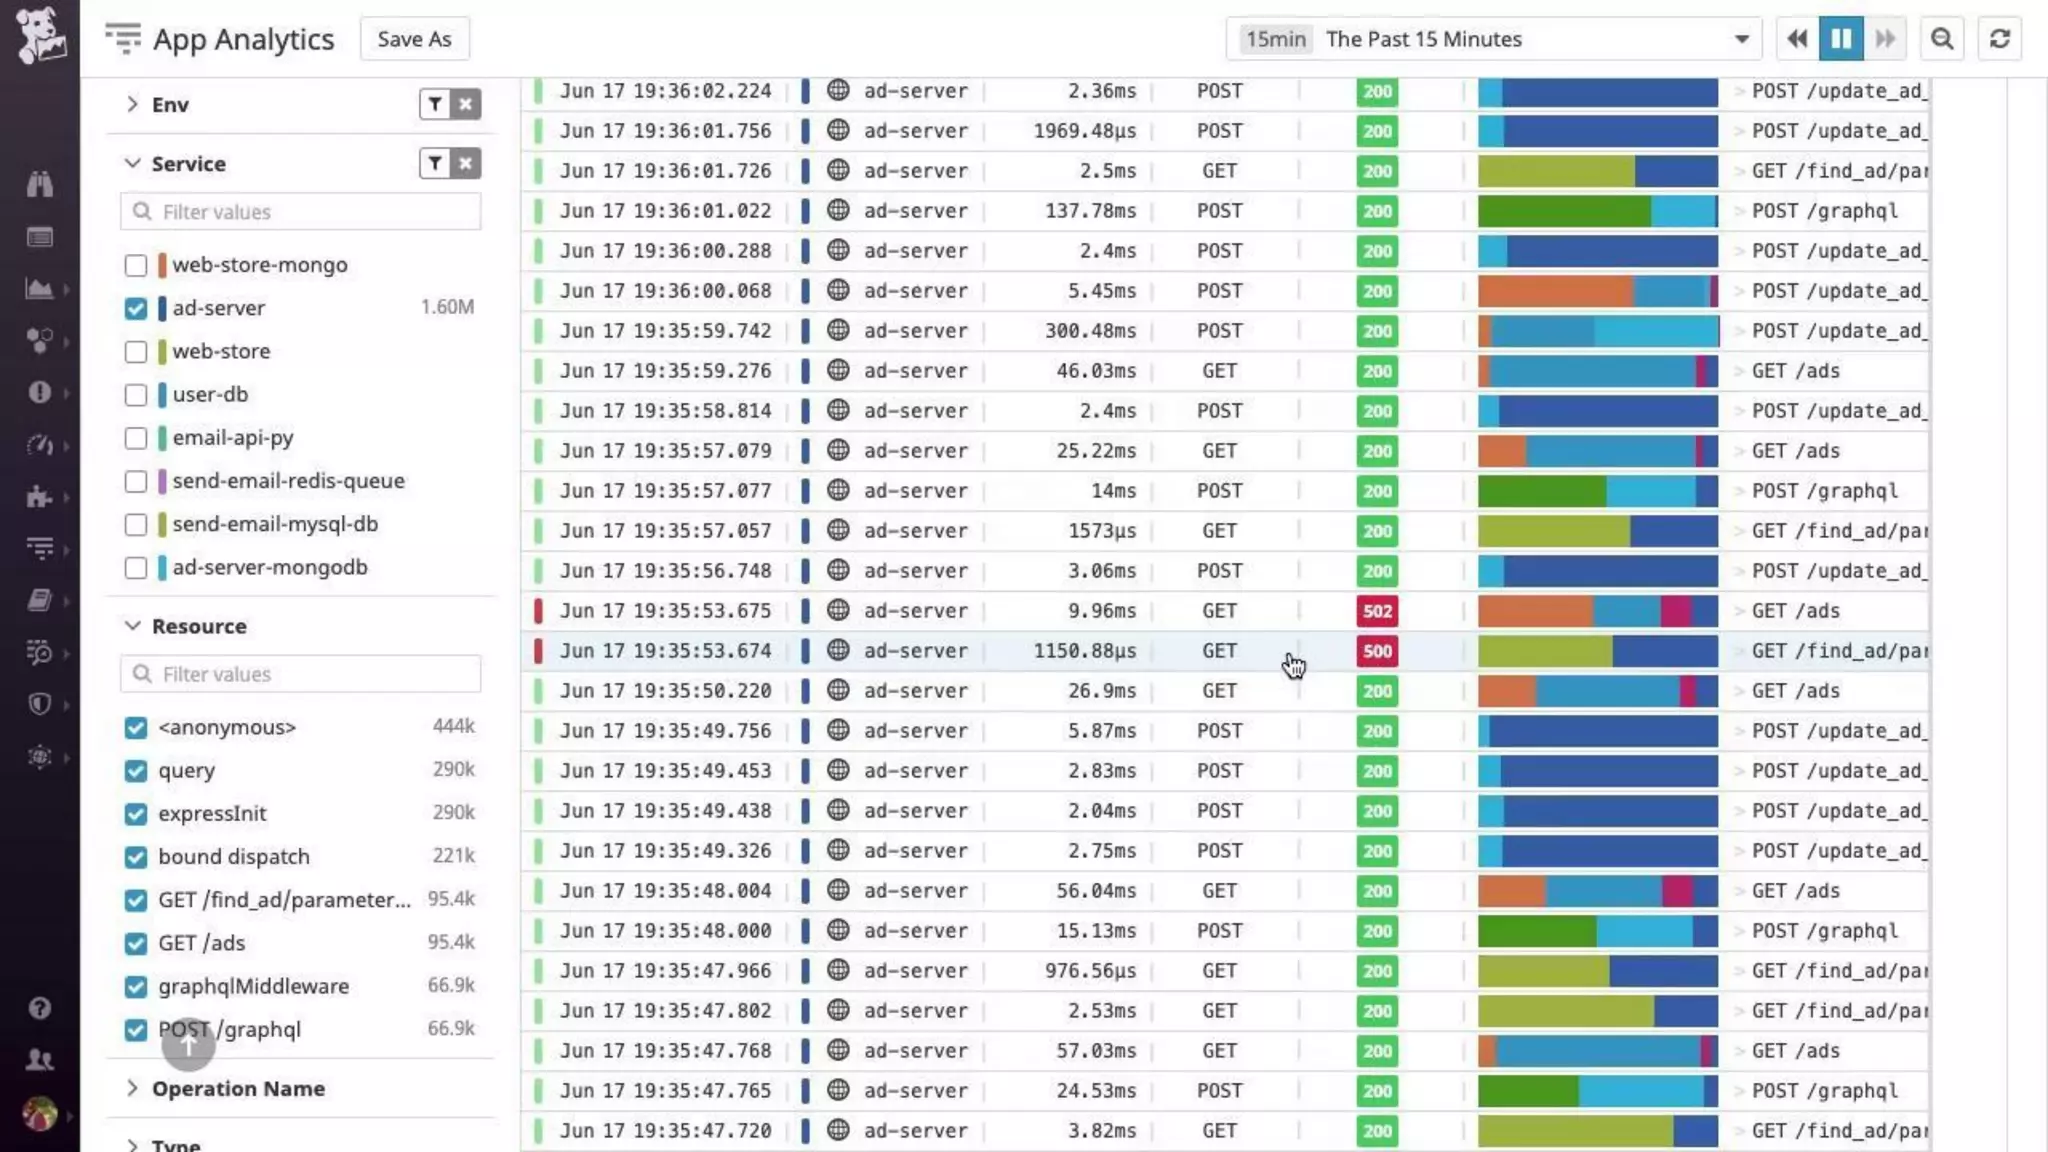
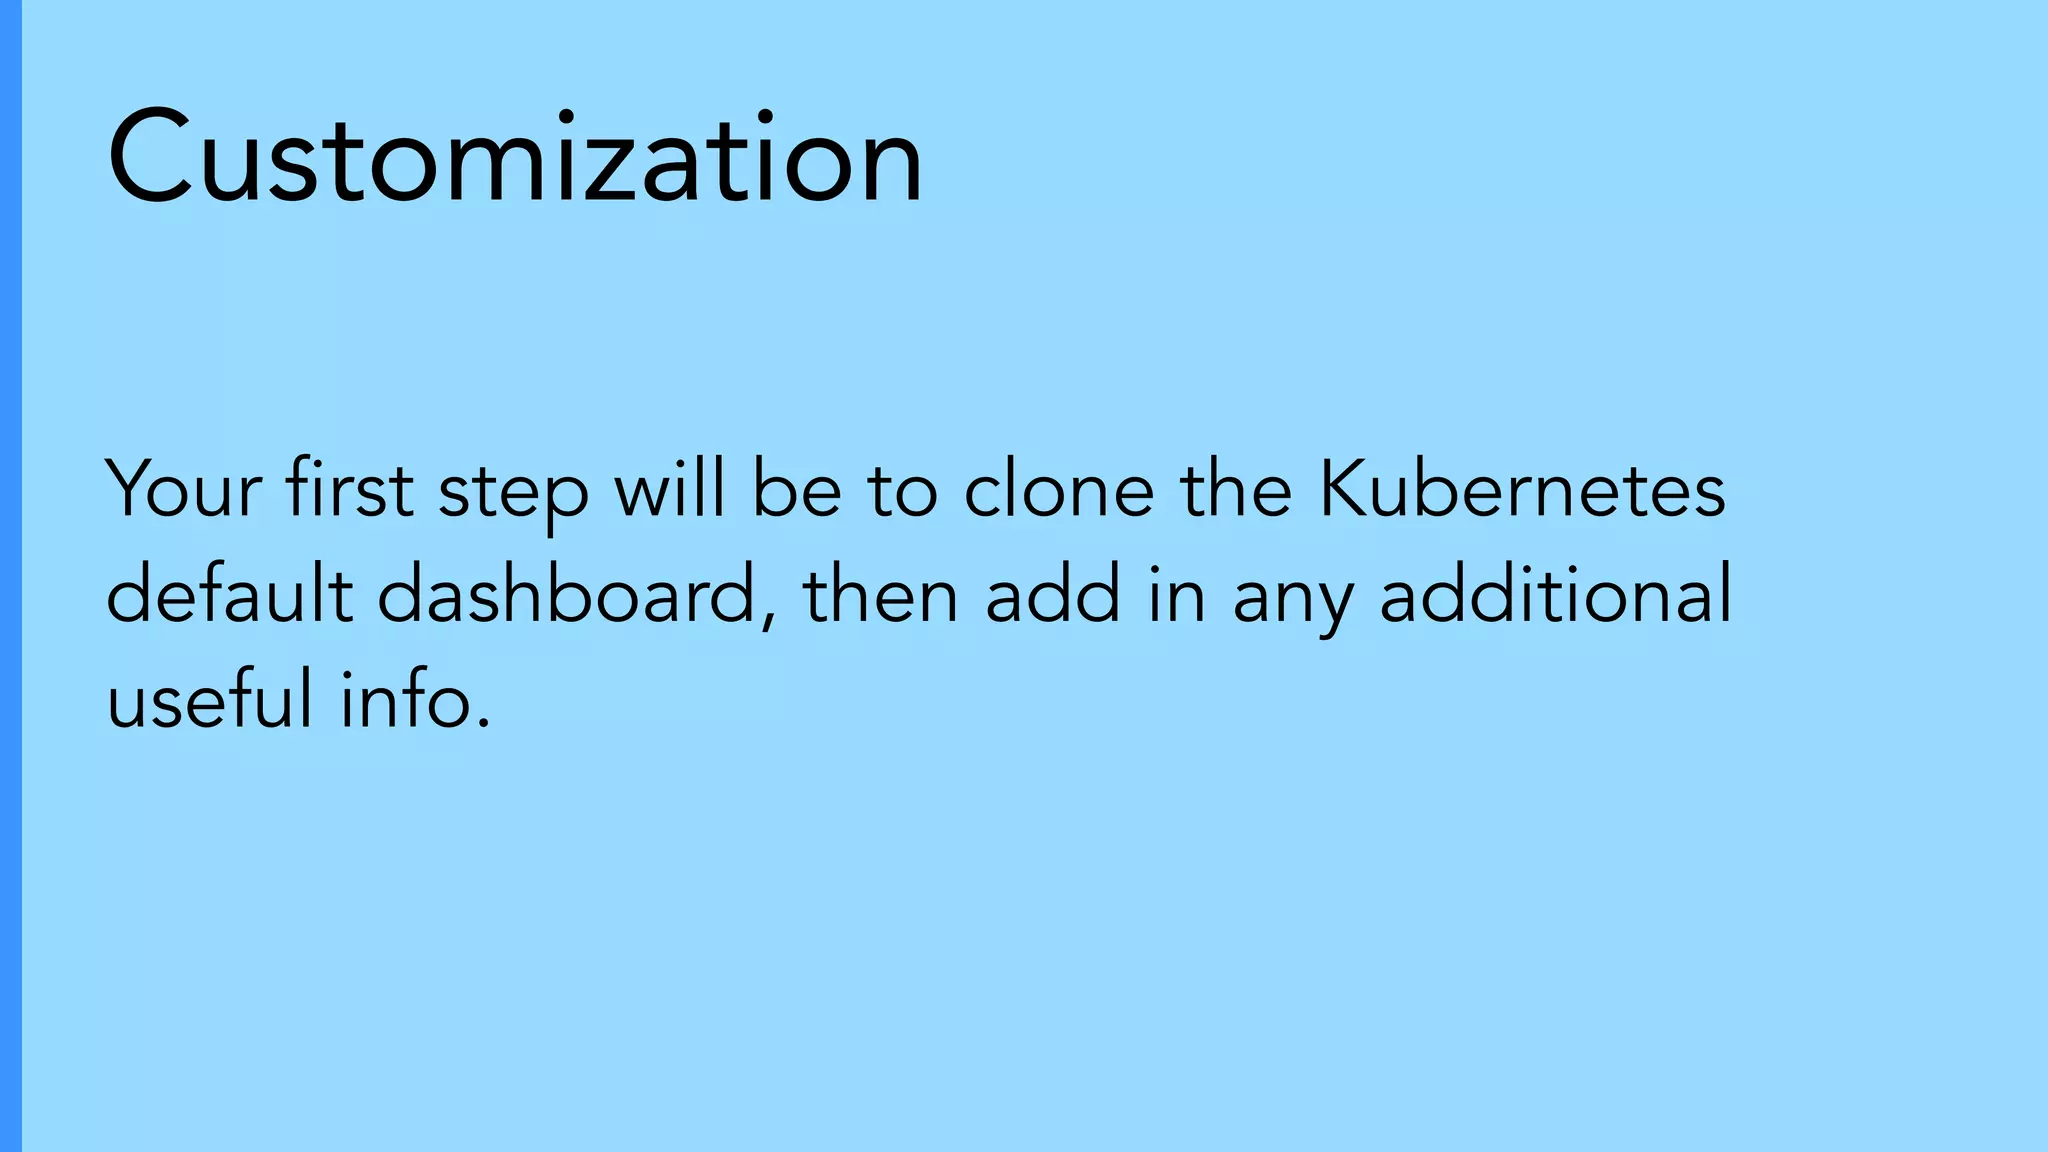
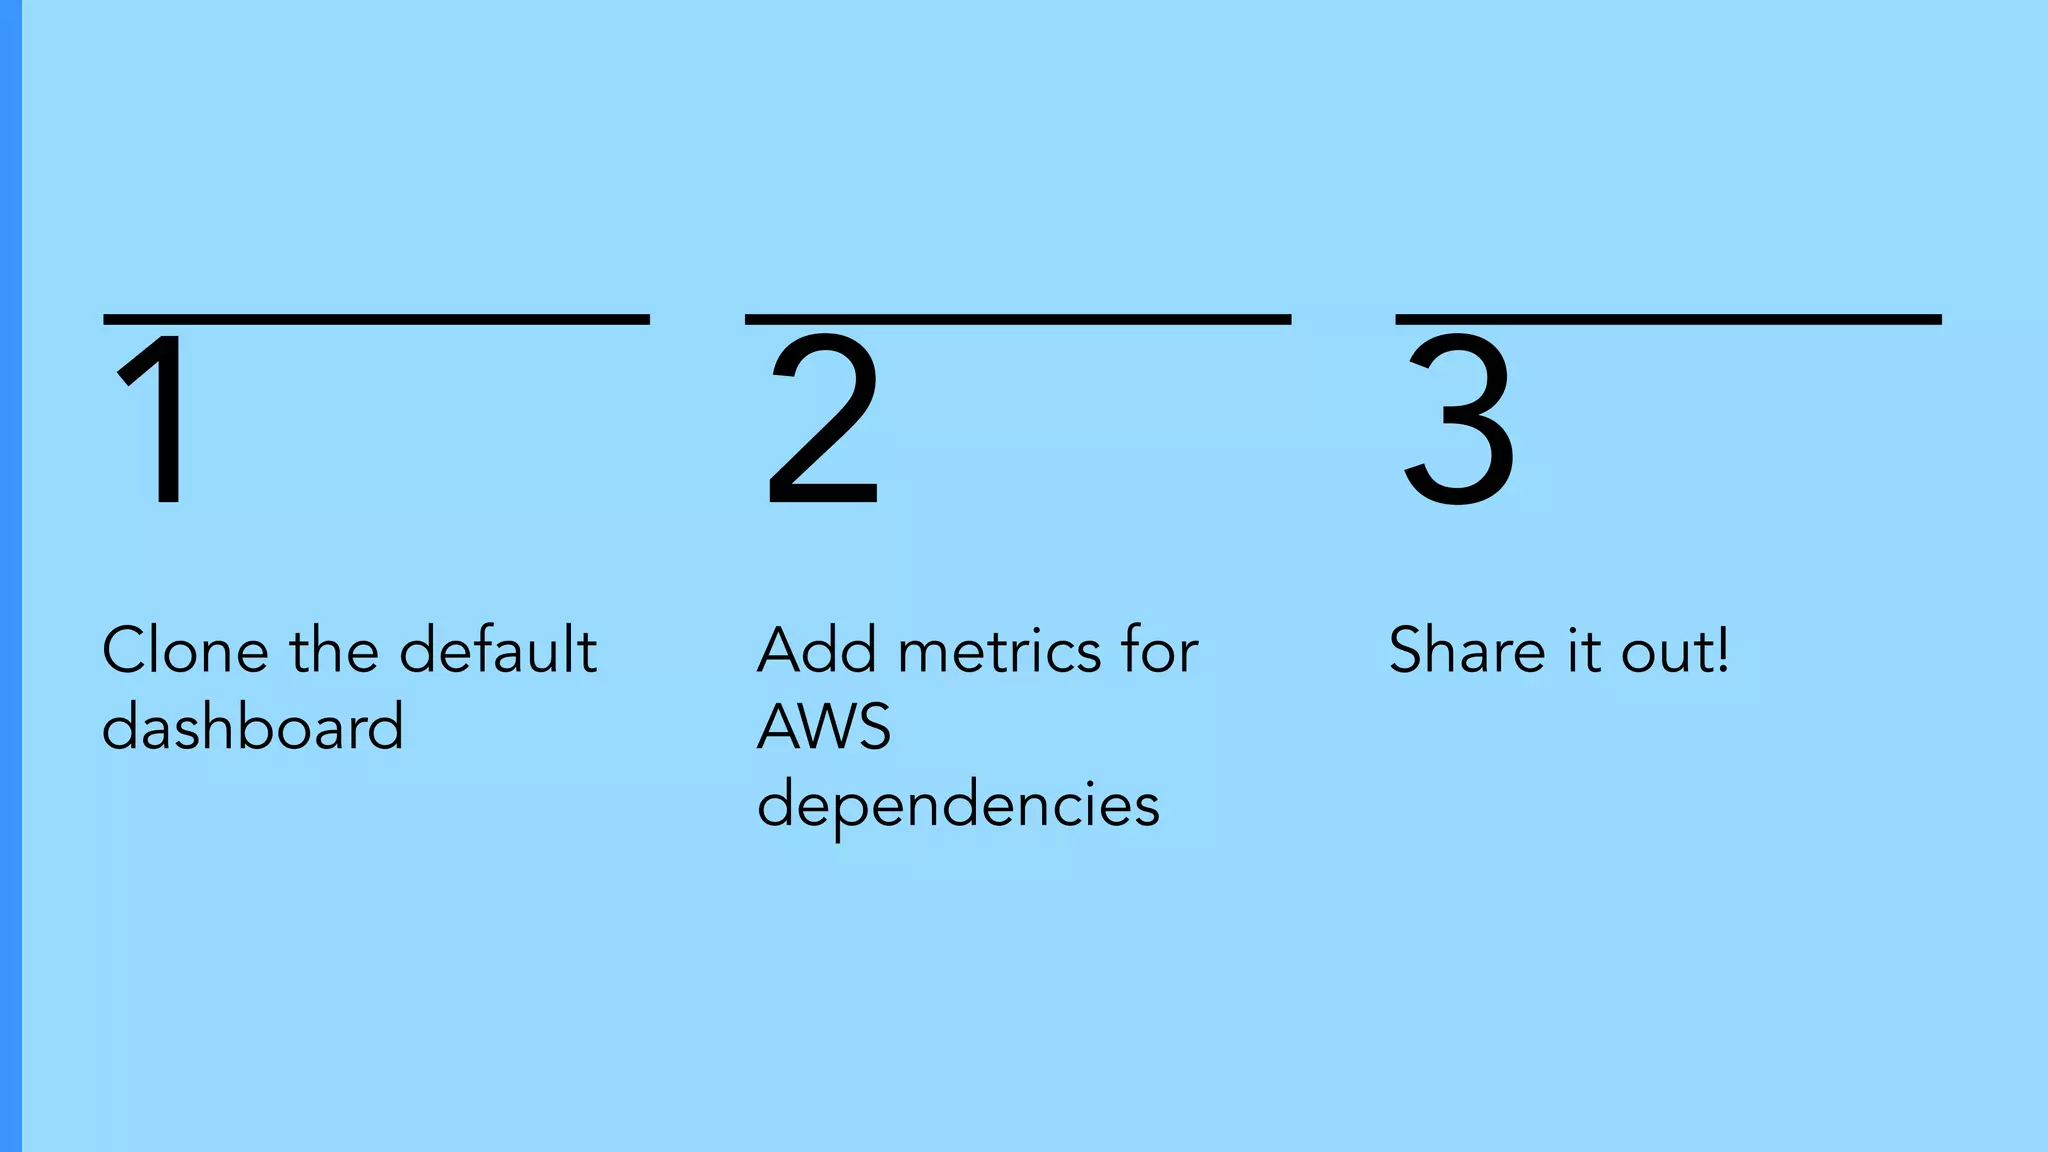
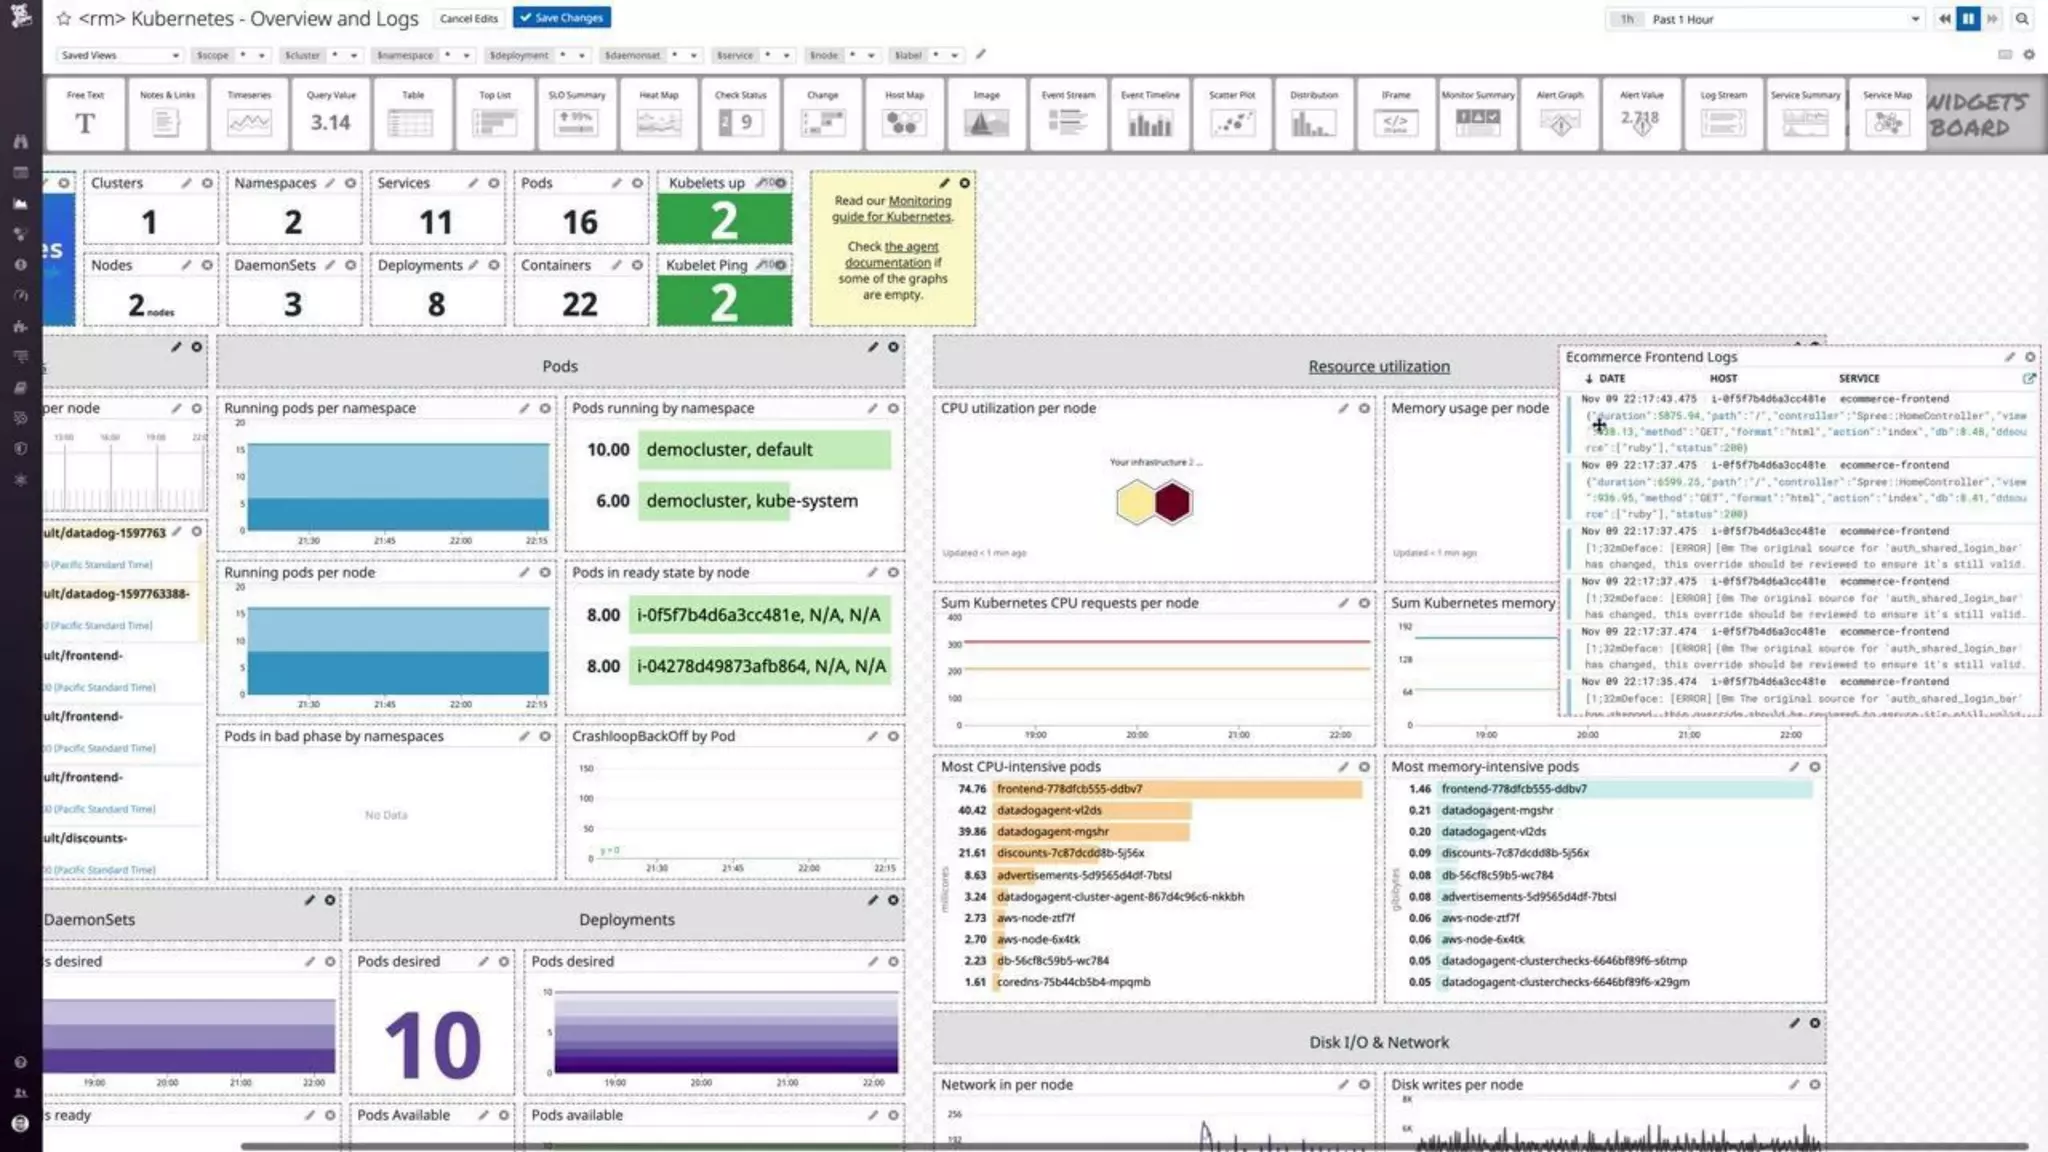
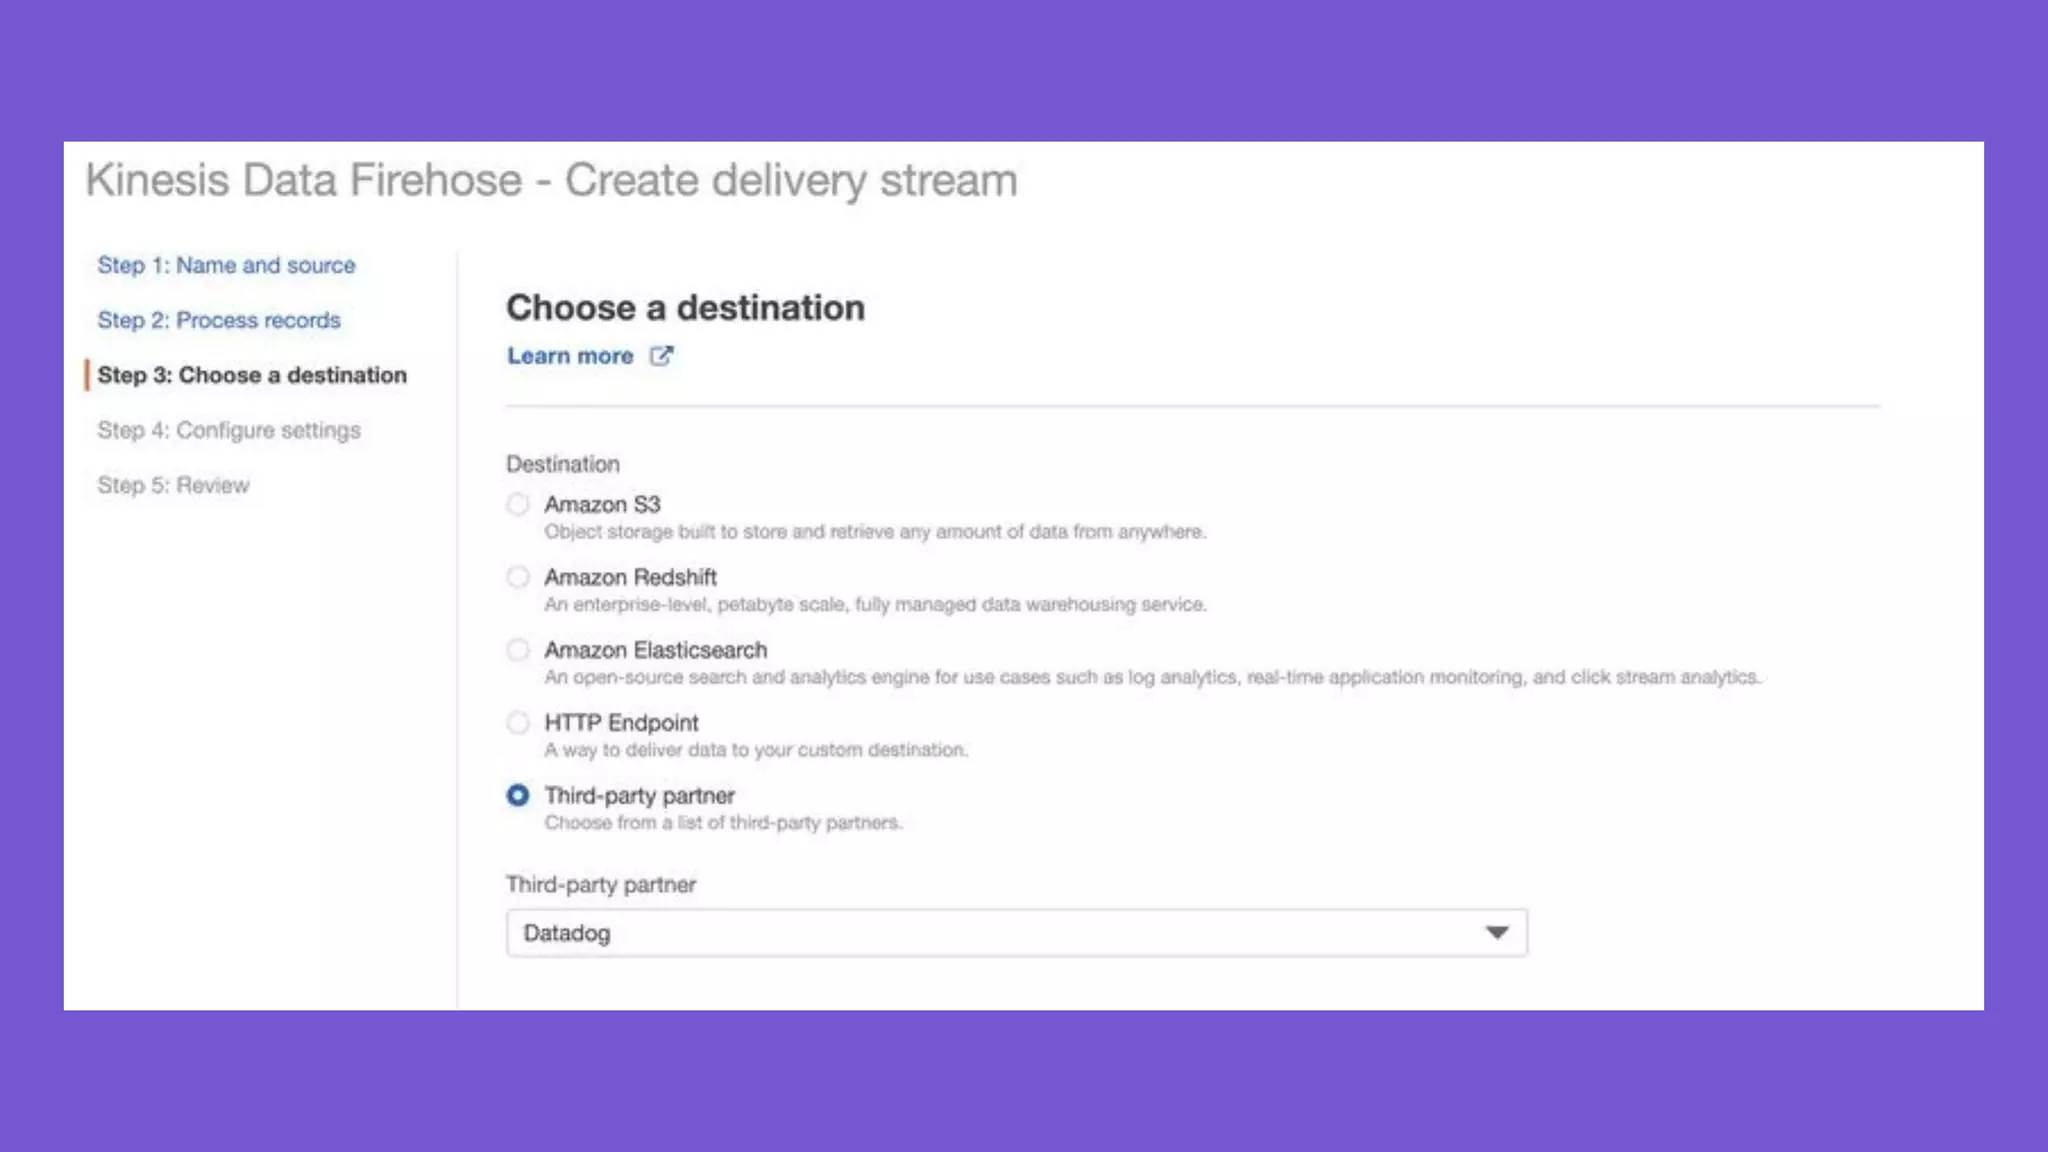


This document outlines the process of monitoring modern microservices on Kubernetes using Datadog, including deployment, resource provisioning, and integration with AWS. It discusses various monitoring capabilities such as metrics, logs, and traces, with guidance on setting up the Datadog operator and deploying the application. The document also includes resources for further learning and customization of monitoring dashboards.


![Coded Agents – with UiPath SDK + LangGraph [Virtual Hands-on Workshop]](https://cdn.slidesharecdn.com/ss_thumbnails/codedagentsdeck-251215155422-5497c599-thumbnail.jpg?width=640&height=640&fit=bounds)


