2016 Digital Education Survey
•
2 likes•1,819 views

For more than 100 years, K-12 education in the US has taken place in the classroom between 8 A.M.-3 P.M. With the advent of technology, that model has changed. Discover how digital transformation is impacting the education ecosystem, both inside and outside of the classroom, with this inaugural Digital Education Survey: http://www2.deloitte.com/us/en/pages/technology-media-and-telecommunications/articles/digital-education-survey.html?id=us:2sm:3ss:diged:eng:tmt:100716

Recommended
More Related Content
What's hot
What's hot (20)
Viewers also liked
Viewers also liked (17)
Similar to 2016 Digital Education Survey
Similar to 2016 Digital Education Survey (20)
More from Deloitte United States
More from Deloitte United States (20)
Recently uploaded
Recently uploaded (20)
2016 Digital Education Survey
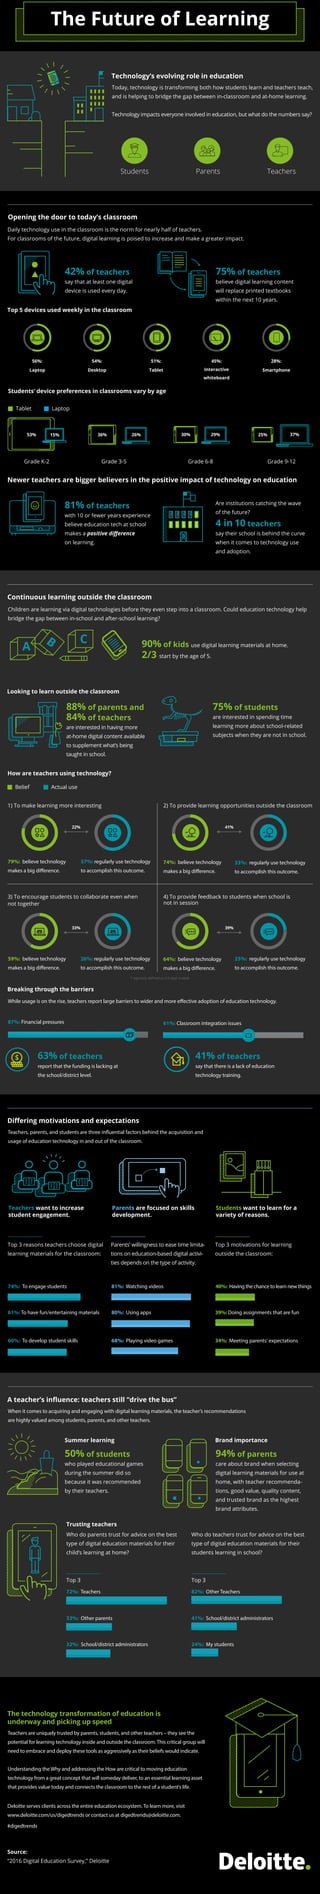
- 1. Top 3 Today, technology is transforming both how students learn and teachers teach, and is helping to bridge the gap between in-classroom and at-home learning. Technology impacts everyone involved in education, but what do the numbers say? Students’ device preferences in classrooms vary by age Tablet Newer teachers are bigger believers in the positive impact of technology on education Continuous learning outside the classroom Are institutions catching the wave of the future? 4 in 10 teachers say their school is behind the curve when it comes to technology use and adoption. 81% of teachers with 10 or fewer years experience believe education tech at school makes a positive difference on learning. Children are learning via digital technologies before they even step into a classroom. Could education technology help bridge the gap between in-school and after-school learning? Looking to learn outside the classroom How are teachers using technology? Breaking through the barriers 75% of students are interested in spending time learning more about school-related subjects when they are not in school. 88% of parents and 84% of teachers are interested in having more at-home digital content available to supplement what’s being taught in school. While usage is on the rise, teachers report large barriers to wider and more effective adoption of education technology. 87%: Financial pressures 63% of teachers report that the funding is lacking at the school/district level. 61%: Classroom integration issues 41% of teachers say that there is a lack of education technology training. Differing motivations and expectations Teachers, parents, and students are three influential factors behind the acquisition and usage of education technology in and out of the classroom. The technology transformation of education is underway and picking up speed Teachers are uniquely trusted by parents, students, and other teachers – they see the potential for learning technology inside and outside the classroom. This critical group will need to embrace and deploy these tools as aggressively as their beliefs would indicate. Understanding the Why and addressing the How are critical to moving education technology from a great concept that will someday deliver, to an essential learning asset that provides value today and connects the classroom to the rest of a student's life. 90% of kids use digital learning materials at home. 2/3 start by the age of 5. Opening the door to today’s classroom Technology’s evolving role in education Students Parents Teachers Top 3 reasons teachers choose digital learning materials for the classroom: Parents’ willingness to ease time limita- tions on education-based digital activi- ties depends on the type of activity. Top 3 motivations for learning outside the classroom: Teachers want to increase student engagement. Summer learning Brand importance Parents are focused on skills development. Students want to learn for a variety of reasons. 74%: To engage students 81%: Watching videos 40%: Having the chance to learn new things 61%: To have fun/entertaining materials 80%: Using apps 39%: Doing assignments that are fun 60%: To develop student skills 68%: Playing video games 34%: Meeting parents' expectations A teacher’s influence: teachers still “drive the bus” When it comes to acquiring and engaging with digital learning materials, the teacher’s recommendations are highly valued among students, parents, and other teachers. 94% of parents care about brand when selecting digital learning materials for use at home, with teacher recommenda- tions, good value, quality content, and trusted brand as the highest brand attributes. 50% of students who played educational games during the summer did so because it was recommended by their teachers. Trusting teachers Who do parents trust for advice on the best type of digital education materials for their child’s learning at home? Who do teachers trust for advice on the best type of digital education materials for their students learning in school? Source: “2016 Digital Education Survey,” Deloitte Deloitte serves clients across the entire education ecosystem. To learn more, visit www.deloitte.com/us/digedtrends or contact us at digedtrends@deloitte.com. #digedtrends Laptop 1) To make learning more interesting 79%: believe technology makes a big difference. 57%: regularly use technology to accomplish this outcome. 74%: believe technology makes a big difference. 33%: regularly use technology to accomplish this outcome. 59%: believe technology makes a big difference. 26%: regularly use technology to accomplish this outcome. 64%: believe technology makes a big difference. 25%: regularly use technology to accomplish this outcome. 2) To provide learning opportunities outside the classroom 3) To encourage students to collaborate even when not together 4) To provide feedback to students when school is not in session Daily technology use in the classroom is the norm for nearly half of teachers. For classrooms of the future, digital learning is poised to increase and make a greater impact. 42% of teachers say that at least one digital device is used every day. 75% of teachers believe digital learning content will replace printed textbooks within the next 10 years. Top 5 devices used weekly in the classroom Belief Actual use 22% 33% * regularly defined as 3-4 days a week 39% 41% 56%: Laptop 54%: Desktop 51%: Tablet 45%: Interactive whiteboard 28%: Smartphone Grade K-2 53% 15% Grade 3-5 26%36% Grade 6-8 29%30% Grade 9-12 25% 37% Top 3 72%: Teachers 33%: Other parents 32%: School/district administrators 82%: Other Teachers 41%: School/district administrators 24%: My students