Olivier Desbarres: US, UK and Global growth update
•Download as DOCX, PDF•
0 likes•16 views

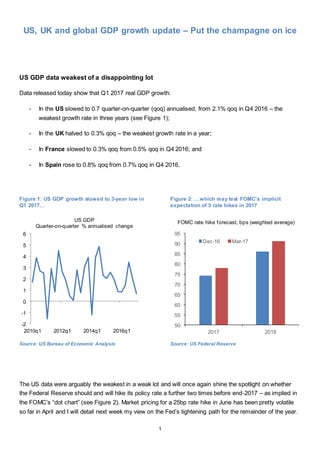
US GDP data weakest of a disappointing lot Data released today show that Q1 2017 real GDP growth: In the US slowed to 0.7 quarter-on-quarter (qoq) annualised, from 2.1% qoq in Q4 2016 – the weakest growth rate in three years (see Figure 1); In the UK halved to 0.3% qoq – the weakest growth rate in a year; In France slowed to 0.3% qoq from 0.5% qoq in Q4 2016; and In Spain rose to 0.8% qoq from 0.7% qoq in Q4 2016.

Recommended
Recommended
More Related Content
What's hot
What's hot (20)
Similar to Olivier Desbarres: US, UK and Global growth update
Similar to Olivier Desbarres: US, UK and Global growth update (20)
Recently uploaded
Recently uploaded (20)
Olivier Desbarres: US, UK and Global growth update
- 1. 1 US, UK and global GDP growth update – Put the champagne on ice US GDP data weakest of a disappointing lot Data released today show that Q1 2017 real GDP growth: - In the US slowed to 0.7 quarter-on-quarter (qoq) annualised, from 2.1% qoq in Q4 2016 – the weakest growth rate in three years (see Figure 1); - In the UK halved to 0.3% qoq – the weakest growth rate in a year; - In France slowed to 0.3% qoq from 0.5% qoq in Q4 2016; and - In Spain rose to 0.8% qoq from 0.7% qoq in Q4 2016. Figure 1: US GDP growth slowed to 3-year low in Q1 2017… Figure 2: …which may test FOMC’s implicit expectation of 3 rate hikes in 2017 Source: US Bureau of Economic Analysis Source: US Federal Reserve The US data were arguably the weakest in a weak lot and will once again shine the spotlight on whether the Federal Reserve should and will hike its policy rate a further two times before end-2017 – as implied in the FOMC’s “dot chart” (see Figure 2). Market pricing for a 25bp rate hike in June has been pretty volatile so far in April and I will detail next week my view on the Fed’s tightening path for the remainder of the year. -2 -1 0 1 2 3 4 5 6 2010q1 2012q1 2014q1 2016q1 US GDP Quarter-on-quarter % annualised change 50 55 60 65 70 75 80 85 90 95 2017 2018 Dec-16 Mar-17 FOMC rate hike forecast, bps (weighted average)
- 2. 2 Following today’s releases, the Dollar has weakened (albeit modestly) against the euro and in particular Sterling. The euro remains pray not to only to modest eurozone GDP growth but also, in my view, to the ECB’s arguably still cautious (read dovish) language and (in the view of many) the still uncertain outcome of the French elections due to play out on 7th May 2017. According to opinion polls, the gap between centre-left independent candidate Emmanuel Macron and National Front leader Marine Le pen has narrowed to 20 percentage points (pp) from 28pp only a week ago (see Figure 3). Macron was slow to reboot his election campaign following his win in the first round of voting on 23rd April. However, Le Pen and her party have come under scrutiny following reports that the European Parliament now estimates that National Front party fake jobs cost the institutions nearly €5mn versus an initial estimate of €1.9mn. Moreover, the (provisional) National Front leader – Jean-François Jalkh – who only took over from Le Pen on 25th April stepped down today following the release of comments he made in 2005 in which he seemingly denied the existence of the Holocaust. Figure 3: Macron’s lead against Le Pen has narrowed as a result of a shaky start post-first round Source: Les Echos Nine days is a long time in politics and an eternity in French presidential elections and much can change between now and next Sunday when up to 46 million registered voters go to the polls. However, I am sticking with my core scenario that Macron will be elected President (see 7 reasons why Macron will become President and market implications, 25 April 2017). 30 35 40 45 50 55 60 65 70 16-Mar 20-Mar 24-Mar 28-Mar 01-Apr 05-Apr 09-Apr 13-Apr 17-Apr 21-Apr 25-Apr 29-Apr Macron Le Pen Voting intentions for second round of presidential elections, %
- 3. 3 Global GDP growth likely to have risen only modestly in Q1 2017, if at all The implications from today’s GDP data releases are potentially numerous and include the possibility that year-on-year global GDP growth at best rose only modestly in Q1 2017, as has been the case in the past three quarters (see Figure 5). Major economies which have so far released Q1 data account for about 40% of world GDP (on a purchasing power parity basis), according to my estimates. A weighted average of GDP growth in these eight economies was broadly unchanged from Q4 2017 at 3.74% yoy (see Figure 4). Only three economies recorded faster year-on-year growth in the quarter – the UK, China and South Korea – while growth in Spain was unchanged from Q4 2016 at around 3.0% yoy. Figure 4: GDP growth in major economies which have released Q1 data points to possible stagnation…. Source: National Statistics Offices, IMF The global manufacturing PMI has historically been well correlated with global GDP growth and the pick-up in the PMI in Q1 to a multi-year high of 52.9 suggests that GDP growth accelerated further in the quarter (see Figure 5). This would also corroborate the IMF’s conclusion in its latest April 2017 update that “global economic activity is picking up” and the ECB’s assessment at its policy meeting on 27th April that “Incoming data, notably survey results, bolster our confidence that the ongoing economic expansion [in the eurozone] will continue to firm and broaden. 0 1 2 3 4 5 6 7 8 US (16.5%) China (14.7%) Korea (1.7%) France (2.6%) Taiwan (1.0%) Singapore (0.4%) UK (2.5%) Spain (1.6%) Total Q4 2016 Q1 2017 Real GDP, % year-on-year (figure in brackets is share of world GDP in PPP-terms)
- 4. 4 Figure 5: …but global manufacturing PMI still suggests modest pick-up in global GPD growth in Q1 2017 Source: National Statistics Offices, IMF, Markit But the risk, in my view, is that if GDP growth in other major economies due to release Q1 data in coming weeks disappoints as it has done in the US, France and to a lesser extent the UK, global growth will have failed to make any credible inroads in Q1 (see Figure 6). To be clear, global growth is a long way from recessionary territory but many international institutions, including central banks, have seemingly based their core scenarios on global growth rising further. If these bullish prognoses prove a little premature, it is at least conceivable that a re-calibration of the language (if not policy) will ensue. Figure 6: GDP in countries yet to release Q1 data hold the key Source: National Statistics Offices Release date for Q1 2017 GDP data - Main economies Country Release date Q4 2016 (% YoY) % of world GDP (IMF PPP) Indonesia 05-May 4.9 2.3 Germany 10-May 1.2 3.7 Italy 16-May 1.0 2.3 Russia 17-May 0.3 3.4 Japan 18-May 1.6 4.7 India 31-May 7.0 6.2 Canada 31-May 1.9 1.5 Brazil 01-Jun -2.5 3.2 Australia 07-Jun 2.4 1.0 2.0 2.5 3.0 3.5 4.0 48 49 50 51 52 53 54 2012Q4 2013Q2 2013Q4 2014Q2 2014Q4 2015Q2 2015Q4 2016Q2 2016Q4 Global manufacturing PMI (left scale) Global real GDP, % year-on-year (IMF methodology)
- 5. 5 Collapse in UK retail sales contributed to halving of GDP growth in Q1 2017 to 0.3% qoq UK GDP growth more than halved to a one-year low of 0.3% quarter-on-quarter (qoq) in Q1 2017 from 0.66% qoq in Q4 2016, according to preliminary data released today by the Office of National Statistics (ONS) – see Figure 7. The supply-side data show that the slowdown in growth in services, which account for about 79% of the UK’s GDP, to 0.3% qoq in Q1 from 0.8% qoq in Q4 2016 was responsible for the bulk of the slowdown in headline GDP growth (see Figure 7). The ONS confirmed that the 1.5% qoq contraction in the volume of retail sales in Q1 – the largest in seven years – (see Figure 8), which was due to rising inflation, had shaved almost 0.1 percentage points off headline GDP growth. Figure 7: UK GDP growth slowed to 0.3% qoq in Q1, as did service sector output Figure 8: Fall in retail sales in Q1 large contributor to lacklustre GDP performance Source: Office of National Statistics Source: Office of National Statistics This is very much in line with my view that contracting real wages (see Figure 9) alongside slowing unsecured consumer borrowing (see Figure 10) has lead retail sales to shrink which is in turn weighing on UK GPD growth (see French politics, UK macro data and possible GBP/EUR downside, 21 April 2017). I first identified this risk in August (see UK economy post referendum – for richer, but mostly for poorer, 26 August 2016). At the heart of the problem is the fact that workers’ nominal earnings are simply failing to keep up with rising inflation. One explanation is that despite the fall in the pool of available labour, workers’ power to negotiate higher nominal earnings remains weak, resulting in real weekly earnings falling in 9 of the past 13 months and 1.3% between November 2016 and February 2017 (see Figure 9). 0.0 0.2 0.4 0.6 0.8 1.0 1.2 1.4 2014 Q1 2014 Q3 2015 Q1 2015 Q3 2016 Q1 2016 Q3 2017 Q1 Services sector GDP % quarter-on-quarter (seasonally adjusted) 107 109 111 113 115 117 119 Sep-15 Jan-16 May-16 Sep-16 Jan-17 Excluding automobile fuel sales Including automobile fuel sales UK retail sales volume seasonally adjusted (2013 = 100)
- 6. 6 Figure 9: Real weekly earnings down in 9 of the past 13 months Figure 10: Slowing unsecured borrowing Source: Office of National Statistics Source: Bank of England It is perhaps premature to conclude that UK GDP growth will struggle to pick up in coming quarters given the series’ volatility. After all, GDP growth slumped in Q1 2016 to a three-year low of 0.15% qoq before rebounding to 0.63% qoq in Q2 2016 (see Figure 7). Also, while the services sector is clearly struggling, manufacturing output – which accounts for about 10% of UK GDP – rose 0.5% qoq in Q1, thanks in part to the gain in currency competitiveness as a result of Sterling’s depreciation following the 23rd June referendum. I estimate that in order for GDP growth in 2017 to match the 1.8% recorded in 2016, growth would have to average about 0.4% qoq for the remaining three quarters while it would have to average over 0.5% qoq in order to hit the IMF’s upwardly revised forecast of 2%. However, retail sales would likely have to pick up markedly in coming months in order for household consumption growth to again meaningfully add to headline GDP growth. This is a tall ask unless real earnings recover forcefully given that banks’ tighter lending standards will likely continue to curb household borrowing (see Figure 11). The fall in the pool of available labour – which I define as workers who are unemployed, part-time employed and out of the labour force but willing to work – suggests that nominal weekly earnings growth should start rising from a currently tepid 2.3% year-on-year (see Figure 12). But this has yet to happen, which points to workers still not enjoying much wage-bargaining power. 475 480 485 490 495 500 505 Jan 12 Jan 13 Jan 14 Jan 15 Jan 16 Jan 17 Weekly earnings including bonuses, constant 2015 prices, seasonally adjusted (£) -3 -2 -1 0 1 2 3 4 5 6 7 0 5 10 15 20 25 30 Mar-07 Apr-09 May-11 Jun-13 Jul-15 Secured Unsecured (right scale) UK - Net lending to individuals 3-month rolling sum (£ billions)
- 7. 7 Figure 11: Borrowing under pressure as banks expect to further tighten lending standards Figure 12: Falling pool of available labour but workers struggling to negotiate higher earnings Source: Bank of England Survey Source: UK Office of National Statistics Note: * Includes bonuses Moreover, business investment, which has stagnated since Q4 2015 and thus added nothing to overall GDP growth, is unlikely to pick up materially in my view given the uncertainty generated by the UK’s scheduled exit from the EU in March 2019. With the above in mind, I see the risk tilted towards GDP growth remaining rather lacklustre in coming quarters, despite record-low interest rates, UK exporters benefiting from Sterling’s weakness and the (albeit tepid) recovery in global GDP growth. This would in turn reinforce my long-held view that the Bank of England is likely to look through any temporary rise in inflation and keep its policy rate unchanged at 0.25% for the foreseeable future (see Bank of England and inflation – sense of déjà-vu, 24 March 2017). -50 -40 -30 -20 -10 0 10 20 30 2007Q2 2009Q2 2011Q2 2013Q2 2015Q2 Past 3 months Next 3 months Change in availability of unsecured credit to UK households (net percentage balance) -4 -2 0 2 4 6 8 109 10 11 12 13 14 Jan 03 May 06 Sep 09 Jan 13 May 16 Unemployed, part-time workers and inactive but want a job (millions) Average (nominal) weekly earnings, % year-on-year (right scale, inverted)*