2. in southern China and showed that the clay mineralogy varied accord-
ing to the parent material, latitude, elevation and topographic position.
Kaolinite and halloysite were the most common clays in these soils, the
proportion of kaolinite increasing with the degree of weathering.
Vermiculite, illite, chlorite and smectite were also identified as second-
ary clay minerals. Goethite and hematite were the only Fe oxides occur-
ring in significant quantities in the soils studied by Zhang et al. (2004).
This wide variety of clay mineralogy encountered in the Chinese red
soils probably indicates that the origin of their high drought sensitivity
is not closely related to the clay mineralogy. The objective of the present
work is to analyze the water retention properties of a few Chinese red
clay soils, to relate these properties to the characteristics of the clays
and to compare them to the water retention properties of clay soils
from different regions of the world. The results will enable the discus-
sion of the clay characteristics which are responsible for the small
amount of available water and hence potentially partially responsible
for the high sensitivity of Chinese red clay soils to drought.
2. Materials and methods
2.1. The soils studied
The red clay soils of the Taoyuan experimental station (28°55′47″N,
111°26′33″W) in the Hunan province, 200 km west of Changsha were
selected for study. This experimental station belongs to the Chinese Eco-
system Research Network. According to the Köppen classification, the
climate of the region is Humid Subtropical (Cfa). It is characterized by
a dry winter (medium temperature of the coldest month ranging from
−3 °C to 18 °C) and maximum rains in summer. The mean annual rain-
fall in Taoyuan is 1440 mm, 80% of rainfall occurring between March
and August. The mean annual temperature is 16.5 °C. The range be-
tween winter and summer (difference between the average tempera-
ture during winter and summer) is 21 °C (Huang et al., 2004a,b). Soils
were selected at three locations along a slope (Fig. 1): a soil at the top
of the slope (TS) under a vegetation mainly composed of tea-oil trees
(Camellia oleifera) and secondarily by camphor laurels (Cinnamomum
camphora), chestnut trees (Castanea sp.) and sandalwood (Santalum
sp.); a soil at the middle of the slope (MS) in an orchard of orange
trees; and a soil on a ledge of the slope (LS) in a cultivated plot after a
maize crop, the soil being left bare at the time of soil sampling. The
soils are derived from Quaternary red clays. They are Ferric Acrisols in
the International Reference Base System (ISSS Working Group WRB,
2007), Udic Ferralosols in the Chinese Soil Taxonomy (CRG-CST, 2001)
and Typic Hapludult in the Soil Taxonomy (Soil Survey Staff, 2010).
They were sampled in March 2011 after rewetting with 39 and 204
mm of rainfall in February and March, respectively. The soils were
thus close to field capacity. A pit 1 m in depth was dug and the different
horizons were described. Disturbed samples were collected in every
horizon as well as undisturbed samples of different volumes.
2.2. Methods
The bulk density (Db in g cm−3
) and field water content of the
horizons at sampling date were measured by using cylinders
1236 cm3
in volume. The bulk density of undisturbed millimetric clods
20 to 30 mm3
in total volume was measured using the kerosene method
(Monnier et al., 1973). It was measured in triplicate with 5 to 10
millimetric clods at a water content corresponding to sampling condi-
tions and after air-drying in the laboratory (Bruand and Prost, 1987).
The particle size distribution was measured using the pipette method
after pre-treatment of samples with hydrogen peroxide and sodium
hexametaphosphate (Robert and Tessier, 1974). The cation exchange
capacity (CEC, in cmol+ kg−1
of oven-dried soil) and the exchangeable
cations were measured using the cobalt-hexamine trichloride method
(Ciesielski and Sterckeman, 1997) and organic carbon content (OC) by
oxidation using excess potassium bichromate in sulphuric acid at
135 °C (Baize, 2000). The gravimetric water content was determined
at −60, −100, −330, −1,000, and −3,300 hPa water potential by
using in triplicate soil cores 100 cm3
in volume and at −15,000 hPa
water potential by using undisturbed clods (10–15 cm3
in volume) col-
lected when the soil was near to field capacity (Bruand and Tessier,
2000). The soil cores were thoroughly saturated for one week before
they were placed inside a pressure plate chamber (Soil Moisture Equip-
ment Corp, Santa Barbara, USA) to drain at the sequence of pressure
from −60 to −3,300 hPa (Jing et al., 2008). The mineralogical compo-
sition of the b2 μm material of the horizons B1 and C of each soil was
determined by X-ray diffraction (XRD). Samples were air-dried and
manually ground to a powder in a mortar. The clay fraction was col-
lected using the sedimentation method at 20 °C after mechanical dis-
persion. Oriented clay deposits were prepared on glass slides and
Fig. 1. Location of the soils studied in the Taoyuan experimental station (soil at the top of the slope: TS, middle of the slope: MS and on a ledge of the slope: LS).
47B. D'Angelo et al. / Geoderma 223–225 (2014) 46–53
3. studied using an X-ray diffractometer equipped with a Si(Li) solid
detector to filter the CuKα radiation (λCuKα = 1.5418 Å) of a standard
European type X-ray tube (40 kV, 40 mA). The divergence, the incident
beam scatter, the diffracted beam scatter and the receiving slits were
2.00, 4.00, 0.50 and 0.22 mm wide, respectively. The XRD patterns
were collected from 2° to 24° 2θ at a scan rate of 0.3° 2θ cm–1
per step
of 0.05° 2θ, on natural, glycoled and heated oriented slides (Bruand
and Prost, 1988; Robert and Tessier, 1974). Nitrogen adsorption
isotherms were conducted on about 150 mg of b2 mm soil samples
dried in a 105 °C oven for 24 h and then dried again at 105 °C under a
pressure of 102
Pa. The specific surface area (SSA) of the material was
determined using the BET equation (Brunauer et al., 1938). Experiments
were performed with a surface analyser (Model Nova 2200e, Quanta-
chrome Instrument Company, USA).
3. Results and discussion
3.1. Basic physico-chemical characteristics
The clay content (CC in g per kg of oven-dried soil at 105 °C)
increased roughly with depth in each soil and ranged from 373 to
497 g kg−1
in soil TS, from 359 to 461 g kg−1
in soil MS and from
237 to 378 g kg−1
in soil LS (Table 1). These clay contents are similar to
those reported for red soils by Baligar et al. (2004). The fine silt (2–
20 μm) content ranged from 382 to 505 g kg−1
(Table 1). A high fine
silt content was also recorded in other red soils located in southern
China (Hong et al., 2010). The pH ranged from 4.2 to 4.7 and increased
with depth in the three soils studied (Table 1). These values are con-
sistent with those earlier recorded in southern China for red soils
under upland tree vegetation and crops (Xu et al., 2003). The cation
exchange capacity (CEC in cmol+ per g of oven-dried soil) was very
small considering the clay content and poorly saturated by the alkaline
cations (about 10–20%); exchangeable aluminum (not measured here)
was the main exchangeable cation, as pointed out by Xu et al. (2003).
Because the subsoil horizons contained little organic carbon
(Table 1), we assumed that the contribution of the organic matter to
the cation exchange capacity was negligible compared with the cation
exchange capacity of the clay. Thus we calculated for the subsoil hori-
zons the cation exchange capacity of the clay (CECcl, in cmol+ per g of
oven-dried clay at 105 °C) as follows (Bruand and Tessier, 2000):
CECcl ¼ CEC=CCð Þ Â 1; 000:
Results showed that CECcl ranged from 9.58 to 14.11 cmol+ g−1
which corresponded to a clay fraction mainly made up of non-active
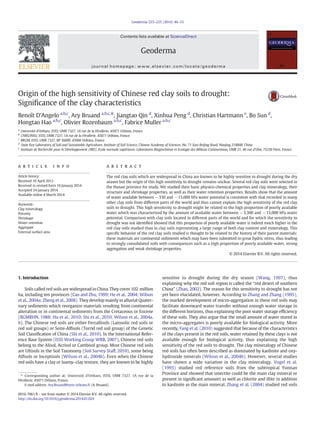
clays (Table 1). XRD patterns of the clay fraction extracted from the
horizons C show the presence of:
— 1:1 clays (d001 = 0.713 nm) which are in all likelihood kaolinite, as
the peak at 0.713 nm is similar at 20 °C, 170 °C and after treatment
with ethylene glycol (Fig. 2). The much smaller peak at 0.713 nm re-
corded after heating at 500 °C is thought to be related to the remain-
ing presence of kaolinite which is not dehydroxylated at such a
temperature (Bruand and Prost, 1986; Robert and Tessier, 1974);
— non-swelling 2:1 clays (d001 = 1004 nm) which are in all likelihood
particles of micas b2 μm or large particles of illite because of the very
small CECcl recorded, the peak at 1004 nm being similar at 20 °C,
170 °C and after treatment with ethylene glycol (Fig. 2) (Robert
and Tessier, 1974);
— and non-swelling 2:1/1 clays (d001 = 1.400 nm) which are proba-
bly chlorites or hydroxy-vermiculites, the peak at 1.400 nm being
similar at 20 °C and after treatment with ethylene glycol (Fig. 2)
(Robert and Tessier, 1974). At 170 °C, the X-ray diagrams show a de-
crease in the intensity of the peak at 1.400 nm probably because of
the partial destruction of the octahedra in the interlamellar space.
At 500 °C, the peak at 1.400 nm was either very small (Fig. 2c and f)
or absent (Fig. 2a, b, d and e), thus indicating the nearly total or
total destruction of the octahedra in the interlamellar space.
The clay mineralogy appears therefore to be characterized by the
presence of non-swelling or poorly swelling clays. A similar clay compo-
sition with some illite/smectite interstratified clays was described by
Hong et al. (2010) in red soils located in southern China. Because of
the lack of a swelling test using glycol or ethylene glycol in their
study, the illite/smectite interstratified clays identified by the presence
of a peak at 1.464 nm might in fact be chlorites or hydroxy-
vermiculites such as for the soils selected for this study (Robert and
Tessier, 1974).
The specific surface area (SSA in m2
per g of oven-dried soil) ranged
from 8.8 to 36.8 m2
g−1
and the clay content accounts for 84% of its var-
iance. As contributions to SSA from silt and sand are negligible for clay
soils, the major contribution is likely to be made by clay-size materials.
We thus calculated the SSA of the clay fraction (SSAcl, in m2
per g of
oven-dried clay) for horizons B1, B2 and C as follows:
SSAcl ¼ SSA=CCð Þ Â 1; 000:
The results showed that SSAcl was between 37.1 and 77.3 m2
g−1
(Table 1) thus indicating a small size of the b2 μm fraction in these ho-
rizons (e.g. Balbino et al., 2002; De Brito Galvão and Schulze, 1996;
Feller et al., 1992). Reatto et al. (2009) studied Brazilian clayey Acrisols
(IUSS Working Group WRB, 2007) and found that SSAcl was between
Table 1
Physico-chemical characteristics of the soils studied at the top (TS), the middle (MS) and on a ledge of the slope (LS).
Soil Horizon Particle size distribution (μm) Organic carbon pH Cation exchange capacity (CEC)
and exchangeable cations
CECcl Specific surface area (SSA) SSAcl
b2 2–20 20–50 50–200 200–2,000 CEC Ca2+
Mg2+
Na+
K+
g kg−1
g kg−1
cmol+ kg−1
cmol+ kg−1
m2
g−1
m2
g−1
TS A 373 470 109 21 27 35.40 4.3 6.37 0.71 0.24 0.18 0.02 – 16.0 –
B1 441 433 93 12 21 5.44 4.4 4.52 0.41 0.08 0.17 0.02 10.25 26.2 59.4
B2 497 382 85 12 24 2.13 4.5 6.56 0.32 0.08 0.09 0.03 13.20 36.8 74.0
C 474 398 86 16 26 2.05 4.7 6.69 0.42 0.12 0.09 0.03 14.11 34.7 73.2
MS A 359 493 111 13 24 17.51 4.2 4.36 0.18 0.10 0.16 0.10 – 11.8 –
B1 380 478 107 12 23 4.40 4.3 3.64 0.12 0.06 0.09 0.01 9.58 24.1 63.4
B2 441 433 92 11 23 2.73 4.7 5.55 0.46 0.18 0.09 0.02 12.59 34.1 77.3
C 461 413 92 11 23 2.44 4.7 6.34 0.45 0.15 0.10 0.02 13.75 32.3 70.1
LS A 255 490 142 37 76 15.23 4.4 3.68 1.55 0.39 0.14 0.02 – 9.9 –
B1 237 505 151 35 72 7.63 4.3 3.16 0.43 0.21 0.11 0.01 13.33 8.8 37.1
B2 322 485 118 21 54 5.24 4.6 3.30 1.10 0.18 0.08 0.02 10.25 16.6 51.6
C 378 449 99 25 49 6.15 4.4 4.35 0.79 0.16 0.11 0.02 11.51 15.7 41.5
48 B. D'Angelo et al. / Geoderma 223–225 (2014) 46–53
4. Fig. 2. X-ray diagrams of oriented deposits of the b2 μm material extracted from horizon B1 of the soil TS (a), MS (b) and LS (c) and from horizon C of the soil TS (d), MS (e) and LS (f) under room conditions (20 °C), after saturation with ethylene glycol
(EG), after heating at 170 °C and 500 °C.
49B.D'Angeloetal./Geoderma223–225(2014)46–53
5. 24.1 and 41.1 m2
g−1
for a clay fraction made of kaolinite, gibbsite,
goethite and hematite particles between 0.01 and 0.3 μm. Bruand and
Tessier (2000) discussed the water retention properties of French
clayey soils developed on a large range of clayey sediments and found
that SSAcl was between 50 and 130 m2
g−1
for a clay fraction made of
clay particles with a small number of layers (Robert et al., 1991).
3.2. Structure and porosity
The red soils studied show essentially a moderate to strong
subangular blocky structure 5 to 10 mm in size (Table 2), thus making
it easy to separate millimetric aggregates as defined by Bruand and
Prost (1987). Such a strong structure is consistent with the characteris-
tics described by Zhang and Zhang (1995) for red soils. Roots were
mainly located in the A and B1 horizons in TS and MS where the soils
were under a secondary forest vegetation and an orchard of orange
trees, respectively. In soil LS, roots remaining from the maize crop
were not observed.
In each soil, the bulk density was lower in the horizons A compared
to its value in the subsoil horizons because of the lesser development of
biological pores in the latter (Table 3). It ranged from 1.32 to 1.44 g cm–3
in soil TS, from 1.34 to 1.42 g cm3
in soil MS and from 1.45 to 1.46 g cm–3
in soil LS. These values are close to those reported by Vogel et al. (1995)
for red reference clay soils of the Yunnan Province. The bulk densities
recorded for the top horizon in soils TS, MS and LS are similar to those
recorded for many topsoils of red soils under different soil manage-
ments in southern China (e.g. Huang et al., 2004a,b, 2010; Zheng et al.,
2008) but the clay content was often less than 30% in the soils studied.
These bulk densities are also close to those recorded by Bruand and
Tessier (2000) for French clay soils with both a large clay content and
mineralogy range.
The volume of macropores and micropores in the soil at the sam-
pling date (i.e. close to field capacity) was computed by using the bulk
density of the horizon and the bulk density of the millimetric aggregates
(Bruand and Prost, 1987). Thus, the specific volume of macropores in
conditions close to field capacity (VM
FC
) was obtained by subtracting the
specific volume of the millimetric aggregates (reciprocal of their bulk
density) from the specific volume of the horizons (reciprocal of their
bulk density) (Table 3). The results showed that VM
FC
decreases strongly
with depth in the three soils studied (Table 3). Such results are consis-
tent with the few or very few roots recorded in horizons B1, B2 and C
of these soils (Table 2). The volume of micropores at field capacity
VM
FC
and after air drying Vm
AD
was computed by subtracting the specif-
ic volume of the solid phase which is equal to the reciprocal of the
particle density, the latter being considered as equal to 2.65 g cm−3
(1/2.65 g cm−3
= 0.377 cm3
g−1
) (Bruand and Prost, 1987), from the
specific volume of the millimetric aggregates (Table 2). The results
showed that VM
FC
is smaller in the subsoil (horizons B1, B2 and C) than
in horizon A for each soil. In the subsoil, VM
FC
ranges from 0.239 to
0.297 cm3
g−1
and Vm
AD
from 0.208 to 0.264 cm3
g−1
. In clay soils the vol-
umes of micropores result mainly from the assemblages of the clay par-
ticles in the soil material (Fiès and Bruand, 1990, 1998). We therefore
computed the volume of micropores developed by the clay phase
close to field capacity (VFC
mclay
in cm3
per g of clay) and after air-drying
(VAD
mclay
in cm3
per g of clay) as follows:
V
FC
mclay
¼ V
FC
m =CC
 1; 000;
V
AD
mclay
¼ V
AD
m =CC
 1; 000:
The average VFC
mclay
and VAD
mclay
computed with the data presented in
Tables 1 and 3 for horizons B and C with CC N300 g kg−1
are 0.663
and 0.584 cm3
per g of clay, whereas the corresponding values for a
horizon B from a French red clay soil are 0.488 and 0.327 cm3
per g of
clay, respectively (Bruand and Prost, 1987). This corresponds to an
11% decrease in the average micropore volume of the clay phase
between field capacity and air-drying for the Chinese red clay soils
studied, compared to 33% for the clay soil studied by Bruand and Prost
(1987). Thus the clay fabric which corresponds to both volume of clay
particles and associated pore volume resulting from their assemblage
shrinks much less between field capacity and air-drying in the Chinese
red clay soils studied than in the French clay soil studied by Bruand
and Prost (1987).
3.3. Water retention properties
The amounts of water retained at −60, −100, −330, −1,000,
−3,300 and −15,000 hPa water potential for the different horizons
studied are given in Table 4. The water content at the sampling date
corresponded to a water potential between −100 and −330 hPa,
thus confirming that the soil was close to field capacity during sampling
(Al Majou et al., 2008a). The variance in water retained at −60, −100,
−330 hPa water potential is explained mainly by the specific volume of
the horizon (reciprocal of the bulk density) with R2
= 0.863, 0.826 and
0.646, respectively. At −15,000 hPa water potential, the maximum
variance in water retained is explained by the clay content (R2
=
0.851), while the specific volume of the horizon explained only a
small proportion of the variance. Such a high proportion of variance
explained by the specific volume and the clay content of the horizon
Table 2
Morphological characteristics of the horizons in soil TS, soil MS and soil LS.
Pits Horizons Depth (cm) Matrix Munsell color Structure Root densitya
Wet Dry Type Gradeb
Size (mm)
TS A 3–10 7.5YR 3/3 10YR 5/4 Granular 3 1–5 4
B1 10–40 5YR 5/6 7.5YR 6/6 Subangular blocky 3 5–10 3
B2 40–80 5YR 4/6 5YR 5/6 Subangular blocky 3 5–20 1
C 80–100 5YR 4/6 5YR 5/8 Subangular to angular blocky 2 5–10 1
MS A 0–10 5YR 4/4 5YR 7/3 Granular to subangular blocky 3 1–5 3
B1 10–40 5YR 4/4 5YR 7/4 Subangular blocky 3 5–10 2
B2 40–80 5YR 4/6 5YR 7/4 Subangular blocky 3 5–15 1
C 80–100 5YR 3/6 5YR 7/4 Subangular blocky 2 5–20 1
LS A 0–15 7.5YR 4/6 10YR 5/4 Subangular blocky 2 5–15 0
B1 15–35 7.5YR 5/6 7.5YR 6/6 Subangular blocky 2 5–30 0
B2 35–65 7.5YR 5/6 7.5YR 6/6 Subangular blocky 2 5–30 0
C 65–90 7.5YR 5/6 7.5YR 6/6 Subangular blocky 1 5–30 0
a
Root frequency: 0 = very few (b1 root in each horizontal 100 cm2
surface area); 1 = few (b1 to 5 roots in each horizontal 100 cm2
surface area); 2 = moderate (5 to 10 roots in each
horizontal 100 cm2
surface area); 3 = numerous (10 to 50 roots in each horizontal 100 cm2
surface area); and 4 = highly numerous (N50 roots in each horizontal 100 cm2
surface area).
b
Grade: 1 = weak; 2 = moderate; and 3 = strong.
50 B. D'Angelo et al. / Geoderma 223–225 (2014) 46–53
6. at high and low water potential, respectively, was earlier recorded by
Bruand (1990) and Bruand et al. (1988) for clayey soils.
For the horizon with a clay content N300 g kg−1
, we computed the
available water which corresponds to the amount of water available
between −330 and −15,000 hPa water potential (Table 5). It ranged
from 0.0091 to 0.166 cm3
cm−3
in the soils studied here. These values
are consistent with those recorded in many other clay horizons originat-
ing from soils located in different countries (Table 5). The average avail-
able water measured for the Chinese red clay soils of this study is
however slightly greater (0.121 cm3
cm−3
) than for the 1203 clayey
soils from the literature (0.113 cm3
cm−3
) (Table 5). The available
water between −3,300 and −15,000 hPa reported in the literature
for Chinese red clay soils is much greater (average of 0.222 cm3
cm−3
)
but the soils selected were mainly topsoils (Table 5).
Although the available water between −3,300 and −15,000 hPa of
the Chinese red clay soils studied appears to be slightly greater than clay
soils from other countries, a much greater proportion of water available
between −3,300 and −15,000 hPa compared to the water available be-
tween −330 and −15,000 hPa was recorded for these Chinese red clay
soils than for clay soils originating from other countries (Table 5). This
proportion ranged from 0.520 to 0.753 in the Chinese red clay soils of
this study (average of 0.620), from 0.535 to 0.620 in the Chinese red
clay soils from the literature (average of 0.591), and from 0.285 to
0.425 in the 1203 clay soils from other countries (average of 0.366)
(Table 5). This indicates that for a given available water amount, the
proportion of water weakly available is much greater in Chinese red
clay soils than in clay soils originating from other countries, the total
available water being just slightly greater for the former. This might
explain the high sensitivity to drought of the Chinese red clay soils
during the dry season as pointed out by Wang (1997) and Zhao (2002).
In most clay soils, a proportion of water is released at low water
potential by the clay phase concomitantly to its shrinkage (Bruand
and Prost, 1987). The millimetric aggregates originating from the red
clay soils studied showed little shrinkage between field capacity and
air-drying (Table 2). Such a small shrinkage which reflects a stiffness
of the microstructure is likely related to the high proportion of non-
active clays as revealed by the cation exchange capacity and the X-ray
diffraction patterns (Table 1 and Fig. 2) and the presence of aluminum
and iron oxy-hydroxides as revealed by the soil color but not studied
here. This small shrinkage and the high proportion of poorly available
water might also be related to the long hydric stress history of the
Chinese red clay soils as discussed by Bruand and Tessier (2000) for a
large set of French clayey soils developed on clayey sediments. Accord-
ing to their results and those recorded earlier by Tessier and Pédro
(1987) on pure clays, the water retention properties of clayey soils ap-
pear to be mainly affected by the greatest effective stress recorded by
the soil, the proportion of poorly available water compared to the
total amount of available water increasing with the effective stress re-
corded. The parent materials of the Chinese red clay are mainly Quater-
nary continental sediments which reorganize material resulting from
Table 3
Bulk density of the horizons (cylinder method) at sampling date and of millimetric aggregates (kerosene method) at sampling date and after air-drying (standard deviation between
brackets).
Soil Horizon Bulk density at sampling date Bulk density after air-drying Volume of pores at sampling date Volume of micropores in
the dried soil material
(1/c)–0.377
Horizon (a) Millimetric aggregates (b) Millimetric aggregates (c) Macropores (1/a)–(1/b) Micropores (1/b)–0.377
g cm−3
g cm−3
cm3
g−1
cm3
g−1
TS A 1.04 (0.04) 1.37 (0.06) 1.49 (0.04) 0.232 (0.018) 0.353 (0.022) 0.294
B1 1.32 (0.06) 1.51 (0.01) 1.56 (0.02) 0.094 (0.006) 0.287 (0.004) 0.264
B2 1.39 (0.03) 1.57 (0.06) 1.67 (0.01) 0.082 (0.014) 0.260 (0.023) 0.222
C 1.44 (0.03) 1.62 (0.01) 1.71 (0.02) 0.078 (0.005) 0.239 (0.002) 0.208
MS A 1.07 (0.01) 1.44 (0.02) 1.52 (0.03) 0.240 (0.016) 0.318 (0.011) 0.281
B1 1.34 (0.07) 1.52 (0.01) 1.59 (0.01) 0.087 (0.008) 0.282 (0.001) 0.252
B2 1.39 (0.03) 1.49 (0.05) 1.59 (0.02) 0.045 (0.014) 0.297 (0.023) 0.252
C 1.42 (0.04) 1.54 (0.03) 1.60 (0.02) 0.053 (0.016) 0.274 (0.012) 0.248
LS A 1.21 (0.03) 1.45 (0.03) 1.52 (0.03) 0.137 (0.018) 0.313 (0.016) 0.281
B1 1.45 (0.09) 1.62 (0.02) 1.66 (0.03) 0.074 (0.007) 0.239 (0.007) 0.225
B2 1.46 (0.01) 1.53 (0.02) 1.61 (0.04) 0.033 (0.012) 0.275 (0.010) 0.244
C 1.45 (0.01) 1.50 (0.04) 1.60 (0.02) 0.024 (0.018) 0.289 (0.016) 0.248
Table 4
Water content at sampling date and water retention properties of the soils studied.
Soil Horizon Water content at sampling date Water retained at a water potential of (hPa)
−60 −100 −330 −1,000 −3,300 −15,000
g g−1
TS A 0.345 0.394 0.375 0.340 0.315 0.286 0.210
B1 0.273 0.289 0.278 0.252 0.234 0.215 0.175
B2 0.295 0.318 0.307 0.288 0.275 0.255 0.220
C 0.286 0.305 0.297 0.284 0.272 0.253 0.212
MS A 0.315 0.378 0.355 0.310 0.275 0.246 0.155
B1 0.265 0.281 0.275 0.261 0.249 0.234 0.172
B2 0.284 0.299 0.296 0.283 0.272 0.256 0.213
C 0.289 0.299 0.297 0.287 0.279 0.264 0.223
LS A 0.330 0.341 0.331 0.303 0.278 0.247 0.111
B1 0.258 0.265 0.261 0.246 0.233 0.212 0.106
B2 0.259 0.269 0.266 0.255 0.242 0.227 0.141
C 0.270 0.279 0.276 0.266 0.254 0.240 0.176
51B. D'Angelo et al. / Geoderma 223–225 (2014) 46–53
7. continental alteration from the Cretaceous or Eocene (BGMRHN, 1988;
Hu et al., 2010; Shi et al., 2010; Wilson et al., 2004a,b). Because of this
history, they were in all likelihood submitted to great hydric stresses,
thus leading to strongly consolidated clayey parent materials with con-
sequences for the soils such as a high proportion of poorly available
water, strong aggregation, and weak shrinkage properties (Bruand
and Tessier, 2000).
4. Conclusion
Our results show that the amount of water available between
−330 and −15,000 hPa water potential for the Chinese red clay
soils selected in the Taoyuan experimental station is consistent
with that recorded in many other clay soils and thus cannot explain
the high sensitivity of the Chinese red clay soils to drought. Although
many soil and plant characteristics can potentially be involved in the
high sensitivity of Chinese red clay soils to drought, the high propor-
tion of poorly available water which was characterized by the
amount of water available between −3,300 and −15,000 hPa
water potential compared to the available water between −330
and −15,000 hPa might explain this sensitivity to drought. Compar-
ison with clay soils located in different regions of the world and for
which a particular sensitivity to drought was not identified showed
that this proportion of poorly available water is indeed much greater
in the Chinese red clay soils studied. Finally, our results which were
recorded on a small number of soils need to be confirmed by studies
on a much larger range of Chinese red clay soils coming from differ-
ent areas. By providing more accurate knowledge of parent and soil
history, this would enable discussion of the amount of water avail-
able between −3,300 and −15,000 hPa water potential.
Table 5
Available water between −330 hPa (θ330) and −15,000 hPa (θ15,000) and proportion of this available water between −3,300 hPa (θ3300) and −15,000 hPa (θ15,000).
Origin of soils Reference Number of horizons Type of horizon Clay content θ330 θ3,300 θ15,000 (θ330–θ15,000) (θ3,300–θ15,000)/
(θ330–θ15,000)
% cm3
cm−3
This study
TS This study 1 Topsoil (A) 37 0.354 0.297 0.218 0.136 0.588
1 Subsoil (B1) 44 0.333 0.284 0.231 0.102 0.520
1 Subsoil (B2) 50 0.400 0.355 0.306 0.094 0.521
1 Subsoil (C) 47 0.409 0.364 0.305 0.104 0.567
MS This study 1 Topsoil (A) 36 0.332 0.263 0.166 0.166 0.584
1 Subsoil (B1) 38 0.350 0.314 0.230 0.120 0.700
1 Subsoil (B2) 44 0.393 0.356 0.296 0.097 0.619
1 Subsoil (C) 46 0.409 0.375 0.317 0.091 0.637
LS This study 1 Subsoil (B2) 32 0.372 0.331 0.206 0.166 0.753
1 Subsoil (C) 38 0.386 0.348 0.255 0.131 0.710
Average (this study) 0.121 0.620
Chinese red clay soils
China Cao and Zhu (1999) 1 n.d. n.d.a
0.251 0.198 0.137 0.114 0.535
Lu et al. (2004)b
1 Topsoil n.d.c
0.443 0.340 0.172 0.271 0.620
1 Topsoil n.d.d
0.447 0.331 0.151 0.296 0.608
1 Topsoil n.d.e
0.372 0.289 0.165 0.207 0.600
Average (Chinese red clay soils) 0.222 0.591
Clay soils from literature
Belgium Vereecken et al. (1989) 3 n.d. N35 0.439 0.340 0.293 0.109 0.285
Brazil Reatto et al. (2007) 1 Subsoil 52 0.267 0.228 0.205 0.062 0.365
1 Subsoil 61 0.263 0.226 0.208 0.049 0.328
1 Subsoil 75 0.265 0.232 0.216 0.049 0.339
1 Subsoil 55 0.277 0.233 0.206 0.071 0.371
1 Subsoil 78 0.287 0.256 0.239 0.048 0.352
China Qu et al. (2009) 1 Subsoil 32 0.338 0.244 0.202 0.136 0.308
1 Subsoil 32 0.429 0.372 0.343 0.087 0.343
1 Subsoil 32 0.356 0.297 0.268 0.087 0.325
Europe Wösten et al. (1999) 21 Topsoil N60 0.489 0.390 0.336 0.153 0.358
217 Topsoil 35–60 0.404 0.324 0.279 0.125 0.357
596 Subsoil N60 0.407 0.338 0.298 0.108 0.368
132 Subsoil 35–60 0.471 0.404 0.363 0.109 0.378
France Al Majou et al. (2008b) 2 Topsoil N60 0.402 0.332 0.293 0.109 0.358
17 Topsoil 35–60 0.367 0.304 0.272 0.095 0.337
18 Subsoil N60 0.405 0.354 0.330 0.075 0.320
85 Subsoil 35–60 0.348 0.298 0.261 0.087 0.425
Portugal Gonçalves et al. (1997) 18 Topsoil and subsoil N40 0.372 0.302 0.263 0.110 0.359
38 Topsoil and subsoil 40–60 0.426 0.322 0.269 0.158 0.335
USA Schaap and Leij (1998) 34 Topsoil and subsoil N40 0.320 0.206 0.160 0.161 0.287
12 Topsoil and subsoil 35–55 0.376 0.241 0.181 0.195 0.306
Pucket et al. (1985) 1 Subsoil 33 0.321 0.287 0.272 0.049 0.316
1 Subsoil 34 0.351 0.325 0.313 0.038 0.308
1 Subsoil 35 0.356 0.319 0.297 0.060 0.368
Weighted average (clay soils from the literature) 0.113 0.366
a
Soil derived from a Quaternary red clay with a clay content ≥0.362 g kg−1
.
b
Estimated from soils I.1, I.2 and I.3 in Fig. 1.
c
Silty clay.
d
Clay.
e
Silty clay.
52 B. D'Angelo et al. / Geoderma 223–225 (2014) 46–53
8. Acknowledgment
We thank Wenxue Wei for help in soil sampling. This work was
supported by the National Basic Research Program of China (2011
CB100506) and the Labex Voltaire (ANR-10-LABX-100-01).
References
Al Majou, H., Bruand, A., Duval, O., 2008a. The use of in situ volumetric water content at
field capacity to improve the prediction of soil water retention properties. Can.
J. Soil Sci. 88, 522–541.
Al Majou, H., Bruand, A., Duval, O., Le Bas, C., Vautier, A., 2008b. Prediction of soil water
retention properties after stratification by combining texture, bulk density and the
type of horizon. Soil Use Manag. 24, 383–391.
Baize, D., 2000. Guide des analyses en pédologie. INRA, Paris (258 pp.).
Balbino, L.C., Bruand, A., Brossard, M., Grimaldi, M., Hajnos, M., Guimarães, M.F., 2002.
Changes in porosity and microaggregation in clayey Ferralsols of the Brazilian
Cerrado on clearing for pasture. Eur. J. Soil Sci. 53, 219–230.
Baligar, V.C., Fageria, N.K., Eswaran, H., Wilson, M.J., Zhenli, He, 2004. Nature and
properties of red soils of the world. In: Wilson, M.J., He, Zhenli, Yang, Xiaoe (Eds.),
The red soils of China. Their nature, management and utilization. Kluwer Academic
Publishers, The Netherlands, pp. 7–27.
Bruand, A., 1990. Improved prediction of water-retention properties of clayey soils by
pedological stratification. J. Soil Sci. 41, 491–497.
Bruand, A., Prost, R., 1986. Apport des méthodes d'enrichissement sélectives et des
spectrométries à l'identification des constituants minéraux d'un échantillon de sol.
Agronomie 6 (8), 717–726.
Bruand, A., Prost, P., 1987. Effect of water content on the fabric of a soil material: an
experimental approach. J. Soil Sci. 38, 461–472.
Bruand, A., Prost, P., 1988. Analyse minéralogique quantitative d'un échantillon de sol:
utilisation des données concernant la composition chimique de l'échantillon.
Agronomie 8 (1), 15–22.
Bruand, A., Tessier, D., 2000. Water retention properties of the clay in soils developed on
clayey sediments: significance of parent material and soil history. Eur. J. Soil Sci. 51,
679–688.
Bruand, A., Tessier, D., Baize, D., 1988. Contribution à l'étude des propriétés de rétention
en eau des sols argileux: importance de la phase argileuse. C.R. Acad. Sci. 307 (Série
II), 1937–1941.
Brunauer, S., Emmett, P.H., Teller, E., 1938. Adsorption of gases in multimolecular layers.
J. Am. Chem. Soc. 60, 309–319.
Bureau of Geology and Mineral Resources of Hunan province (BGMRHN), 1988. Regional
Geology of the Hunan Province. Publishing House, Beijing (507 pp.).
Cao, Z., Zhu, X., 1999. Aspects of red soils properties and water management in China. Int.
Agrophys. 13, 1–5.
Ciesielski, H., Sterckeman, T., 1997. Determination of cation exchange capacity and
exchangeable cations in soils by means of cobalt hexamine trichloride. Effects of
experimental conditions. Agronomie 17, 1–7.
Cooperative Research Group of Chinese Soil Taxonomy (CRG-CST), 2001. Chinese Soil
Taxonomy. Science Press, Beijing, New York (203 pp.).
De Brito Galvão, T.C., Schulze, D.G., 1996. Mineralogical properties of a collapsible lateritic
soil from Minas Gerais, Brazil. Soil Sci. Soc. Am. J. 60, 1969–1978.
Fang, K., Chen, X.-M., Zhang, J.-B., Wang, B.-R., Huang, J., Du, Z.-J., 2010. The Hydraulic
Characteristics and Soil Reservoir of Typical Farmland in Red Soil Region. Chin.
J. Soil Sci. 41 (1), 23–27 (in Chinese).
Feller, C., Schouller, E., Thomas, F., Rouiller, J., Herbillon, A.J., 1992. N2-BET specific surface
area of some low activity clay soils and their relationships with secondary
constituents and organic matter contents. Soil Sci. 153, 293–299.
Fiès, J.C., Bruand, A., 1990. Textural porosity analysis of a silty clay soil using pore volume
balance estimation, mercury porosimetry and quantified backscattered electron
scanning image (BESI). Geoderma 47, 209–219.
Fiès, J.C., Bruand, A., 1998. Particle-size distribution and organization of the textural
porosity: study of clay–silt–sand mixtures. Eur. J. Soil Sci. 49, 557–567.
Gonçalves, M.C., Pereira, L.S., Leij, F.J., 1997. Pedo-transfer functions for estimating
unsaturated hydraulic properties of Portuguese soils. Eur. J. Soil Sci. 48, 387–400.
He, Z., Zhang, M., Wilson, M.J., 2004. Challenges in the management and utilization of red
soils. In: Wilson, M.J., He, Zhenli, Yang, Xiaoe (Eds.), The Red Soils of China: Their
Nature Management and Utilization. Kluwer Academic Publishers, Netherlands,
pp. 163–170.
Hong, H., Gu, Y., Yin, K., Zhang, K., Li, Z., 2010. Red soils with net-like veins and their
climate significance in south China. Geoderma 160, 197–207.
Hu, X.F., Wei, J., DU, Y., Xu, L.F., Wang, H.B., Zhang, G.L., Ye, W., Zhu, L.D., 2010. Regional
distribution of the Quaternary red clay with aeolian characteristics in subtropical
China and its paleoclimatic implications. Geoderma 159, 317–334.
Huang, D.Y., Wang, K.L., Huang, M., Chen, H.S., Wu, J.S., Zhang, G.P., Peng, T.B., 2004a.
Seasonal drought problems in the red soil hilly region of the middle subtropical
zone of China. Acta Ecol. Sin. 24 (11), 2516–2523 (in Chinese).
Huang, Y., Wang, H., Zou, D.S., Feng, Z.W., Huang, H., Wang, S.L., 2004b. Effects of planting
Eulaliopsis binate on soil quality in the red soil region of southern China. Soil Use
Manag. 20, 150–155.
Huang, Z.n, Ouyang, Z., Li, F., Zheng, H., Wang, X., 2010. Response of runoff and soil loss to
reforestation and rainfall type in red soil region of southern China. J. Environ. Sci. 22,
1765–1773.
IUSS Working Group WRB, 2007. World Reference Base for Soil Resources 2006, first
update 2007. World Soil Resources Reports No. 103. FAO, Rome (116 pp.).
Jing, Y.S., Zhang, B., Thimm, A., Zepp, H., 2008. Anisotropy of soil hydraulic properties
along arable slopes. Pedosphere 18, 353–362.
Lu, J., Huang, Z., Xi, Y., 2004. Soil water holding and supplying capacities in the hilly red
soils region southern China. In: Wilson, M.J., He, Zhenli, Yang, Xiaoe (Eds.), The red
soils of China. Their nature, management and utilization. Kluwer Academic
Publishers, The Netherlands, pp. 129–136.
Monnier, G., Stengel, P., Fiès, J.C., 1973. Une méthode de mesure de la densité apparente
de petits agglomérats terreux: application à l'analyse des systèmes de porosité du
sol. Ann. Agronomiques 24, 533–545.
Pucket, W.E., Dane, J.H., Hajek, B.F., 1985. Physical and mineralogical data to determine
soil hydraulic properties. Soil Sci. Soc. Am. J. 49, 831–836.
Qu, Z., Huang, G., Yang, J., 2009. Evaluation of regional pedotransfer functions based on
the BP neural networks. In: Li, D., Chunjiang, Z. (Eds.), IFIP International Federation
for Information Processing, Volume 294, Computer and Computing Technologies in
Agriculture II, Volume 2. Springer, Boston, pp. 1189–1199.
Reatto, A., Bruand, A., Silva, E.M., Martins, E.S., Brossard, M., 2007. Hydraulic properties of
the diagnostic horizon of latosols of a regional toposequence across the Brazilian
Central Plateau. Geoderma 139, 51–59.
Reatto, A., Bruand, A., Silva, E.M., Guégan, R., Cousin, I., Brossard, M., Martins, E.S., 2009.
Shrinkage of microaggregates in Brazilian Latosols during drying: significance of the
clay content, mineralogy and hydric stress history. Eur. J. Soil Sci. 60, 1106–1116.
Robert, M., Tessier, D., 1974. Méthodes de preparation des argiles des sols pour les études
minéralogiques. Ann. Agronomiques 25, 879–882.
Robert, M., Hardy, M., Elsass, F., 1991. Crystallochemistry, properties and organization of
soil clays derived from major sedimentary rocks in France. Clay Miner. 26, 409–420.
Schaap, M.G., Leij, F.J., 1998. Database-related accuracy and uncertainty of pedotransfer
function. Soil Sci. 163, 765–779.
Shi, X.Z., Yu, D.S., Xu, S.X., Warner, E.D., Wang, H.J., Sun, W.X., Zhao, Y.C., Gong, Z.T., 2010.
Cross reference for relating Genetic Soil Classification of China with WRB at different
scales. Geoderma 155, 344–350.
Soil Survey Staff, 2010. Keys to Soil Taxonomy, 11th ed. United States Department of
Agriculture, Natural Resources Conservation Service, Washington (338 pp.).
Tessier, D., Pédro, G., 1987. Mineralogical characterization of 2:1 clays in soils: importance
of the clay texture. In: Schultz, L.G., van Olphen, H., Mumpton, F.A. (Eds.), Proceedings
of the International Clay Conference, Denver, 1985. The Clay Minerals Society,
Bloomington, IN, pp. 78–84.
Vereecken, H., Maes, J., Feyen, J., Darius, P., 1989. Estimating the soil moisture retention
characteristics from texture, bulk density and carbon content. Soil Sci. 148, 389–403.
Vogel, A.W., Mingzhu, Wang, Xiaoqing, Huang, 1995. People's Republic of China: Red
Reference Soils of the Subtropical Yunnan Province. Soil Brief China 1. Institute of
Soil Science. Academica Sinica, Nanjing, and International Soil Reference and
Information Centre, Wageningen 27.
Wang, M., 1997. Study on Seasonal Drought in Southern China. Rural. Eco-Environ. 13 (2),
6–10 (in Chinese).
Wilson, M.J., He, Z., Yang, X., 2004a. Introduction and background. In: Wilson, M.J., He,
Zhenli, Yang, Xiaoe (Eds.), The Red Soils of China: Their Nature Management and Uti-
lization. Kluwer Academic Publishers, Netherlands, pp. 1–3.
Wilson, M.J., He, Z., Yang, X., 2004b. The nature, properties, distribution and classification
of red soils in China: synopsis and overview. In: Wilson, M.J., He, Zhenli, Yang, Xiaoe
(Eds.), The Red Soils of China: Their Nature Management and Utilization. Kluwer
Academic Publishers, Netherlands, pp. 5–6.
Wösten, J.H.M., Lilly, A., Nemes, A., Le bas, C., 1999. Development and use of a database of
hydraulic properties of European soils. Geoderma 99, 169–185.
Xu, R., Zhao, A., Li, Q., Kong, X., Ji, G., 2003. Acidity of red soils in a subtropical region of
southern China under field conditions. Geoderma 115, 75–84.
Zhang, B., Zhang, T., 1995. Cause of Seasonal Draught formation and Strategy of the
eastern hills in Southern China. Acta Ecol. Sin. 15 (4), 413–419 (in Chinese).
Zhang, M., Wilson, M.J., He, Z., 2004. Mineralogy of red soils in southern China in relation
to their development and charge characteristics. In: Wilson, M.J., He, Zhenli, Yang,
Xiaoe (Eds.), The Red Soils of China: Their Nature Management and Utilization.
Kluwer Academic Publishers, Netherlands, pp. 35–61.
Zhao, Q.G., 2002. Red soil material cycling and its regulation. Science, Beijing (in Chinese).
Zheng, H., Chen, F., Ouyang, Z., Tu, N., Xu, W., Wang, X., Miao, H., Li, X., Tian, Y., 2008.
Impacts of reforestation approaches on runoff control in the hilly red soil region of
southern China. J. Hydrol. 356, 174–184.
53B. D'Angelo et al. / Geoderma 223–225 (2014) 46–53