Colloid Mobility in Soils, Fundamental Pore Scale Mechanisms, Simplifications and Practical Relevance for Risk Analysis036 schaap, marcel
•
1 like•729 views

Recommended

Recommended
More Related Content
What's hot
What's hot (20)
Viewers also liked
Viewers also liked (17)
Similar to Colloid Mobility in Soils, Fundamental Pore Scale Mechanisms, Simplifications and Practical Relevance for Risk Analysis036 schaap, marcel
Similar to Colloid Mobility in Soils, Fundamental Pore Scale Mechanisms, Simplifications and Practical Relevance for Risk Analysis036 schaap, marcel (20)
More from National Institute of Food and Agriculture
More from National Institute of Food and Agriculture (20)
Recently uploaded
Recently uploaded (20)
Colloid Mobility in Soils, Fundamental Pore Scale Mechanisms, Simplifications and Practical Relevance for Risk Analysis036 schaap, marcel
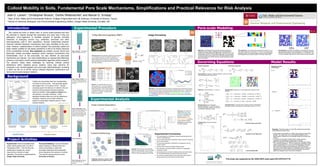
- 1. Josh D. Larsen1 , Christopher Brueck2 , Dorthe Wildenschild2 , and Marcel G. Schaap1 1 Dept. of Soil, Water and Environmental Science, College of Agriculture and Life Sciences, University of Arizona, Tucson. 2 School of Chemical, Biological, and Environmental Engineering (CBEE), Oregon State University, Corvallis, OR. Soil colloids are biotic or abiotic nano- to micron-scale particles that have the potential to migrate through the subsurface and pose risks if they are pathogenic micro-organisms, or facilitate transport of typically immobile chemicals of emerging concern (e.g. antibiotics, hormones and other pharmaceuticals used in farm operations). Several fundamental physical- chemical colloidal interaction mechanisms have been identified at the pore- scale. However, implementation of colloid transport into practically usable soil water models suitable for risk-based predictions is still at its infancy because of the complexities involved. Key questions are whether current column and field-scale models accurately represent colloid transport mechanisms that fundamentally occur at the pore-scale, but also whether all pore-scale mechanisms are relevant. Can valid simplifications be imposed that effectively enhance a soil water's model practical applicability regarding colloid transport? The research meets these challenges by resolving colloidal particle distributions within idealized porous systems, using near real-time 3D computed x-ray microtomography and pore-scale lattice-Boltzmann modeling in which we turn on or off the various colloidal interaction mechanisms and derive column-scale transport relations. This study was supported by the USDA-NIFA under grant 2014-67019-21718 Colloids are soil particles that have characteristics of solutes as well as solids. Their generally agreed size ranges from 1 nm to about 10 mm. Several processes govern the behavior of colloids in the soil and their surface physical chemical properties determine whether colloids attach or detach from soil particles or air-water interfaces. Under saturated conditions there are only two attachment conditions. However, the air-water interfaces present at unsaturated conditions lead to a more complex situation. Modified from DeNovio et. al., 2004 APS Synchrotron. 900 radiographs collected as sample rotates (In 16 minutes per scan with 1 s exposure). Resolution = 3.2 µm/pixel totally 8.6 GB per XMT scan. X-Ray attenuation follows Lambert-Beer Law where each material (air, KI-doped water, Ag-doped colloid, and glass beads) has unique linear attenuation coefficient, µ. X-Ray Microtomography (XMT) Modified from Wildenschild and Sheppard, 2013 0( ) x I x I e dI I dx Image Processing 33.37 keV 33.37 keV 25.61 keV Dry Scan A Scan B Scan Experimental Conclusions 1) The initial deposition of hydrophobic colloids in saturated glass bead columns is heterogeneous. 2) At near residual saturations, hydrophobic colloid clusters are shaped by the air-water interfaces 3) The total colloid deposition is dependent on drainage flow rate and moisture content. 4) Vertical profiles reveal that drainage mobilizes colloids. 5) Pore straining is a dominant retention mechanism for aggregated hydrophobic colloids. 6) Colloid attachment to air-water interfaces and air-water-solid contact line are equally important at medium to high water contents. 7) The number of colloids trapped by the disconnected water phase is/ directly proportional to the volume of the DisW phase. Colloid Partitioning Initial Colloid Deposition 0.5 mL/hr 5.0 mL/hr 50.0 mL/hr Saturated Scans Residual Saturation Scans Step 1, Saturate. 1 M potassium iodide (KI) solution at 5 mL/hr Step 2, Deposit Colloids. 3 mL of 3 mg/mL colloid solution into columns by draining at 50 mL/hr (~2 PVs) Step 3, Desaturation. Three columns with three different flow rates (0.5, 5.0, 50.0 ml/hr) to reach desired saturation. Flow stopped, pressure equilibrated and XMT scan conducted. Step 4, Saturation 2. Step 4, Saturation N. Repeat until residual saturation is reached. C. Brueck Experimental Procedure XMT Scans. At each saturation two XMT scans are conducted (33.37 and 25.63 keV) to permit observations of solid phase, KI-doped water phase, Ag-coated colloids, and air. Together with a dry scan (empty pore space) and image processing a segmented 3D volume is reconstructed that unambiguously identifies the four phases. Colloid (clusters) are green; solids light blue; air dark blue; water is red. The system was shown to contain several Representative Elementary Volumes. System Properties Solid Phase Diameter 0.8 - 1.2 mm ζ (pH=9.5) w/o KI -43 mV ζ (pH=9.5) with KI - Contact Angle ~30° Colloid Mean Diameter 10 µm ζ (pH=9.5) w/o KI -32 mV ζ (pH=9.5) with KI - Contact Angle 135° Fluid Phase Ionic Strength 1 M pH 9.5 Glass Beads Colloids (Ag-coated Hollow Glass Spheres) Materials. We used glass beads as porous medium (size: 0.8 to 1.2 mm) and hydrophobic Ag-coated neutrally buoyant glass spheres as colloid models (size: 10 mm). These colloids are in principle resolvable with the observed XMT resolution (3.2 mm/pixel). In practice colloid clusters were observed. Experimental Analysis Partitioning. Depending on saturation colloids (aggregates) partition into different reservoirs. 5.0 ml/hr, S=0.56 5.0 ml/hr, S=0.06 Straining. Individual colloids are preferentially transported during drainage. Shown is the colloid cluster size before (S=0.96) and after drainage (S=0.05). This process happens at all flow rates. Partitioning. Depending on saturation colloids (aggregates) partition into different reservoirs. Partitioning. The amount of colloids near solid-water interfaces decreases with saturation, whereas the amount near the solid-air- water contact line increases. A minor amount of colloid (aggregates) is located near air-water interfaces. Introduction Solid-water interface (SWI) attachment Pore-straining/ Wedging Air-water interface (AWI) Attachment Air-water-solid (AWS) contact line attachment Immobilization in disconnected wetting (DisW) phase Film straining Saturated Conditions Unsaturated Conditions Modified from DeNovio et. al., 2004 Lead and Wilkenson, 2007 Background Colloid Mobility in Soils, Fundamental Pore Scale Mechanisms, Simplifications and Practical Relevance for Risk Analysis Examples. The three model runs with 200 colloids show favorable colloid attachment (top) under: ● A high solute concentration (0.1 Molar, top) resulting in little break through. The model was run for 0.5s (50,000 iterations) at 0.1 Molar solution, followed by 0.5s (50,000) iterations at 0.0001 Mol solution. ● Low solute concentration (0.0001 Molar, middle) showing significant and streamlined breakthrough of colloids. ● High concentration (0.1M ) followed by low ionic strength flushing (e.g. rainwater infiltration). This is a sequential combination of the solute concentrations of 1) and 2) but it is interesting to note that there are fewer colloids that breakthrough under this scenario than when 0.0001 Molar solution is simulated by itself. It seems to suggest that a number colloids have been strained, and are not able to be released under current flow conditions. Pore-scale Modeling 0.1 M 0.0001 M 0.1 → 0.0001 M Brownian Force Water flow. The fundamental process that drives the transport of colloids is the flow of water. Single-phase and multi-phase flow is simulated with Lattice Boltzmann (LB) models. Volumes of up to 1x10⁸ (single phase) and 20 x 106 (multi-phase) elements can be simulated in 2D and 3D mode. Shown above are a 1024x1024 synthetic volume with flow field (left) and a 64x64 volume for model development (right, used in this poster). Project Activities Experimental: Observe simplified multi- phase colloid systems with x-ray Micro Tomography (XMT). This will show the partitioning of colloids into various reservoirs as a function of water saturation. This activity is spearheaded by Oregon State University Pore-scale Modeling: Carry out individual- based modeling of colloids at the pore- scale by developing a model that accurately implements the fundamental forces that govern the behavior of colloids. This activity is being carried out at the University of Arizona Grid refinement. LB models produce grids of fluid velocity in x,y (z) with realistic resolutions in the order of 1-100 m. Even though this resolution is high, it is not high enough to resolve nm-sized colloids. We interpolate coarse-scale LB output to fine-scale colloid-scale. Fluid velocity Decomposition. In further computations it is important to know how far a particular location is from a solid phase. For facilitate numerical efficiency we decompose most force fields into x,y, (z) direction. This is a pre-computation step that only must be done once per simulation. Y distance (normal) X distance (transverse) Governing Equations Force balance. A change in colloid momentum is the sum of drag, colloidal and Brownian motion forces. Model Results Drag force. Due to fluid flow. ξ = 6π*μ*ac Correction terms. Correction terms a function of the non-dimensional gap distance which is normalized by colloid radius (Gao et. al. 2010). Brownian force. Due to molecular momentum transfer. ξ = 6π*μ*ac. G(0,1) = Gausian distribution (updates continuously). D0 is diffusion coefficient in water. Decomposition. Drag force in normal (transverse, left) and normal direction. Colloidal force. Governed by three potentals Electric Double Layer (EDL) Lifschitz-van der Waals (LW) Lewis Acid-Base (AB) Background solute concentration Transverse componentNormal component