
Recommended
Recommended
More Related Content
What's hot
What's hot (19)
Similar to TRBAM2020 Public Transit posters - University of Twente.
Similar to TRBAM2020 Public Transit posters - University of Twente. (20)
Recently uploaded
Recently uploaded (20)
TRBAM2020 Public Transit posters - University of Twente.
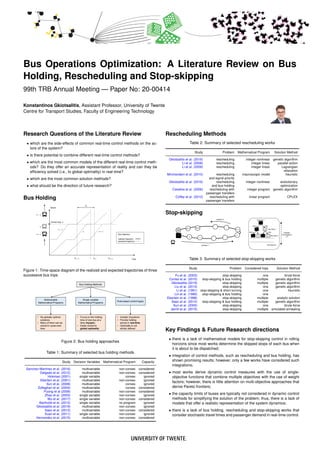
- 1. Bus Operations Optimization: A Literature Review on Bus Holding, Rescheduling and Stop-skipping 99th TRB Annual Meeting — Paper No: 20-00414 Konstantinos Gkiotsalitis, Assistant Professor, University of Twente Centre for Transport Studies, Faculty of Engineering Technology Research Questions of the Literature Review • which are the side-effects of common real-time control methods on the ac- tors of the system? • is there potential to combine different real-time control methods? • which are the most common models of the different real-time control meth- ods? Do they offer an accurate representation of reality and can they be efficiency solved (i.e., to global optimality) in real-time? • which are the most common solution methods? • what should be the direction of future research? Bus Holding Time Control stop, s 𝐻𝑠 𝑑 𝑛−1,𝑠 𝑡 𝑛 − 1 𝑛 𝑑 𝑛,𝑠 𝑛 + 1 Bus trajectory realized trajectory expected trajectory 𝑛 − 1 𝑛 𝑛 + 1 Space ሚ𝑑 𝑛+1,𝑠 Figure 1: Time-space diagram of the realized and expected trajectories of three successive bus trips Bus Holding Methods Multivariable Mathematical Programs Single-variable Mathematical Programs Rule-based control logics • No globally optimal solutions • Many of them can be solved in quasi-real- time • Focus on the holding time of one bus at a time (myopic) • Easily solved to global optimality • Analytic Equations • Provide holding advice in real-time • Optimality is not strictly defined Figure 2: Bus holding approaches Table 1: Summary of selected bus holding methods Study Decision Variables Mathematical Program Capacity Sanchez-Martinez et al. (2016) multivariable non-convex considered Delgado et al. (2012) multivariable non-convex considered Hickman (2001) single variable convex ignored Eberlein et al. (2001) multivariable non-convex ignored Sun et al. (2008) multivariable convex ignored Zolfaghari et al. (2004) multivariable convex considered Puong et al (2008) multivariable non-convex considered Zhao et al. (2003) single variable non-convex ignored Wu et al. (2017) single variable non-convex considered Bartholdi et al. (2012) single variable no program ignored Gkiotsalitis et al. (2019) multivariable non-convex ignored Saez et al. (2012) multivariable non-convex considered Xuan et al. (2011) single variable non-convex ignored Hernandez et al. (2015) multivariable non-convex considered Rescheduling Methods Table 2: Summary of selected rescheduling works Study Problem Mathematical Program Solution Method Gkiotsalitis et al. (2016) rescheduling integer nonlinear genetic algorithm Li et al. (2008) rescheduling integer linear parallel action Li et al. (2009) rescheduling integer linear Lagrangian relaxation Mirchandani et al. (2010) rescheduling macroscopic model heuristic and signal priority Gkiotsalitis et al. (2016) rescheduling integer nonlinear evolutionary and bus holding optimization Cevallos et al. (2006) rescheduling with integer program genetic algorithm passenger transfers Coffey et al. (2012) rescheduling with linear program CPLEX passenger transfers Stop-skipping Bus stop 1 Bus stop 2 serve skip skip Bus stop 3 serve Bus stop |S| Possible Combinations: 2|S| 1 |S| |S|-1 |S|-2 s’+1 s’ 2 3 direction 1 direction 2 Table 3: Summary of selected stop-skipping works Study Problem Considered trips Solution Method Fu et al. (2003) stop-skipping one brute-force Cortes et al. (2010) stop-skipping & bus holding multiple genetic algorithm Gkiotsalitis (2019) stop-skipping multiple genetic algorithm Liu et al. (2013) stop-skipping one genetic algorithm Li et al. (1991) stop-skipping & short-turning one heuristic Lin et al. (1995) stop-skipping & bus holding one − Eberlein et al. (1998) stop-skipping multiple analytic solution Saez et al. (2012) stop-skipping & bus holding multiple genetic algorithm Sun et al. (2005) stop-skipping one brute-force Jamili et al. (2015) stop-skipping multiple simulated annealing Key Findings & Future Research directions • there is a lack of mathematical models for stop-skipping control in rolling horizons since most works determine the skipped stops of each bus when it is about to be dispatched; • integration of control methods, such as rescheduling and bus holding, has shown promising results; however, only a few works have considered such integrations; • most works derive dynamic control measures with the use of single- objective functions that combine multiple objectives with the use of weight factors; however, there is little attention on multi-objective approaches that derive Pareto frontiers; • the capacity limits of buses are typically not considered in dynamic control methods for simplifying the solution of the problem; thus, there is a lack of models that offer a realistic representation of the system dynamics; • there is a lack of bus holding, rescheduling and stop-skipping works that consider stochastic travel times and passenger demand in real-time control.
- 2. A Model for Real-Time Bus Holding subject to Vehicle Ca- pacity Limits 99th TRB Annual Meeting — Paper No: 20-00102 Konstantinos Gkiotsalitis, Assistant Professor, University of Twente Eric C. van Berkum, Professor, University of Twente Research Contribution • An easy-to-solve mathematical program for the bus holding problem under capacity limitations that can determine (immediately) the holding time of a bus trip upon its arrival at a bus stop. • The proposed model is the first of its kind and is based on the modeling of the real-time bus holding problem as a regularity-based optimization prob- lem under bus load variations and capacity limitations. Assumptions • In high-frequency services, passengers who cannot board a bus will wait for the next trip of the same bus line because their waiting times are relatively small. • Passengers cannot coordinate their arrivals at stops to the arrival times of buses at high-frequency services. Thus, we assume a demand-based passenger arrival rate, λs, at any stop s. • The allowed holding time of buses at stops has an upper (maximum) limit, ζ, due to the inconvenience caused to on-board passengers. Problem Formulation Time Control stop, s 𝐻𝑠 𝑑 𝑛−1,𝑠 𝑡 𝑛 − 1 𝑛 𝑑 𝑛,𝑠 𝑛 + 1 Bus trajectory realized trajectory expected trajectory 𝑛 − 1 𝑛 𝑛 + 1 Space ሚ𝑑 𝑛+1,𝑠 Figure 1: Realized and expected trajectories of the preceding, n−1, and follow- ing, n + 1, bus trip of n for which we need to decide its holding time at stop s. ( ˜Q) min x,ν1,ν2 f(x, ν1, ν2) s.t. (f) (f) satisfies Eq.(2) ν1 ≥ 0 ν1 ≥ φn + xλs − cn ν2 ≥ 0 ν2 ≥ ˜ln+1 − ˜βn+1 − cn+1 + ˜βn+1taλs + ν1 + (˜an+1,s − t − x)λs k 0 ≤ x ≤ ζ (1) where f(x, ν1, ν2) := t + x − dn−1,s − Hs 2 + ˜an+1,s + ˜βn+1ta + ˜βn+1taλs + ν1 + (˜an+1,s − t − x)λs ktb − ν2tb − t − x − Hs 2 + M1ν1 + M2ν2 (2) • our reformulated mathematical program strives to minimize the difference between the actual and the target headways while reducing the number of refused passenger boardings due to capacity limitations. • Program ( ˜Q) is proven to be convex and a locally optimal solution is also a globally optimal one. • this formulation is the first that produces a globally optimal solution when considering the vehicle capacity limits. Numerical Experiments Choa Chu Kang Loop - Choa Chu Kang Int (44009) Yew Tee Stn (45321) Opp Blk 666 (45421) Bus Line 302 Bus stop Control point stop Terminal bus line direction Figure 2: Topology and bus stops of bus line 302 in Singapore dn−1,s − (t + x) (t + x) − ˜dn+1,s 80 120 160 200 240 280 120 292.74 headway(s) Headways at do-nothing dn−1,s − (t + x) (t + x) − ˜dn+1,s 80 120 160 200 240 280 target headway, Hs 198.86 203.6 headway(s) Headways after holding trip n trip n+1 10 20 30 40 50 60 70 80 47 50 do-nothing passengers Bus load when departing stop s trip n trip n+1 10 20 30 40 50 60 70 80 vehicle capacity 52 45 holding passengers Bus load when departing stop s Figure 3: Headways and bus loads at stop s in the do-nothing case (left sub- figures) and in the case where we apply the holding suggested by our model (right sub-figures) I II III IV V VI VII VIII 40 50 60 70 80 90 100 scenario Busload(passengers) trip n our holding logic classical holding logic of Fu and Yang (2002) vehicle capacity I II III IV V VI VII VIII 40 50 60 70 80 90 100 scenario Busload(passengers) trip n + 1 our holding logic alg.1 vehicle capacity Figure 4: Bus load of trip n when it departs from stop s with the implementation of our holding logic and the classical holding logic of Fu and Yang 2002. Key Findings • our proposed bus holding approach can improve the squared headway de- viation by up to 82% compared to the case of no holding. • we reduce the number of refused boardings due to vehicle capacity limita- tions compared to classical bus holding logics, such as Fu and Yang (2002).
- 3. Robust Bus Scheduling considering Transfer Synchroniza- tions 99th TRB Annual Meeting — Paper No: 20-00085 Konstantinos Gkiotsalitis, Assistant Professor, University of Twente Oskar A.L. Eikenbroek, PhD Candidate, University of Twente Oded Cats, Associate Professor, Delft University of Technology Research Contribution Our work considers the potential variability in the travel times and dwell times of daily trips and has the following additional features: • is concerned with tactical planning, in particular bus timetabling (i.e., offline optimization of the dispatching times of the daily trips); • it has a dual objective and minimizes the regularity of individual bus lines while ensuring the synchronization of trips at the transfer stops; • considers operational regulatory constraints such as schedule sliding pre- vention and layover time limits. Assumptions • the number of bus trips per line is decided during the frequency settings phase; • bus trips from the same line are not expected to overtake one another; • the actual travel times and dwell times of bus trips can deviate from their expected values. Problem Formulation min x max ξ,ζ f(x, ξ, ζ) (1) s.t.: x ∈ F(ξ, ζ) = {satisfy layover and schedule sliding constraints} (2) xl,1 = δmin l , ∀l ∈ L (3) ξmin l,s ≤ ξl,n,s ≤ ξmax l,s , ∀l ∈ L, ∀n ∈ N(l), ∀s ∈ S(l) {1} (4) ζmin l,s ≤ ζl,n,s ≤ ζmax l,s , ∀l ∈ L, ∀n ∈ N(l), ∀s ∈ S(l) (5) where • The minimax problem states that we want to find the scheduling option with the best performance at the worst-case scenario. • x are the bus scheduling changes at different bus lines (decision variables). • ξ, ζ are the travel time and dwell time noises which are the adversary of our system and appear as variables with bounded values. • f(x, ξ, ζ) is our objective function which is convex and indicates (i) the network-wide excessive waiting times of passengers, and (ii) the waiting times at transfer stops. Problem Solution with Alternating Optimization For a given noise instance (ξk , ζk ), the corresponding optimization problem ( ˜P(ξk , ζk )) min x f(x, ξk , ζk ) s.t. {x | x satisfies all related constraints} is an easy to solve convex program and has always a feasible solution. The worst-performing scenario for such solution can be determined from the maximization problem with parameter xk : (P(xk )) : max ξ,ζ ˜f(xk , ξ, ζ) s.t.: ξmin l,s ≤ ξl,n,s ≤ ξmax l,s , ∀l ∈ L, ∀n ∈ N(l), ∀s ∈ S(l) {1} ζmin l,s ≤ ζl,n,s ≤ ζmax l,s , ∀l ∈ L, ∀n ∈ N(l), ∀s ∈ S(l) (6) This can be summarized in the following algorithm: Step 0: Choose initial solution guess x1 that satisfies all constraints and set k := 1; Step 1: Solve P(xk ) and obtain (ξk , ζk ); Step 2: Solve ˜P(ξk , ζk ) for (ξk , ζk ) and obtain xk+1 , set k := k + 1; Step 3: If the performance of the most recent solutions is stabilized, STOP. Else, go to Step 1. ,WHUDWLRQV 9DOXHRIWKHSHQDOL]HGREMHFWLYHIXQFWLRQVHF2
- 4. H %RXQGHGZRUVWFDVHSHUIRUPDQFHRIPRVWUREXVWVROXWLRQ 6ROXWLRQSHUIRUPDQFHRQZRUVWFDVHQRLVH 3HUIRUPDQFHRIQHZVROXWLRQVXEMHFWWRWKHSUHYLRXVZRUVWFDVHQRLVH Figure 1: Convergence of the alternating optimization. The robust solution re- duces the worst-case objective function value to 0.701E+10 Case Study Gullmarsplan Essingetorget Frihamnen Radiohuset common bus stops --- bus line 1 --- bus line 4 Figure 2: Bus lines 1 and 4 in Stockholm median upper whisker −5 0 5 10 15 5.17 5.52 −1.72 7.13 Improvement(%) (a) Average Excessive Waiting Time per passenger Design (ii) Design (iii) median upper whisker 0 20 40 28.18 3.4 −0.92 11.31 Improvement(%) (b) Average Waiting Time for Transferring Design (ii) Design (iii) Figure 3: Validation results: investigating the potential improvement of robust designs to mild (ii) and extreme (iii) disruptions compared to the designed schedule for the average case. Key Findings • it is clear that there is a trade-off between: (a) robust designs that impose stricter limits to the adversary and result in solutions that perform better at common-case scenarios, and (b) robust designs that prepare for a wide-range of values of the adversary and overperform at extreme-case scenarios. • designed schedules for the average case can be improved by 5.17% in terms of regularity and 28.2% in terms of transfer times.
- 5. Periodic Stop-skipping: NP-Hardness and Computational Limitations 99th TRB Annual Meeting — Paper No: 20-00069 Konstantinos Gkiotsalitis, Assistant Professor, University of Twente Centre for Transport Studies, Faculty of Engineering Technology Research Contribution • the modeling, for the first time, of the dynamic stop-skipping problem as a rolling horizon optimization problem by expanding the classical formulation of Fu et al. (2003)1 ; • the mathematical analysis of the resulting integer nonlinear program and the proof of its NP-hardness; • the in-depth investigation of the scalability of the periodic stop-skipping problem with respect to the number of trips in the rolling horizon and the stop-skipping candidate stops. Assumptions • Buses that serve the same line do not overtake each other. This is a com- mon assumption in bus operations; • The passenger arrivals at stops are random because passengers cannot coordinate their arrivals with the arrival times of buses at regularity-based services; • The passenger demand at skipped stops is accommodated by the next bus trip of the same line; • Passengers use different door channels for boardings and alightings. Problem Objective f(x) := c1 |N| n=2 |S| s=1 (un,s − mn−1,s) hn,s 2 + mn−1,s hn−1,s 2 + hn,s + c2 |N| n=2 |S|−1 s=1 |S| y=s+1 bn,sy y z=s+1 (tn,z + (kn,z + δ)xn,z) + c3 |N| n=2 |S| s=2 (tn,s + (kn,s + δ)xn,s) (1) where the generalized cost of the objective function includes three terms. • The first term includes two components: (un,s − mn−1,s) hn,s 2 computes the total waiting time of the passengers who arrive after the departure (or passing) of bus n − 1 at stop s, assuming random arrivals with an average passenger waiting time equal to half the headway. The second compo- nent represents the total waiting time of those passengers who have been stranded by bus n − 1 (mn−1,s) and have to wait for an average amount of time equal to mn−1,s hn−1,s 2 + hn,s . • The second term of the objective function calculates the total in-vehicle time of passengers summed over all O-D pairs • and the final term computes the total bus trip time. Complexity and Solution Method • The rolling horizon stop-skipping problem is an NP-Hard decision problem. • Solution method: brute-force with an exponential computational complex- ity that requires to explore 2|N|×|S| potential solutions to obtain a globally optimal one, where |N| is the number of bus line trips and |S| the number of bus line stops. • Note: Other exact optimization approaches for combinatorial optimization include branch and bound (BB); however, in our case, BB is reduced to an exhaustive search because our 0-1 problem does not have a continuous relaxation. 1 Fu, L., Q. Liu, and P. Calamai, Real-time optimization model for dynamic scheduling of transit operations. Transportation Research Record, No. 1857, 2003, pp. 4855. Numerical Experiments Choa Chu Kang Loop - Choa Chu Kang Int (44009) Yew Tee Stn (45321) Opp Blk 666 (45421) Bus Line 302 Bus stops Terminal bus line direction Figure 1: Topology and bus stops of bus line 302 in Singapore Table 1: Computational costs in CPU minutes for different numbers of trips in the rolling horizon subject to the number of stop-skipping candidate stops. Stops Trips in the rolling horizon 1 2 3 4 5 6 7 8 3 0.00 0.00 2E-04 3E-03 0.02 0.26 2.05 25.61 4 0.00 0.00 0.01 0.37 18.23 121.71 10.00 10.00 5 0.00 0.01 0.42 82.36 10.00 10.00 10.00 10.00 6 0.00 0.13 315.66 10.00 10.00 10.00 10.00 10.00 7 0.00 1.74 10.00 10.00 10.00 10.00 10.00 10.00 8 0.00 23.72 10.00 10.00 10.00 10.00 10.00 10.00 9 0.00 10.00 10.00 10.00 10.00 10.00 10.00 10.00 10 0.00 10.00 10.00 10.00 10.00 10.00 10.00 10.00 11 2E-04 10.00 10.00 10.00 10.00 10.00 10.00 10.00 12 7E-04 10.00 10.00 10.00 10.00 10.00 10.00 10.00 13 2E-03 10.00 10.00 10.00 10.00 10.00 10.00 10.00 14 3E-03 10.00 10.00 10.00 10.00 10.00 10.00 10.00 15 7E-03 10.00 10.00 10.00 10.00 10.00 10.00 10.00 16 0.01 10.00 10.00 10.00 10.00 10.00 10.00 10.00 17 0.03 10.00 10.00 10.00 10.00 10.00 10.00 10.00 18 0.05 10.00 10.00 10.00 10.00 10.00 10.00 10.00 19 0.11 10.00 10.00 10.00 10.00 10.00 10.00 10.00 20 0.24 10.00 10.00 10.00 10.00 10.00 10.00 10.00 21 0.51 10.00 10.00 10.00 10.00 10.00 10.00 10.00 22 1.06 10.00 10.00 10.00 10.00 10.00 10.00 10.00 4 6 8 10 12 14 16 18 20 22 1 2 3 4 5 6 7 3 4 5 6 7 8 9 10 11 12 13 14 15 16 17 18 19 20 21 22 bus stops allowedtripsinthe rollinghorizon Figure 2: Maximum number of trips that can be in a rolling horizon subject to the number of stop-skipping candidates. Key Findings • To obtain a globally optimal solution within a reasonable time (i.e., less than 2 minutes) we need to consider only one trip in the rolling horizon. • For two trips or more, there should be a compromise with respect to the number of stop-skipping candidates. • Even if we use heuristics, the scalability issues persist (i.e., if we have 2 trips in the rolling horizon we can consider up to 12 stop-skipping candidates, instead of up to 7).
- 6. A Dynamic Model for Real-Time Track Assignment at Railway Yards 99th TRB Annual Meeting — Paper No: 20-00661 Bram B.W. Schasfoort, MSc, University of Twente Konstantinos Gkiotsalitis, Assistant Professor, University of Twente Oskar A.L. Eikenbroek, PhD Candidate, University of Twente Eric C. van Berkum, Professor, University of Twente Research Contribution • model the real-time track assignment problem (RT-TAP) • investigate real-time mathematical optimization techniques that aim to min- imize the total delays of outbound trains at a railway yard Assumptions • there is unlimited storage at a temporary yard that can temporarily accom- modate trains which cannot be assigned at the main yard, • trains do not need to be shunted, • there exists a feasible path to and from the yard, • each train is assigned to one and only one track and cannot be pre-empted, • each track is assigned at most one train, which does not exceed the track length. Problem Formulation RT-TAP is formulated as follows (the nomenclature can be found in our manuscript): min i∈N wi( ¯di − di) (1) subject to: k∈K j∈V xk ij = 1, i ∈ N (2) j∈V xk 0j = 1, k ∈ K (3) i∈V xk i,n+1 = 1, k ∈ K (4) i∈V xk ij − i∈V xk ji = 0, k ∈ K, j ∈ N (5) yk i ≥ ai, k ∈ K, i ∈ V (6) zk i = yk i + pi, k ∈ K, i ∈ N (7) zk j ≥ zk i + H − M(1 − xk ij), k ∈ K, (i, j) ∈ E (8) ¯di ≥ zk i , k ∈ K, i ∈ N (9) ¯di ≥ di, i ∈ N (10) li j∈V xk ij ≤ Lk, k ∈ K, i ∈ N (11) RT-TAP is an integer program (IP) with the objective to minimize the sum of the total weighted delay wi( ¯di − di) (non-negative by (10) so that - implicitly - ¯di is minimized, i.e., di = maxk∈K zk i ). Our formulation is a multi-commodity flow problem. Constraint (2) assures that each train i is only assigned once to a track. Constraints (3) and (4) assure that a schedule starts at (dummy) node 0 and ends at dummy train n + 1. (5) is so that for every train a (dummy) train is scheduled before and after it (on the same track). (6) ensures that we can only schedule trains after arrival. (7) is the latent departure time of train i on track k. (8) says that trains can only be scheduled after the previous train has departed, and requires a minimum headway H ≥ 0. Complexity and Solution Method We prove that (the static) TAP is NP-Hard by a polynomial-time reduction from the (1|ri| i Ci)-scheduling problem, which, on its turn, has a polynomial-time reduction from 3-PARTITION. Hence, we investigate different solution methods: • solving RT-TAP with CPLEX; • solving RT-TAP with a problem-specific Genetic Algorithm; • solving RT-TAP with a First-scheduled, First-served (FSFS) heuristic. Numerical Experiments Master Thesis – Bram Schasfoort – Concept 22.07.2019 31 Numerical Experiments. The following chapter aims to describe the application of the model on a numerical case study. The proposed solution method for efficient allocation of trains to tracks while reducing the delay is applied on the railway yard Waalhaven-zuid (Whz) which is located in the western part of the Netherlands. The method presented in previous chapter is written in the programming language C++. Reason for choosing C++ is the computational speed it has. Computational speed is important as the model needs to be run at real-time level. This chapter is structured as followed. In the first section a general case study description is given. This section is followed up by a discussion of which data was received, used, and which assumptions are made in the model input. In section 3, the established input is shown. In the 4th section, the model performance is measured at real-time level followed by a stochastic optimization of the scheduling problem. The final section describes the results measured in section 5 and 6. Case study description. The railway yard consists of about 100 tracks with each a function. The function for the tracks varies between processing, renting, passing through, shunting, repair and/or parking. At Whz, only the process tracks consist of electrical wiring and are Central Operated (in Dutch; Centraal Bediend Gebied (CBG)) and therefore can be controlled by the TD. Because main capacity problems related to the RT-TAP only consisted at the process tracks, only these tracks are considered for the case study. A schematic overview of the process tracks can be found in figure 8.1 (a more extensive overview can be found in appendix 5, 6 and 7). The characteristics of the process tracks at Whz can be divided in two different categories. (1) the drive through tracks, and (2) process tracks. The drive though tracks need to remain clear all time as they are purposed for entering and exiting the process tracks, and therefore the yard. The main purpose of trains arriving at Whz has to do with the container terminal (Rail Service Centre; RSC). In this terminal trains are getting unloaded from their cargo and reloaded again. In the sequence, trains first arrive at Whz from either one of the two sides (dependent on the train’s origin) and is then assigned to one of the 12 process tracks. After the necessary operations, the train gets assigned to another track at RSC and the unloading and loading operations start there. When the necessary operations at RSC is done, the train continues again to one of the 12 tracks at Whz. After again a sequence of operations, the train exits the railway yard from one of the two exit tracks (dependent L1 = 610 m connection to main track (Two directional) connection to RSC (Two directional)Process tracks Drive through L2 = 630 m L3 = 585 m L4 = 710 m L5 = 800 m L6 = 760 m L7 = 675 m L8 = 678 m L9 = 722 m L10 = 516 m L12 = 455 m L11 = 410 m Figure 1: Schematic overview of Waalhaven Zuid process tracks The tracks at Waalhaven Zuid are divided into two different categories: • the drive-through (solid lines); • the process tracks (dashed lines). Table 1: Performance of CPLEX, Genetic Algorithm (GA), and First-scheduled First-served (FSFS) in different scenarios 4 tracks Total delay of Running time 3 tracks Total delay of Running time trains (h:mm:ss) trains (h:mm:ss) CPLEX 1:48:36 121 sec CPLEX 4:41:48 255 sec FSFS 3:29:10 1 sec FSFS 6:24:45 1 sec GA 1:48:36 1 sec GA 4:41:48 1 sec 0 2 4 6 8 10 12 14 16 18 20 22 24 Time of the day (in hours) 0 30 60 90 120 150 180 210 240 270 Totaldelay(min) FSFS GA Figure 2: Daily performance Key Findings • GA is capable of converging to the global optimum, whereas the FSFS exhibits a substantial optimality gap. • the reassignments produced by the GA algorithm result in reduced delays by 4 minutes and 42 seconds (on average) compared to the assignments of the FSFS method. • the employment of heuristics can reduce significantly the computational costs and enable the reassignment of trains to tracks in near real-time