Is Dormancy an Indicator of Ecotypic Variation?

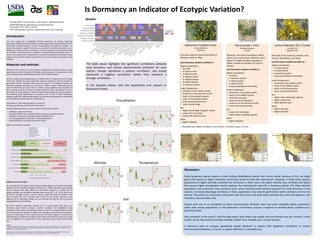
1) The study evaluated the correlation between seed dormancy levels and environmental characteristics of collection sites for plant species in the Seeds of Success program to determine if dormancy is an indicator of ecotypic variation. 2) It found that for three species - Showy goldeneye, Sandberg bluegrass, and Creosote bush - populations from locations with higher precipitation and altitudes and lower temperatures exhibited less dormancy. This suggests dormancy has evolved as an adaptation to moisture stress. 3) The correlations between dormancy and environmental variables found for some species indicate dormancy level may be a genetically-based ecotypic trait, while lack of correlations for other species suggests dormancy is a plastic response to local yearly conditions

Recommended
More Related Content
What's hot
What's hot (20)
Similar to Is Dormancy an Indicator of Ecotypic Variation?
Similar to Is Dormancy an Indicator of Ecotypic Variation? (20)
More from CWRofUS
More from CWRofUS (20)
Recently uploaded
Recently uploaded (20)
Is Dormancy an Indicator of Ecotypic Variation?
- 1. Is Dormancy an Indicator of Ecotypic Variation? 1Annette Miller, 2Chrystian Sosa, 1Colin Khoury, 1Stephanie Greene 1USDA/ARS National Laboratory for Genetic Resources Preservation, Fort Collins, CO USA 2CIAT International Center for Tropical Agriculture, Cali, Colombia Introduction: The seed quality lab at USDA/ARS National Laboratory for Genetic Resources Preservation (NLGRP) tests the viability of a wide range of wild-collected seeds from the BLM Seeds of Success program as part of preparations for long-term storage. For species that exhibit a range of dormancy, we wondered if dormancy behavior was an indicator of ecotypic variation. By ecotypic, we mean populations having a genetic basis for variability in dormancy level as opposed to simply being phenotypically plastic. To test this, we evaluated the correlation for a number of taxa between dormancy of seed samples and the environmental characteristics of the sites where the germplasm was collected. Materials and methods: Materials from the Seeds of Success program submitted to the NLGRP provide a unique opportunity to look for indicators of ecotypic variation because the samples are of wild species collected with standardized protocols from multiple locations. As part of regular processing procedures, viability tests are conducted prior to storage. In this case, viability tests were conducted using two replicates of 50 seeds planted on germination blotters moistened with water and placed in a 20 degree incubator. No dormancy breaking measures (no hormones or other nutrient compounds and no prechill treatments) were used. After 2-3 weeks, normal seedlings were recorded and the remaining seeds were tested for viability (dormancy) with a tetrazolium (TZ) test. Total viable is the percentage of seeds that germinated readily plus the percentage of the remaining seeds determined to be viable by the TZ test. To allow comparison among samples with differing seed quality, the dormancy percentage was recalculated as the proportion of total viable for these analyses: Total viable % = Germinating readily % + Dormant % Dormancy percentage = Dormant % / Total viable % Using the following criteria, we chose species and sample test results: • Exhibiting a range of dormancy. • From germination tests conducted without dormancy-breaking measures (dormancy measured by post-germination tetrazolium test). • Containing geographic coordinates of collecting locations. • Containing at least 25 samples that fit the criteria Species and number of samples: Number of samples per species per category Software tools and analysis: We used data from 27 environmental inputs including altitude and nineteen bioclimatic variables from the WorldClim database (Hijmans et al., 2005), and seven major edaphic drivers extracted from ISRIC- World Soil Information (Hengl et al., 2014). For the edaphic variables, we calculated a weighted mean across 0–5, 5–15, 15–30, 30–60, and 60–100 cm soil depth values in order to derive a single data value for 0–100 cm. We then resampled the 1 km resolution data to form 2.5 arc-minutes resolution inputs aligned with the WorldClim dataset and we extracted the data for each occurrence using georeferenced coordinates. We tested pairwise association between the 27 environmental data points and dormancy using Pearson’s product moment correlation. We highlighted those correlations with p values ≤0.05 (Results, Figure 1). We then created boxplots for each of the environmental variables to explore the variability among dormancy categories. Finally, we made maps for each species and their dormancy categories. Environmental data extraction, correlations, and figures were made using R libraries raster v2.5-8, stats 3.3.1 and ggplot2 2.2.0 respectively and the maps were made using ArcGIS Desktop 10.1. Citations: Hengl, Tomislav, Jorge Mendes de Jesus, Robert A. MacMillan, Niels H. Batjes, Gerard B. M. Heuvelink, Eloi Ribeiro, Alessandro Samuel-Rosa, et al. “SoilGrids1km — Global Soil Information Based on Automated Mapping.” Edited by Ben Bond-Lamberty. PLoS ONE 9, no. 8 (August 29, 2014): e105992. doi:10.1371/journal.pone.0105992. Hijmans, Robert J., Susan E. Cameron, Juan L. Parra, Peter G. Jones, and Andy Jarvis. “Very High Resolution Interpolated Climate Surfaces for Global Land Areas.” International Journal of Climatology 25, no. 15 (December 2005): 1965–78. doi:10.1002/joc.1276. very low 1-9% (readily germinable) low 10-49% medium 50-89% high 90-100% Dormancy categories (tests with H20 only and no prechill) Precipitation TemperatureAltitude Soil Heliomeris multiflora Nutt. Showy goldeneye Asteraceae Perennial subshrub. Great basin North to Montana, South to Texas. Low dormancy samples correlate to: Higher precipitation: • annually o in driest month o in driest quarter • in wettest month • in wettest quarter • in coldest quarter • in warmest quarter Lower temperature: o minimum in the coldest month o maximum in the warmest month o mean in the warmest quarter o mean of the coldest quarter o mean annual temperature • mean diurnal range Soil • higher percentage of organic carbon • Lower pH in soil water • Lower bulk density of soil Other o higher altitudes Poa secunda J. Presl. Sandberg bluegrass Poaceae Perennial, cool season bunchgrass. Seeds mature June-July at lower elevations and in August for higher elevation populations. Alaska, Canada and Western US south to Arizona. Low dormancy samples correlate to: Higher precipitation • annually o in warmest quarter • In driest quarter • in driest month • Lower precipitation seasonality Lower temperature • minimum in the coldest month • mean in the coldest quarter • mean diurnal range • mean annual temperature • maximum of the warmest month • mean in the driest quarter Soil • Lower pH in soil water • Lower cation exchange capacity Other • higher altitudes Discussion: Many temperate species require a moist chilling (stratification) period that mimics winter. Because of this, we might guess that species at higher elevations would also evolve to have this requirement. However, in these three species, populations at higher altitudes exhibited less dormancy. In these cases, the higher altitudes also correlate with places that receive higher precipitation overall, perhaps thus reducing the need for a dormancy period. The lower altitude populations may encounter more moisture stress, which would provide selection pressure for more dormancy in dry seasons. Increased physiologic dormancy in these populations may prevent germination when conditions are too hot and dry. This points to a dormancy mechanism that has more to do with water potential than with cold exposure. Soil chemistry may also play a role. Species with low or no correlation to these environmental attributes may have more variability within populations rather than among populations, or the expression of dormancy may be a response to variable yearly conditions at a particular locale. One constraint of this study is that the data points only reflect one sample and one harvest year per location. Future studies will be improved by including multiple samples from multiple years at each location. Is dormancy level an ecotypic (genetically based) attribute? In species with significant correlations to several environmental attributes, it may be. In species with few, it is probably not. Larrea tridentata (DC.) Coville Creosote bush Zygophyllaceae Perennial shrub. California, Nevada, Utah, Arizona, New Mexico, and Texas. Low dormancy samples correlate to: Higher precipitation • in driest quarter o In driest month • In warmest quarter • Lower precipitation seasonality Lower temperature • minimum in the coldest month • mean in the coldest quarter • mean in the driest quarter • mean annual temperature Soil • higher cation exchange capacity o higher percent silt o lower percent sand Other • higher altitudes • higher latitudes http://extension.usu.edu/rangeplants/images/uploads/Forb%20Photos/WILLshowygoldeneyeSMALL.jpg Sheri Hagwood. USDI Bureau of Land Management (BLM). http://src.sfasu.edu/~jvk/TransPecosPlants/TransPecosPlants/Zygophyllaceae/lrLarrea_tridentata11.jpg 5 4 5 0 30 21 13 21 4 13 7 12 44 7 6 9 6 14 3 24 12 4 8 5 15 0 1 1 Poa secunda Eriogonum umbellatum Larrea tridentata Heliomeris multiflora Heterotheca villosa Atriplex canescens Ambrosia dumosa Series1 Series2 Series3 Series4 Ambrosia dumosa 33 Atriplex canescens 90 Heterotheca villosa 45 Heliomeris multiflora 36 Larrea tridentata 29 Eriogonum umbellatum 25 Poa secunda 36 Results: o Attributes with higher confidence: see Pearson correlation values in chart. The table above highlights the significant correlations between seed dormancy and various environmental attributes for each species. Orange represents a positive correlation, and purple represents a negative correlation. Darker hues represent a stronger correlation. In the boxplots below, note the separations and upward or downward trends.