SlideShare a Scribd company logo
1 of 61
Download to read offline
Accepted Manuscript
Applications of fluidized bed reactor in wastewater treatment – A review of the major
design and operational parameters
Mustapha Mohammed Bello, Abdul Aziz Abdul Raman, Monash Purushothaman
PII: S0959-6526(16)31490-1
DOI: 10.1016/j.jclepro.2016.09.148
Reference: JCLP 8108
To appear in: Journal of Cleaner Production
Received Date: 8 May 2016
Revised Date: 11 August 2016
Accepted Date: 18 September 2016
Please cite this article as: Bello MM, Abdul Raman AA, Purushothaman M, Applications of fluidized bed
reactor in wastewater treatment – A review of the major design and operational parameters, Journal of
Cleaner Production (2016), doi: 10.1016/j.jclepro.2016.09.148.
This is a PDF file of an unedited manuscript that has been accepted for publication. As a service to
our customers we are providing this early version of the manuscript. The manuscript will undergo
copyediting, typesetting, and review of the resulting proof before it is published in its final form. Please
note that during the production process errors may be discovered which could affect the content, and all
legal disclaimers that apply to the journal pertain.
M
ANUSCRIPT
ACCEPTED
ACCEPTED MANUSCRIPT
Effluent
Influent
Recycle
Distributor
Fluidizedmedia
REACTOR GEOMETRY
▪ Reactor Shape
▪ Reactor Internals
▪ Aspect Ratio
CHARACTERISTICS OF
SUPPORT MATERIAL
▪ Hyrdraulic
Retention
Time (HRT)
▪ Catalyst
Concentration
▪ Temperature
▪ pH
Particles Loading ▪
Particles Density ▪
Particles Size ▪
SUPERFICIALFLUID VELOCITY
REACTOR'S INTERNAL PROPERTIES
M
ANUSCRIPT
ACCEPTED
ACCEPTED MANUSCRIPT
1
Word Count: 21,0201
1
Abbreviations2
Applications of Fluidized Bed Reactor in Wastewater Treatment – A Review of the Major Design3
and Operational Parameters4
Mustapha Mohammed Bello a
, Abdul Aziz Abdul Raman a,
*, Monash Purushothaman b
5
a
Department of Chemical Engineering, Faculty of Engineering, University of Malaya, Kuala Lumpur,6
50603, Malaysia7
b
Department of Chemical Engineering, School of Civil and Chemical Engineering (SCALE), VIT8
University, Vellore – 632014, Tamilnadu, India9
*Corresponding author: Email: aziz@um.edu.my (A. A. Abdul Raman),10
mmbello.cda@buk.edu.ng (M. M. Bello)11
monash.purushothaman@vit.ac.in (M. Purushothaman)12
Tel: +60 3 79675300; fax: +60 3 79675319.13
Abstract14
One of the current challenges of wastewater treatment is the presence of recalcitrant pollutants which are15
difficult to remove using conventional treatment technologies. This poses a threat to environmental16
sustainability and hinders the efforts of many industries to adopt cleaner production through zero-17
discharge and subsequent wastewater reuse. Effective wastewater treatment technologies are therefore18
needed to address this challenge. Accordingly, the last few years have seen intensified effort to develop19
more effective wastewater treatment technologies. The use of fluidized bed reactor in wastewater20
treatment, particularly Advanced Oxidation Processes and biological treatment, represents a unique21
opportunity for cost-effective treatment of wastewater containing recalcitrant pollutants. Although the22
Abbreviations: AOPs: Advanced oxidation processes; BPA: Bisphenol A; COD: Chemical oxygen demand;
DMSO: Dimethyl sulfoxide; DTFBR: Draft tube fluidized bed reactor; FBR: Fluidized bed reactor; FBBR:
Fluidized-bed bioreactor; HLR: Hydraulic retention time; IFBBR: Inverse fluidized bed bioreactor; IFBR: Inverse
fluidized bed reactor; IFAFB: Integrated flocculation-adsorption fluidized bed; LDPE: Low density polyethylene;
MO: Methyl orange; OH.
: Hydroxyl radicals; OLR: Organic loading rate; OM: Organic matter; PC: Phthalocyanine;
PP: Polypropylene; PZC: Point of zero charge; RB: Rhodamine B; RB13: Reactive blue 13; TOC: Total organic
carbon; UV: Ultraviolet; VSS: Volatile suspended solids
M
ANUSCRIPT
ACCEPTED
ACCEPTED MANUSCRIPT
2
application of fluidized bed reactor in biological wastewater treatment is well established with many1
large-scale plants in existence, its application in advanced oxidation processes is mostly at laboratory-2
scale. For proper design, upscaling and process improvement, information on the major parameters3
affecting the processes is important. This paper offers an overview on the applications of fluidized bed4
reactor in wastewater treatment, with emphasis on the important design and operational parameters5
affecting its performance. The discussion covers liquid-solid and gas-liquid-solid fluidized bed reactors6
and their applications in advanced oxidation processes, biological as well as adsorption processes which7
are effective wastewater treatment technologies. Fluidized bed reactors are excellent contacting devices8
and have the potential to enhance the effectiveness and energy efficiency of these treatment processes if9
properly design and utilized. An energy efficient and cost-effective wastewater treatment technology is10
crucial to industries adopting cleaner production. Important parameters such as reactor geometry, aspect11
ratio, support materials, reactor internal, superficial fluid velocity and other operational parameters are12
reviewed. The review concluded with perspective on future research interests.13
Keywords:14
Fluidized bed reactor; Fluidized bed Fenton; Fluidized bed bioreactor; Wastewater treatment; Advanced15
oxidation processes; Parameters16
1.0. Introduction17
There is consensus that more effective wastewater treatment technologies are needed for the removal18
of recalcitrant pollutants that are increasingly encountered in both domestic and industrial effluents. This19
is largely due to the need for environmental protection on one hand, and the need to have cost-effective20
wastewater treatment technologies on the other. Driven by these reasons, industries have intensified21
efforts to adopt cleaner production using strategies such as zero-discharge (Tabassum et al., 2015),22
process modifications (Zhang and Wang, 2015) and other appropriate methods. Adopting zero-discharge23
through wastewater reuse is attractive (Othaman et al., 2014) as it can lower production cost and ensure24
environmental sustainability. Unfortunately, conventional wastewater treatment technologies are not25
M
ANUSCRIPT
ACCEPTED
ACCEPTED MANUSCRIPT
3
effective in degrading recalcitrant pollutants which are hydrophobic and generally of high molecular1
weight (Pouran et al., 2014). Thus, the last few years have seen increased research towards developing2
treatment technologies that can degrade recalcitrant pollutants while meeting the cost-effectiveness3
needed by industries.4
Among the possible technologies for treating recalcitrant wastewater, Advanced oxidation processes5
(AOPs) have received wide attention.. These technologies are based on the generation of powerful6
oxidants through various processes as put forward by Glaze and coworkers (Glaze et al., 1987). The most7
common oxidant is the hydroxyl radical (OH.
), a powerful and non-selective oxidant with a redox8
potential of 2.8 eV that can effectively degrade organic pollutants. Another attractive technology is9
biological treatment which is widely used to treat both domestic and industrial wastewaters. While10
interest on AOPs is due to their effectiveness in degrading recalcitrant pollutants, biological processes are11
considered inexpensive and eco-friendly. In either case, an effective contacting device is essential for12
proper application of the technology.13
Fluidized bed reactor (FBR) has proven to be an effective reactor in the applications of both AOPs14
(Tisa et al., 2014) and biological processes (Zou et al., 2016). Some of the excellent features of FBR15
include low operating cost (Ahmadi et al., 2015), high resistance to system upsets (Brackin et al., 1996),16
high mass transfer rates and uniform mixing (Andalib et al., 2014). Many researchers have investigated17
the applications of FBR in wastewater treatment, particularly AOPs and biological processes. Although18
the application of FBR in AOPs is relatively new, FBR has been extensively used in biological19
wastewater treatment, with many large-scale fluidized bed bioreactors (FBBRs) in existence.20
To derive apposite support for the review, some relevant studies are highlighted here. It is pertinent to21
note that most of the studies on FBR have been on its applications in areas such as combustion,22
gasification, catalytic processes and other more established processes. For example Corella et al., (2007)23
reviewed the application of FBR in biomass gasification, the so called “dual” fluidized bed biomass24
gasifier. Abdelmotalib et al., (2015) reviewed heat transfer in gas-solid fluidized bed combustors,25
discussing the effect of operating parameters on the heat transfer. Similarly, Singh and Kumar, (2016)26
M
ANUSCRIPT
ACCEPTED
ACCEPTED MANUSCRIPT
4
reviewed the current status of oxygen-fired fluidized bed combustion. Such literature emphasized gas-1
solid FBR, which is not applicable to wastewater treatment. The earlier studies of FBR applications in2
wastewater treatment were mainly on aerobic oxidation and denitrification. With increased interest in3
anaerobic process, studies on the use of FBR in anaerobic wastewater treatment with concomitant4
methane generation were reported in the early 80s. Heijnen et al., (1989) presented a state of the art5
review on the application of anaerobic FBBRs in wastewater treatment. The review discussed the basic6
concept of anaerobic FBBR, process development and the challenges facing the technology. Studies7
reported around that time were mainly on process performance. Converti et al., (1990) studied the8
performance of FBBR in anaerobic treatment of wine wastewater containing high COD and proposed a9
kinetic model for the process. Similarly, Borja et al., (1995) evaluated the kinetic reaction of an FBBR10
treating slaughterhouse waste with concomitant methane generation. Haribabu and Sivasubramanian,11
(2016) studied the biodegradation of organic pollutant from domestic wastewater using FBBR and12
achieved a COD removal of 96. 7 % under optimum condition. Wang et al., (2016) conducted anaerobic13
digestion of primary sludge (PS) and thickened waste activated (TWAS) using FBBR and reported that14
the system performed better than conventional anaerobic processes. A high-rate autotrophic15
denitrification using FBBR was reported where complete nitrate removal was achieved at a hydraulic16
retention time (HRT) of 10 min (Zou et al., 2016). However, the earlier studies on the application of FBR17
in AOPs were reported in the late 90s (Chou and Huang, 1999).18
Currently, there is growing interest in the applications of FBR in wastewater treatment, particularly in19
AOPs where it has shown potential in addressing some of the drawbacks of Fenton oxidation (Chen et20
al., 2016) and improving the performance of photocatalysis (Shet and Vidya, 2016). Anand et al., (2015)21
investigated the performance of fluidized bed solar photo Fenton oxidation for the treatment of hospital22
wastewater and achieved 98 % COD removal at HRT of 90 min. The process achieved 92 % COD23
removal at 60 min HRT compared with 67 % obtained using conventional solar photo Fenton oxidation.24
Chen et al., (2015) evaluated the effect of different carriers and operating parameters on the degradation25
of flax wastewater by fluidized bed Fenton process. SiO2 was reported to be the most appropriate carrier26
M
ANUSCRIPT
ACCEPTED
ACCEPTED MANUSCRIPT
5
while Fe2+
, H2O2 and bed expansion are significant operating parameters. Matira et al., (2015) studied the1
degradation of dimethyl sulfoxide (DMSO) using a fluidized bed Fenton process and achieved 95 %2
DMSO degradation and 34 % TOC removal after 2 h. The process also showed better performance than3
conventional Fenton process. Dong et al., (2014) conducted visible-light photocatalytic degradation of4
methyl orange over spherical activated carbon-supported and Er3+
:YAlO3-doped TiO2 in a fluidized bed5
reactor. The process achieved an optimum color removal of 65 % after 8 h, with a reaction rate constant6
of 22.17mgL-1
h-1
. Mailler et al., (2016) studied the removal of emerging pollutants from wastewater7
treatment plant discharges by micro-grain activated carbon in fluidized bed as tertiary treatment at large8
pilot scale. The obvious advantage of the process was the continuous injection of fresh dose of adsorbent9
and non-requirement of additional separation steps.10
Recent studies have also been directed towards process intensification and energy efficiency through11
process integration. For example, Apollo and Aoyi, (2016) investigated the combined anaerobic digestion12
and photocatalytic treatment of distillery effluent using FBR. Besides the improved performance of the13
combined process, the methane generation could provide the necessary power to drive the ultraviolet14
(UV) lamp. Studies have also been reported on the application of an integrated anaerobic fluidized bed15
membrane bioreactor for wastewater treatment (Kim et al., 2016). The integrated process results in low16
energy consumption and reduces membrane fouling. Li et al., (2014) utilized a fluidized bed membrane17
bioelectrochemical reactor as an energy-efficient wastewater treatment process. Besides achieving more18
than 90 % COD and 80 % suspended solids removals, the overall energy balance of the process was19
theoretically neutral.20
Some reviews have also been presented on FBR applications in wastewater treatment. Burghate and21
Ingole, (2013) presented an overview on FBBR, discussing the basic concepts, advantages and22
applications in both aerobic and anaerobic treatments. Although the review had highlighted the need for23
standardizing the design procedure of FBBR, the discussion on the design parameters was limited. In their24
review for anaerobic biofilm reactors for the treatment of dairy industry wastewater, Karadag et al.,25
(2015) discussed the application of FBBR and highlighted its advantages. Tisa et al., (2014) attempted to26
M
ANUSCRIPT
ACCEPTED
ACCEPTED MANUSCRIPT
6
capture the recent applications of FBR in AOPs. However, the review mainly discussed the basic concept1
of FBR-AOPs and their specific applications to different wastewater streams. Thus, a review with focus2
on the major influential parameters of FBR is yet to be presented.3
Despite the wide applications of FBR in wastewater treatment, its designing and operation still pose4
significant challenges. The lack of proper understanding of the influential parameters can lead to5
improper design and poor reactor performance. Therefore, a prerequisite knowledge for FBR design and6
operational parameters is necessary for successful application of the technology. This paper reviews, for7
the first time, the major parameters affecting the performance of FBR in wastewater treatment. The goal8
is to offer an overview of the recent applications of FBR in wastewater treatment and provide insights on9
the major design and operational parameters which are prerequisites for successful design and application10
of the technology.11
Since fluidization technology has wide applications, large volume of literature on various aspects of the12
technology exists. Thus, to keep the review within reasonable proportions, the discussion covers only13
liquid-solid and gas-liquid-solid FBRs and their applications in wastewater treatment. Thus, throughout14
the paper, FBR refers to either liquid-solid or gas-liquid-solid system used for wastewater treatment. The15
review is presented as follows:16
1. The basic concepts of FBR and its applications in wastewater treatment are first discussed17
2. Important parameters related to reactor design and process hydrodynamics are then reviewed18
3. The operational parameters are discussed with emphasis on FBR-Fenton, FBR-Photocatalysis and19
FBBR20
4. Lastly, the review offered a perspective on future research interest21
1.1. Fluidized Bed and Fluidized Bed Reactor (FBR)22
The basic concept of a fluidized bed involves passing a fluid through a static bed of solid particles with a23
superficial velocity enough to suspend the particles and cause them to behave as though they were fluid.24
When the fluid is introduced into the static bed at a low velocity, it simply passes through the voids of the25
solid particles and the bed remains fixed. As the velocity increases, the bed expands until the particles26
M
ANUSCRIPT
ACCEPTED
ACCEPTED MANUSCRIPT
7
become suspended when the buoyancy force balances the drag and gravitational forces. At a particular1
velocity, the minimum fluidization velocity (Umf), the pressure drop across the bed equals the weight of2
the particles and the bed becomes completely suspended (Khan et al., 2014). Fluidization impacts3
excellent features onto the system such as excellent particle mixing, uniform temperature distribution and4
high mass transfer rate (Tisa et al., 2014). Depending on the fluidization velocity, various flow regimes5
such as particulate/smooth fluidization, bubbling fluidization, slugging fluidization, turbulent fluidization,6
and pneumatic conveying regimes can be obtained (Yang, 2003). The principle of fluidization has been7
extensively utilized, particularly in chemical processes where efficient mixing and mass/heat transfer are8
essential.9
FBR is a contacting device that uses the principle of fluidized bed system in its operation. It is similar10
to the commonly used packed bed reactors in many aspects, except that the packing material is expanded11
by the upward or downward movement of the fluid (Burghate and Ingole, 2013). The degree of the bed12
expansion depends on the particle size and density, the up-flow velocity of the fluid and its viscosity.13
FBR involves multiphase flow system (solid-gas, solid-liquid, or solid-liquid-gas) which may include14
momentum exchange, heat exchange and mass transfer. Because of its excellent features , FBR is one of15
the most of important reactor systems use in chemical and biotechnology applications (Si et al., 2011).16
Initially, applications of FBR had been limited to catalytic cracking, combustion, coating, granulation,17
drying and other chemical applications. However, FBR was later deployed for wastewater treatments.18
Fig. 1 shows the basic concept of FBR in wastewater treatment. The wastewater is introduced into the19
bed of the reactor at a particular superficial velocity enough to suspend the support media. The purpose of20
the distributor (spager, if air) is to uniformly distribute the effluent across the reactor bed. Depending on21
the system design, recycling of the effluent is usually employed. The fluidized media can be an22
immobilized catalyst in AOPs or microorganisms in biological treatment.23
M
ANUSCRIPT
ACCEPTED
ACCEPTED MANUSCRIPT
8
1
Fig 1. Basic concept of FBR in wastewater treatment application2
1.2. Classifications of FBR for wastewater treatment3
In chemical industries , various types of FBRs such as bubbling fluidized bed, circulating fluidized4
bed, turbulent fluidized bed, floating fluidized bed, twin fluidized bed and many other classifications5
based on flow regime and reactor design are used (Jordening and Buchholz, 1999). However, most of6
these have been developed for specific chemical applications, often involving very high superficial fluid7
velocities typically not needed in wastewater treatment. Thus, this review departs from these8
conventional classifications and discusses FBR in a way that is more applicable to wastewater treatment9
(Fig. 2).10
M
ANUSCRIPT
ACCEPTED
ACCEPTED MANUSCRIPT
9
1
Fig. 2 Classification of FBR applicable to wastewater treatment2
1.2.1. Two-phase versus three-phase FBR3
Two-phase FBR involves a liquid-solid or gas-solid process where fluidization is brought about by the4
liquid or gas. In wastewater treatment, however, only liquid-solid system is applicable. The solid phase5
could be a variety of support materials or catalysts while the liquid phase is always the wastewater. The6
three-phase system involves gas-liquid-solid process where aeration or oxygenation is added to a typical7
liquid-solid FBR. In a two-phase FBR, fluidization is provided by the flow of wastewater through the8
catalyst or biomass bed. In a three-phase system, fluidization is provided by the concurrent or9
countercurrent flow of the liquid and gas through the solid bed. The three-phase system was developed to10
improve, inter alia, the oxygen limitation encountered in two-phase FBRs (Choi et al., 2000). However,11
the three-phase system has some challenges such as particle elutriation with high gas flow rate and12
increased agitation which may cause reactor failure. Although two phase systems are simpler in design13
and easier to control, the three-phase systems have seen wider applications (Han et al., 2003).14
1.2.2. Upward-fluidization versus downward/inverse-fluidization in FBR15
FBR can also be classified based on the direction of the fluid flow. Conventional FBR uses solid16
particles that are denser than the fluid phase and fluidization is achieved by the upward fluid flow from17
the bottom of the reactor. However, inverse fluidized bed reactor (IFBR) was later introduced to18
Classification of
FBR for
wastewater
treatment
Based on reactant
phase
2-Phase FBR 3-Phase FBR
Based on
direction of
fluidization
Upflow
(conventional)
FBR
Downflow
(inverse) FBR
M
ANUSCRIPT
ACCEPTED
ACCEPTED MANUSCRIPT
10
overcome some challenges intrinsic to the conventional FBR, such as un-controlled growth of biomass1
which can affect the bioparticles hydrodynamics (Lakshmi et al., 2000). In IFBR, the density of the solid2
particles is lower than the fluid phase and fluidization is achieved by the downward fluid flow opposite to3
the net buoyancy of the particles (Nikolov et al., 2000). The IFBR is argued to possess superior4
hydrodynamic characteristics than conventional FBR. However, the downside of IFBR is that it usually5
requires higher superficial fluid velocity (Buffiere et al., 1998).6
2.0. Applications of FBR in Wastewater Treatment7
Initially developed for gas generation by Winkler F. in 1920s, FBR has found various applications in8
chemical and biochemical industries such coal gasification, metal refining, catalytic cracking, powder9
technology, food processing and other numerous applications (Tavoulareas, 1991). However, it was only10
in the early 70s that FBR was investigated as a possible reactor for biological wastewater treatment.11
Subsequent years saw a lot of progress, and by 1984, full-scale FBBRs were developed and installed12
(Heijnen et al., 1989). The application of FBR in AOPs is relatively new, with the earliest literature13
appearing in the late 90s. The works of Diz and Novak, (1998) and Chou and Huang, (1999) may have14
been the earliest reported studies on the application of FBR in AOPs.15
FBRs have attracted interest as it has shown more effectiveness in wastewater treatment compared to16
other contacting devices such as fixed-bed column and activated sludge (Burghate and Ingole, 2013).17
Excellent mixing, high mass transfer rates, and low sludge production are some of the features that make18
FBR an attractive technology (Andalib et al., 2014). Since the solid particles are vigorously agitated by19
the fluid passing through the bed, an excellent mixing and little or no temperature gradient is obtained20
(Dora et al., 2013). FBR is commonly used in AOPs, biological treatment and adsorption. Therefore, its21
applications are discussed under these three areas (Fig. 3).22
M
ANUSCRIPT
ACCEPTED
ACCEPTED MANUSCRIPT
11
1
Fig. 3. Applications of FBR in wastewater treatment.2
3
2.1. FBR-AOPs4
The concept of AOPs was put forward by Glaze and coworkers as processes of generating reactive OH.
5
radicals with a redox potential of 2.8 eV that are capable of degrading organic pollutants(Glaze et al.,6
1987). The OH.
radicals are generated in situ through either one or a combination of chemical oxidations7
by using H2O2 , ozone, and radiation assisted sources such as ultraviolet (Soon and Hameed, 2011).8
Typical AOPs include Fenton and Fenton-like processes, photocatalysis, electrochemical oxidation,9
Ozonation, and ultrasound cavitation. AOPs are very effective in degrading recalcitrant pollutants and10
have many advantages over conventional wastewater treatment methods. Unlike conventional treatments11
which either separate the pollutants from the wastewater stream or convert them to some intermediate12
compounds, AOPs are capable of mineralizing organic pollutants to H2O and CO2 (Ahmadi et al., 2015).13
This made AOPs very attractive, especially in the treatment of recalcitrant and persistent organic14
pollutants that have defied the conventional treatment technologies.15
Since a number of chemical reactions are necessary for the generation of OH.
, then the choice of a16
reactor is very important. Because of the excellent features of FBR, many researchers have investigated17
its potential application in AOPs. Combining FBR technology with AOPs can reduce sludge production18
Application of FBR in
Wastewater Treatment
Advanced
Oxidation
Processes
FBR-Fenton
FBR-
Photocatlysis
Biological
Processes
FBBR
Adsorption
FBR-
Adsorption
M
ANUSCRIPT
ACCEPTED
ACCEPTED MANUSCRIPT
12
(Briones et al., 2012), increase catalyst reusability (Tisa et al., 2014)and improve process performance.1
The most commonly investigated FBR-AOPs are FBR-Fenton and FBR-Photocatalysis.2
2.1.1. FBR-Fenton3
Fenton oxidation is considered one of the most effective AOPs because of its rapid formation of OH.
in4
acidic medium (Asghar et al., 2015). The process consists of a homogeneous catalytic reaction between5
ferrous iron (Fe2+
) and hydrogen peroxide (H2O2) to produce OH.
that can oxidized organic pollutants as6
shown in Equations 1 – 3 (Alalm et al., 2015). The decomposition of the pollutants using Fenton process7
occurs in two stages (Lu et al., 1999). The first stage is the rapid reaction of Fe2+
and H2O2 which8
produces large amount of OH.
that can rapidly oxide the pollutants. The second stage involves a reaction9
between Fe3+
and H2O2 which produces less OH.
and decomposes the pollutant rather less rapidly. This10
stage produces hydroperoxyl radicals, which have lower oxidative power.11
H2O2 + Fe2+
→ Fe3+
+ OH.
+ OH-
(1)12
OH.
+ Organic →Products (2)13
OH.
+ Fe2+
→Fe3+
+ OH-
(3)14
When Fe2+
and/or Fe3+
are used as the active sites, the process is referred to as homogenous Fenton and15
depends on the chemical interactions between the catalysts. Although the homogeneous Fenton process is16
widely employed because of its effectiveness and ease of operation (Bellotindos et al., 2014), it has17
inherent disadvantages of excessive sludge production (Anotai et al., 2012a) and limited range of18
operational pH (Rodríguez et al., 2016). Thus, heterogeneous Fenton oxidation was developed to19
overcome some of these limitations (Buthiyappan et al., 2016). In heterogeneous Fenton oxidation, the20
reaction occurs between H2O2 and iron ions existing in multiple forms such as [Fe(OH)2]+
[Fe(H2O)]2+
,21
Fe2O3, α-FeOOH (Soon and Hameed, 2011) or other transition metal-substituted oxides (Pouran et al.,22
2014). In addition to the chemical changes, physical adsorption occurs at the surface of the solid catalyst23
which reduces sludge generation. However, the heterogeneous process is reportedly less effective than24
homogeneous Fenton oxidation due to mass-transfer limitation.25
M
ANUSCRIPT
ACCEPTED
ACCEPTED MANUSCRIPT
13
To overcome some of the limitations of Fenton oxidation, researchers have recently explored the1
advantages of FBR as a possible solution. FBR can combine the effectiveness of homogeneous Fenton2
and the sludge reduction of heterogeneous Fenton. The solid materials in the reactor provide surfaces for3
iron crystallization which reduces the sludge generated and increases catalyst reusability (Anotai et al.,4
2009). A possible reaction mechanism that is thought to occur in FBR-Fenton has been proposed by Chou5
and Huang, (1999). Furthermore, because of the excellent features of FBR, the performance of FBR-6
Fenton has been shown to be superior to that of conventional Fenton process (Liu et al., 2014) . Lu and7
coworkers have conducted several works on the application of FBR-Fenton in degrading various8
recalcitrant pollutants such as textile wastewater (Su et al., 2011), dimethyl sulfoxide (Bellotindos et al.,9
2014), acetaminophen (Luna et al., 2013), monoethanolamine (Su et al., 2013)and phenol (Muangthai et10
al., 2010).11
Table 1 summarizes experimental conditions and results from previous studies on FBR-Fenton. The12
reported studies have largely considered synthetic wastewaters under laboratory-scale investigations. The13
FBRs usually consist of a cylindrical glass column with working volumes ranging between 1 to 2 L. The14
support materials commonly used include SiO2, Al2O3, and waste Iron oxide (BT4). Anand et al., (2015)15
studied the performance of a fluidized bed solar Fenton reactor in the removal of COD from hospital16
wastewater. The reactor was a cylindrical vessel of 1.5 L with silica granules as carriers. Maximum COD17
removal of 98 % was obtained at 90 min HRT. The fluidized bed solar Fenton oxidation performed better18
than conventional solar Fenton oxidation.19
Li et al., (2015) studied the oxidation of bisphenol A by Photo-Fenton-like process by a waste iron20
oxide in a three-phase FBR. The system consists of a Pyrex tube with an integrated 15 W UV lamp21
which removed 90 % TOC after 180 min.. The use of waste iron oxide, a by-product of tannery22
wastewater treatment, is attractive as it could increase the cost-effectiveness of the process. The study of23
Bellotindos et al., (2014) considered the degradation of a synthetic pollutant, Dimethyl Sulfoxide24
(DMSO), using FBR-Fenton process with silica as carriers., Up to 98 % DMSO degradation was25
achieved under optimum conditions, with the FBR-Fenton process showing superior performance than26
M
ANUSCRIPT
ACCEPTED
ACCEPTED MANUSCRIPT
14
conventional Fenton process. Similarly, Cheng et al., (2014) studied the degradation of Phthalocyanine1
(PC) dyes by photo-assisted Fenton process in an up-flow FBR . The system consists of a 1.45 L fiber2
glass plastic surrounded by 6 UV germicidal lamp and achieved 95 % PC degradation.3
However, Liu et al., (2014) investigated the treatment of real wastewater using FBR-Fenton.4
Recalcitrant silicone wastewater was treated using a 3.92 L reactor with different carrier materials. The5
process achieved 95 % COD and 85 % TOC removals at HRT of 60 min. Compared to the traditional6
Fenton process, the COD and TOC removal rates were found to increase by 20% and 15% respectively.7
Other reported studies are quite similar to the discussed literature. Although most of the studies have been8
on lab-scale, it can be seen that combining FBR with Fenton process enhances process performance, with9
the potential to overcome some of the drawbacks of conventional Fenton oxidation.10
Table 111
Applications of FBR-Fenton in wastewater treatment12
Target pollutants Reactor and Support
Material Properties
Operational
Conditions
Performance Reference
DMSO
Hospital wastewater:
COD
H: 140 cm
D: 5.2 cm
Solid: silica
Dp: 0.42-0.5 mm
PL: 68.97 g/L
V: 1.5 L
D: 0.053 mm
H: 1330 mm
Solid: Silica
Dp: 0.42-0.59 mm
PL: 40g/L
pH: 3
Fe2+
: 5 mM
H2O2: 32.5 mM
HRT: 240 min
pH: 3
Fe2+
: 5 mM
H2O2: 50 mM
HRT: 90 min
Q: :12 L/min
DMSO: 95.22 %
COD: 34.38 %
COD: 98 %
(Chen et al.,
2016)
(Anand et
al., 2015)
Orange G Coaxial cylinder
V: 1.5 L
D: 35 mm,
H: 300 mm
Solid: iron oxide (BT4)
Dp: 0.42-0.59 mm
PL: 6 g/L
pH: 3
T: 25 o
C
H2O2: 25 mg/L
UV: 15 W, 365 nm
TOC: 78.9 %
Color: 92 %
(Wang et
al., 2015)
BPA Cylindrical
V: 1.5 L
Solid: Iron oxide (BT4)
pH: 3
H2O2: 0.7 mmol/L
HRT: 180 min
UV: 15 W, 365 nm
TOC: 90 % (Li et al.,
2015)
DMSO Cylindrical glass
V: 1.3 L
D: 5.23 cm,
H: 133 cm,
Solid: SiO2
pH: 3
Fe2+
: 5 mM
H2O2: 60 mM
HRT: 2 h
DMSO: 98 % (Bellotindo
s et al.,
2014)
M
ANUSCRIPT
ACCEPTED
ACCEPTED MANUSCRIPT
15
Phthalocyanine (PC) Cylindrical Fiber glass
H: 400 mm
D: 25 mm
Solid: Fe (II)/γ-Al2O2,
PL: 60 g/L
pH: 2 – 4
UV light: 254 nm
PC: 95 % (Cheng et
al., 2014)
Organic silicone
wastewater
Cylindrical Plexiglass
V: 3.92 L
D: 8 cm
H: 78 cm
Solid: quartz /
brick/GAC
Dp: 0.5 – 0.8 mm
Carrier filling rate: 35 %
pH: 3.5
HRT: 60 min
H2O2/ Fe2+
13.6:1
Q: 3 mL/h
COD: 95 %
TOC: 85 %
(Liu et al.,
2014)
Acetaminophen
(ACT)
Cylindrical glass reactor
V: 1.45 L
Solid: SiO2 & glass
beads
Dp: 0.5 mm, 2 & 4 mm
pH: 3
Fe2+
: 0.05 – 0.1 mM
H2O2: 5 – 25 mM
ACT: 99.6 % (Luna et al.,
2013)
2,2,3,3-tetrafluoro-1-
propanol (TFP)
Cylindrical glass
V: 1.5 L
D: 7.5 cm
H: 50 cm
Solid: BT5 iron oxide
DP: 0.25 – 0.5 mm
H2O2: 10 mM
UV: 254 nm lamp
TFP: 99.65 %
Fluoride: 99 %
(Shih et al.,
2013)
MEA and phosphate Cylindrical vessel
V: 1.45 L
Solid: SiO2
Dp: 0.24 – 0.5 mm
PL: 100 g/L
50 % bed expansion
pH: 3
H2O2: 50 mM
MEA/Fe2+
: 3 mM
MEA: 76 %
Phosphate: 45 %
(Su et al.,
2013)
TFT-LCD
wastewater: MEA
Cylindrical glass
V: 1.45 L
Solid: SiO2
DP: 0.42 – 0.5 mm
PL:: 100 g
pH: 3
Fe2+
: 3 mM
H2O2: 50 mM
MEA 98.9 %
COD: 64.7 %
Iron: 67.4 %
(Anotai et
al., 2012a)
O-toluidine Cylindrical glass
V: 1.35 L
D:5.23 cm
H:133 cm
Solid: SiO2 carriers
DP: 0.42 – 0.59 mm
PL: 50 – 300 g
pH: 2 – 4
Fe2+
: 0.1 – 1.0 mM
H2O2: 1 – 17 mM
O-toluidine: 64.2 %
COD: 36.7 %
Iron: 100 %
(Anotai et
al., 2012b)
Pharmaceutical
wastewater:
acetaminophen (ACT)
Cylindrical glass
V: 1.45 L
Solid: SiO2 carriers
Dp: 0.5 mm
PL: 100 g/L
pH: 3.22
Fe2+
: 1 – 5 mM
H2O2: 100 mM
ACT 97.8 % (Briones et
al., 2012)
Dyes: RB5, RO16,
RB2
Cylindrical glass
V: 1.35 L
D: 5.23 cm
H: 133 cm
Solid: SiO2 and Al2O3
PL: 74.07 g/L
50 % bed expansion
pH: 3.22
Fe2+
: 0.06 mM
H2O2: 19.87 mM
RB 5 and RO16: 99
%
RB2: 96 %
COD: 34 – 49 %
(Su et al.,
2011)
Textile wastewater Cylindrical glass
V: 1.35 L
pH: 2 – 5
[COD]: [Fe2
]:
COD: 86.7 %
Color: 97.9 %
(Su et al.,
2011)
M
ANUSCRIPT
ACCEPTED
ACCEPTED MANUSCRIPT
16
D: 5.23 cm
H: 133 cm
Solid: SiO2
PL: 74.07 g/L
50 % bed expansion
[H2O2] =1:0.95:7.94
Aniline Cylindrical glass
V: 1.35 L
D: 5.2 cm
H: 133 cm
Solid: SiO2 carriers
DP: 0.42 – 0.84 mm
Solids: glass beads 2 & 4
mm
pH: 3
Fe2+
: 0.00107 mM
H2O2: 58 mM
HRT: 60 min
Aniline: 96 % (Anotai et
al., 2010)
2, 6, Dimethylaniline Cylindrical glass
V: 1.35L
Solid: Al2O3 carriers
DP: 2.5 mm
pH: 3
H2O2: 2.5 mM
Fe2+
:10 mM
Complete
degradation after 10
min
(Ratanatam
skul et al.,
2010)
2,4-dichlorophenol Cylindrical glass
V: 1.35 L
Solid: silica carriers
DP: 0.84-2.00 mm
PL: 100 g/L
pH: 3
H2O2: 10 mM
Fe2+
:0.25 mM
2,4-DCP: 99 %
COD: 55 %
Iron: 14 %
(Muangthai
et al., 2010)
Nitrobenzene and Iron
removal
Cylindrical glass
V: 1.35 L
Solid: Al2O3 carriers
DP: 0.8 -2.0 mm
pH: 2.8±0.2
H2O2: 50 mM
Fe2+
: 5 mM
Nitrobenzene: 90 %
Iron: 30 – 65 %
(Anotai et
al., 2009)
Phenol Cylindrical Pyrex tube
V: 150 m L
D: 2.0 cm
Solid: SiO2-immobilized
iron oxide
DP: 0.89 mm
pH: 2.8±0.2
H2O2: 500 mg/L
T: 30 o
C
Q: 1.5 L/min
TOC: 98 % (Huang and
Huang,
2009)
Benzoic Acid (BA) D: 2 cm
H: 100 cm
Solid: γ-FeOOH carriers
DP: 0.564 mm
Density: 1.11 g/cm3
PL: 80 g
50 % bed expansion
pH: 2.85 – 3.74
Ul: 0.011 m/s
BA: 95 %
Iron: 90 %
TOC: 59 %
(Chou and
Huang,
1999)
V: Reactor volume; D: reactor diameter; H: reactor height; DP: diameter of support media: BH: Initial static bed1
height; Q: liquid flow rate; Qa: air flow rate: HRT: Hydraulic Retention Time; T: Temperature; Umf: Minimum2
superficial velocity; UL: superficial Liquid velocity; Ug: superficial gas velocity; PL: Solid particle loading; BPA:3
Bisphenol A; DMSO: Dimethyl Sulfoxide; TFT-LCD: Thin film transistor liquid crystal display; MEA:4
Monoethanolamine5
6
7
2.1.2. FBR-Photocatalysis8
Photocatalytic oxidation is another AOPs where the application of FBR has attracted recent interests.9
In Photocatalysis, a semiconductor metal oxide is used as a photocatalyst to oxide organic pollutants to10
carbon dioxide and water (Rosa et al., 2015). The process involves illuminating metal oxide in aqueous11
M
ANUSCRIPT
ACCEPTED
ACCEPTED MANUSCRIPT
17
suspension with irradiation having a photon energy (hv) equal to or greater than the band gap energy of1
the metal. This generates valence band holes and conduction band electrons which can react with water2
and the hydroxyl ion to generate OH.
(Pelaez et al., 2010). Two broad light spectrum, UV (200 – 400 nm)3
and visible light (400 – 700 nm), are commonly used to generate the light photon (Cheng et al., 2016).4
Although metal oxides such ZnO, NiO, ZnS, Fe2O3 can be used, TiO2 is the most widely used5
photocatalyst due to its strong photoctivity, high stability, non-toxicity and commercial availability6
(Ananpattarachai and Kajitvichyanukul, 2015). Once the surface of the TiO2 is photo-activated, OH.
will7
be generated and subsequently oxidized organic pollutants (Chong et al., 2015). Details of the8
fundamentals of photocatalysis have been well documented (Meng et al., 2010).9
Although powder photocatalyst has large specific surface area which enhances mass transfer during10
wastewater treatment, it is necessary to have a downstream separation stage which increases the cost of11
treatment (Pozzo et al., 2000). To overcome this, the powder is usually impregnated onto the surface of12
other compounds such as Al2O3, SiO2 or perlite which have larger surface areas. This solves some of the13
challenges of using powder catalyst, including the need for downstream separation and possible particles14
elutriation. Because of the excellent features of FBR, researchers have investigated its application in15
photocatalytic oxidation. It is believed that besides its excellent mixing and high mass transfer, FBR can16
also enhance light penetration and exposure of the interior of the reaction matrix (Nam et al., 2002).17
Table 2 gives a summary of reported studies on FBR-Photocatalysis which have largely been on18
laboratory-scale using synthetic wastewaters. The FBRs used are mostly three-phase systems where air is19
supplied to increase the rate of the photocatalytic degradation. Most of the studies have reported an20
improvement in process performance with the application of FBR. This is largely due to the improved21
light penetration and possible adsorption of pollutants onto the support materials.22
Dong et al., (2014) studied the visible-light photocatalytic degradation of Methyl Orange (MO) over23
AC-supported and Er3+
:YAlO3-doped TiO2 using FBR. Maximum decolorisation of 65.3 % was achieved24
after 8 h . The performance of the system was found to be higher under the UV irradiation. Similarly, Shet25
and Shetty, (2016) compared the performance of a photocatalytic fluidized bed degradation of phenol26
M
ANUSCRIPT
ACCEPTED
ACCEPTED MANUSCRIPT
18
using Ag@TiO2 under UV and solar irradiations. Around 76 % degradation was achieved using UV while1
only 40 % was achieved under solar irradiation. The high band of TiO2 is known to prevent it from2
utilizing visible irradiation and hence its lower performance compared to UV irradiation.3
Mungmart et al., (2011) investigated the degradation of phenol in a three-phase FBR using different4
metal oxides. The performances of reactors utilizing O3, TiO2 deposited on silica beads, metal catalyst (Ni5
or Co) impregnated on mesoporous carbon beads, or O3 in combination with each catalyst were6
compared. It was found that the reactor with Co impregnated on mesoporous carbon beads gave the7
highest phenol removal while the reactor with only Ozone gave the lowest phenol removal. The carbon8
beads provided adsorption sites for the phenol, thereby increasing the removal rate. Kanki et al., (2005)9
studied the degradation of phenol and bisphenol A in a fluidized bed photocatalytic reactor using TiO2-10
coated ceramic particles. Two FBRs, one with an internal UV lamp (254 nm, 9 W) and the other with an11
outside black lamp (365 nm, 15 W) were compared. The reactor with the internal UV lamp degraded the12
pollutant 4 times faster than the other reactor. Clearly, the intensity and location of the lamp have an13
effect on the reactor performance.14
15
16
17
18
Table 219
Applications of FBR-Photocatalysis in wastewater treatment20
Target pollutant Rector and support material
properties
Operational
Conditions
Performance Reference
Phenol Cylindrical column
H: 52 cm
D: 1.6 cm
Catalyst: Ag/TiO2
Loading: 0.25 – 0.75 g
Solid: Glass beads
pH: 3
HRT 420 min
Q: 140 mL/min
Qa: 1.5 L/min
UV lamps:18 W
Phenol: 84 % (Shet and
Vidya, 2016)
MO Annulus reactor
D: 60 mm
H: 1 mm
Support: Glass beads
BH: 33 mm
LED: 36 W, 455 – 533
nm
T: 20 o
C
MO: 65.3% (Dong et al.,
2014)
M
ANUSCRIPT
ACCEPTED
ACCEPTED MANUSCRIPT
19
Phenol Cylindrical quartz tube
V: 235 ml
D:31.6 mm
H: 300 mm
Catalyst: TiO2/Co/Ni
Loading: 2.5 – 20 g
Qa: 1 L/min
HRT: 10 min
UV: 15-W, 254 nm
Phenol: 100 %
(Mungmart et
al., 2011)
Phenol Quartz glass column
H: 600 mm
D: 60 mm
Catalyst: TiO2
Support: quartz sand
pH: 7
T: 30 o
C
loading: 0.33 g/L
UV: 20 W, 254 nm
Phenol: 99 % (Zulfakar et al.,
2011)
Sodium lauryl
sulfate(SLS)
Stainless steel reactor with draft
tube
V: 7 L
D: 0.1 m
H: 1.0 m
Catalyst: immobilized TiO2
Particle size: 130 µm
loading: 2.448 g/L
Support: SiO2
Qa: 0.2 cm/s
30 W UV-A (365 nm)
Black Light Blue
Lamp
65 W UV-C (254 nm)
Germicidal Lamp
SLS: 100 % (Nam et al.,
2009)
Congo Red (CR) Stainless steel column with
conical bottom
catalyst: Titania/Kaolinite
loading: 6 g/dm3
pH: 7
Qa: 0.5 dm3
/min
11 W UV light (256
nm)
COD: 80 %
Decolorisation: 95.5 %
(Chong et al.,
2009)
Acid dye Acrylic cylindrical column
H: 210 mm
D: 90 mm
Catalyst: ZnFe2/TiO2-GAC
Loading: 20 – 40 g
Q: 3 L/min
HRT: 4 h
visible light lamp (150
W)
Acid dye: 60 % (Wang et al.,
2009)
Phenol and
Bisphenol A
Rectangular column
V: 4 dm3
H: 20 cm
UV lamps (9 W, 254 nm)
Catalyst: Immobilized TiO2
Dp: 0.7 mm
Air-flow rate: 0.5 dm3
HRT: 200 min
Phenol/BPA: 100 % (Kanki et al.,
2005)
Rhodamine B Rectangular acrylic vessel
V: 2.8
H: 250 mm
Catalyst: TiO2
Loading: 33.8 g/
Qa: 7.0 L/min
8-W Germicidal lamps
RB: 100 % (Na et al., 2005)
Microcystin-LR
(MLR)
Cylindrical column
D: 68 cm
H: 65 cm
Solid carrier: TiO2-coated GAC
BH: 2.5 cm
Q: 150 – 200 cm3
/s
UV: 4 W, 370 nm
T: 20 o
C
MLR: 95 % (Lee et al.,
2004)
Rhodamine B V: 24 L
Solid carrier: TiO2-coated
ceramic
DP: 1.5 mm
Loading: 25 g/L
Qa: 1 L/min
UV: 20 W
HRT: 180 min
87 % degradation (Na et al., 2004)
M
ANUSCRIPT
ACCEPTED
ACCEPTED MANUSCRIPT
20
Dyes: Crystal
violet & Azure B
Cylindrical glass vessel
D: 45 mm
H: 250 mm
Solid carrier: ZnO immobilized
in alginate gel beads
DP: 2.5 – 3.0 mm
Loading: 20 g
Qa: 2 L/min
UV: 125 W, 650 nm
T: 25 o
C
Decolorisation: 77-100 %
TOC: 52-90 %
(Couto et al.,
2002)
TCE Annular quartz glass tube reactor
D: 55 mm
H: 600 mm
Catalyst: immobilized TiO2
Support: Silica gel
DP: 220-417 µm
HRT: 10 min
Ug: 5.1 cm/s
6 white lamps (8 W,
365 nm)
6 Germicidal lamps (8
W 254 nm)
TCE: 80 % (Lim and Kim,
2002)
MO Acrylic pipe with draft tube
V: 2.5 L
D: 10 cm
H: 45 cm
Catalyst: Degussa P-25
Particle size: 21 nm
Loading: 0.2 g/L
pH: 3
15 W UV-lamp
Qa: 1.5 L/min
MO: 100 % (Nam et al.,
2002)
V: Reactor volume; D: reactor diameter; H: reactor height; DP: diameter of support media: BH: Initial static bed1
height; Q: liquid flow rate; Qa: air flow rate: HRT: Hydraulic Retention Time; T: Temperature; Umf: Minimum2
superficial velocity; UL: Liquid superficial velocity; Ug: Gas superficial velocity; MO: Methyl Orange; TCE:3
Trichloroethylene;4
2.2. Fluidized Bed Bioreactor (FBBR)5
FBBR has been widely used for aerobic and anaerobic wastewater treatments. The system consists of6
microorganisms-coated particles in wastewater which is sufficiently fluidized to keep the phases7
thoroughly mixed (Vinod and Reddy, 2005). The support materials of FBBR normally have extremely8
large specific surfaces and achieve treatment levels in shorter time than conventional biological treatment9
processes (Alfredo et al., 2013). This is because the fluidization maximizes surface contact between10
microorganisms and the pollutants. It has been argued that FBBR offers the stability and ease of operation11
of a trickling filter and the high efficiency of activated sludge process (Burghate and Ingole, 2013). For12
example, it was reported that FBBR operated at lower HRT and gave better performance than a stirred13
tank reactor in the degradation of phenol (Gonzalez et al., 2001). Fluidization provides a favorable gas-14
liquid mass transfer, which promotes good pollutant-biomass contact and suitable oxygen transfer rate15
(Pen and Jose, 2008). Obviously fluidization will do away with preferential flow paths, bed clogging and16
other problems encountered in fixed-bed reactors (Jaafari et al., 2014).17
M
ANUSCRIPT
ACCEPTED
ACCEPTED MANUSCRIPT
21
Although FBBR is a well-established technology with full-scale plants in existence, lab-scale studies1
are still being conducted towards process improvement, application of new materials and integration with2
other technologies. For example, Logan and coworkers have recently combined FBBR with membrane3
bioreactor as a possible solution to membrane fouling (Kim et al., 2011, 2016). Improved treatment4
efficiency, stable mixed liquor suspended solid and reduced transmembrane pressure are obtained when5
FBBR is combined with membrane bioreactor (Shin et al., 2014).6
Table 3 gives a summary of some reported studies on wastewater treatment using FBBR. Both two7
phase and three-phase processes have been used, with some researchers exploring the advantages of an8
inverse fluidized bed bioreactor (IFBBR). Haribabu and Sivasubramanian, (2016) studied the9
biodegradation of organic matter in domestic wastewater using IFBBR and achieved a maximum COD10
removal of 96.7 %. A three-phase FBR with a working volume of 0.0125 m3
and employing low density11
biocarries was used. The low density media had a positive effect on the minimum fluidization velocity12
and increased the efficiency of the process.13
Lin et al., (2010) investigated the biodegradation of RB13 in a two-stage anaerobic/aerobic FBBR and14
achieved color and COD removal efficiencies of 86.9% and 90.4% respectively. Rajasimman and15
Karthikeyan, (2007) investigated the effect of HRT on the aerobic digestion of starch wastewater using16
FBBR with low density biomass support. The COD removal increased with increase in HRT for all initial17
substrate concentration, with maximum removal (95.6 %)at 40 h HRT.18
Cuenca et al., (2006) studied the anaerobic biodegradation of diesel fuel-contaminated wastewater19
using FBBR and reported that both diesel and COD removal efficiencies increased with increased in HRT20
for all the conditions investigated. Mustafa et al., (2014) studied the treatment of municipal wastewater21
sludge using anaerobic FBBR and reported that the treatment performance decreased with increased in22
organic loading rate (OLR). A volatile suspended solids (VSS) removal efficiencies of 88 %, 79 % and 7023
% were achieved at OLRs of 4.2, 9.5 and 19 kg COD/m3
-d respectively. A COD removal efficiency of 6824
% was obtained at OLR of 19 kg COD/m3
-d. Borja et al., (2004) carried out mesophilic anaerobic25
M
ANUSCRIPT
ACCEPTED
ACCEPTED MANUSCRIPT
22
digestion of wastewater from the production of protein isolates from chickpea flour using FBBR and1
reported that the percentage COD removal decreased with increase in OLR.2
Table 33
Applications of FBBR in wastewater treatment4
Target pollutant Reactor and support
material properties
Operational Conditions Removal Reference
PS/ TWAS Plexiglass rectangular
column
V: 16 L
H: 3.6 m
Support: HDPE
DP: 600–850 µm
Density: 1554 kg/m3
T: 37 o
C
HRT: 2.2 – 4 d
OLR: 12 -18kg COD/m3
d
(Wang et al.,
2016)
Domestic
wastewater
V: 0.0125 m3
D: 0.1 m
H: 1.8 m
Support: LDPE
Density: 870 kg/m3
BH: 0.6 – 1.0 m
HRT: 6.25 – 24 h
Q: 10 – 80 mL/min
Ug:0.0016 - 0.00318 m/s
COD: 96.7 % (Haribabu
and
Sivasubraman
ian, 2016)
Autotrophic
denitrification
Glass column
V: 580 ml
Support media: GAC
DP: 0.5 -1 mm
pH: 5.8
T: 20 – 30 o
C
Q: 800 mL/min,
HRT: 10 min
OLR: 500 mg/L h
Bed expansion: 25 %
N: 100 % (Zou et al.,
2016)
Aquaculture
Effluent: Nitrate
removal
V: 2.85 L
D: 0.31 m
H: 3.9 m
BH: 0.9 m
Support: Sulfur
biofilters,
DP: 0.3 mm
Phase I: HRT: 3.2-3.3 min,
Flowrate: 63-65 L/min
Phase II: HRT: 3.2-4.8 min
Flowrate: 67-43 L/min
13 – 42% bed expansion
N: 49 % (Christianson
et al., 2015)
Aquaculture
effluent:
denitrification
V: 285 L
D: 0.31 m
H: 3.9 m
Support: sand
biofilters
DP: 0.11 mm
BH: 0.9 m
HLR: 188 L/min m2
HRT: 15 min
Q: 13.7 L/min
50 % bed expansion
N: 26.9 % (Tsukuda et
al., 2015)
Denitrification of
mining water
V: 1 L
Support: GAC
Dp: 0.5 – 1 mm
T: 7 – 22 o
C
HRT: 12 h
Q: 800 mL/min
25 % bed expansion
Denitrification: 100
%
(Zou et al.,
2015)
Cu, Ni & Zn
removal
V: 2.5 L
D: 0.08 m
H: 1.0 m
HRT: 24 h
pH: 7 & 5
OLR: 1 g COD/L. d
30 % bed expansion
Cu: 97.5 %
Ni: 65.9 %
Zn: 97.0 %
COD: 61.9 %
(Janyasuthiw
ong et al.,
2015)
M
ANUSCRIPT
ACCEPTED
ACCEPTED MANUSCRIPT
23
Synthetic
municipal
wastewater:
denitrification
Plexiglass column
V: 608 ml
D: 2.54 cm
H: 100 cm
Support: zeolite
DP: 600 – 850 µm
T: 20 ± 3 o
C
HRT: 0.6 h
OLR: 5.9 – 7 kg COD/m3
d
Q: 20 ± 2 L/day
N2O: 0.53 % (Eldyasti et
al., 2014)
Currant
wastewater: COD
Plexiglass column
V: 3.95 L
D: 60 mm
H: 140 cm
BH: 0.6 m
Support: PVC
DP: 2 mm
T: 35 ± 2 o
C
OLR: 9.4 to 24.2 kg COD/m3
Umf: 0.75 m/min
30 % bed expansion
COD: 96. 9 % (Jaafari et al.,
2014)
Domestic
wastewater
Plexiglass plate
V:7.6 L,
Support : GAC
Loading: 200 – 300 g
T: 15 - 35 o
C
HRT: 6 h
COD: 74.0 ± 3.7% (Gao et al.,
2014)
Formaldehyde Pillar glass reactor
V: 486 mL
D: 3.6 cm
H: 46 cm
Support: Gel beads
HRT: 24 h
T: 30 & 37 o
C
Degradation: 98. 37
% at 30 o
C
Degradation: 96.83 %
at 37 o
C
(Qiu et al.,
2014)
Metal precipitation
(Cu, Pb, Cd, Zn)
PVC pipe with conical
bottom
V:2.5 L
D: 0.05 m
H: 1.0 m
Support: LDPE beads
DP: 3 mm
T: 25 o
C
HRT: 24 h
30 % bed expansion
Removal: 99 %
(Villa-Gomez
et al., 2014)
PS & TWAS V: 16 L
H: 3.6 m
Support media: zeolite
carries
DP: 425 – 610 µm
OLR: 8 – 19 kg/m3
-d
Q: 3.4 L/d
COD: 68 % for PS
COD: 55 % for
TWAS
(Mustafa et
al., 2014)
Petrochemical
wastewater: COD
and TPH
Glass column with
draft tube
V: 4.36 L
T: 20 – 25 o
C
HRT: 6 h
Qa: 2-5 L/h,
OLR:1.61-2.56 kg COD/m3
.d
COD: 87 %
TPH: 95 %
(Qin et al.,
2014)
Thin stillage H: 3.6 m
Support: Zeolite
DP: 425 – 610 µm
T: 37 o
C,
UL: 1.4 cm/s
OLR: 29 ±1.2 kg COD/m3
d
COD: 88 %
TSS: 78 %
(Andalib et
al., 2012)
Dyeing Effluent:
color and COD
V: 0.02 m2
D: 0.15 m
H: 1.17 m
BH: 0.25 m
Support media: PVC
Qa: 0.025 m/s
HRT: 26 h
50 % bed expansion
COD: 83.3 %
Color: 89.5 %
(Balaji and
Poongothai,
2012)
Sulfide oxidation Glass column
V: 0.6 L
D: 0.045 m
H: 0.38 m
Support: nylon
DP: 2-3 mm
T: 30 ± 2 o
C
HRT: 25 – 70 min
Uup: 14 – 20 m/h
Degradation: 92 % (Midha et al.,
2012)
M
ANUSCRIPT
ACCEPTED
ACCEPTED MANUSCRIPT
24
Density: 1140 kg/m3
BH: 16 cm
Real acid drainage
mine water
V: 300 mL
Support media: AC
DP: 0.5 – 1 mm
T: 35 o
C
HRT: 12 – 24 h
pH: 2.7 – 7
15 – 20 % bed expansion
Sulfate: 90 %
COD: 80 %
Metal: 99.9 %
(Sahinkaya et
al., 2011)
V: Reactor volume; D: reactor diameter; H: reactor height; DP: diameter of support media: BH: Initial static bed1
height; Q: liquid flow rate; Qa: air flow rate: HRT: Hydraulic Retention Time; T: Temperature; Umf: Minimum2
superficial velocity; UL: Liquid superficial velocity; Ug: Gas superficial velocity; OLR: Organic Loading Rate;3
IFBBR: Inverse Fluidized Bed Bioreactor; IAFMBR: Inverse Anaerobic Fluidized Bed Bioreactor; GAC: Granular4
Activated Carbon; HDPE: High Density Polypropylene; LDPE: Low Density Polypropylene; TPH: Total Petroleum5
Hydrocarbon; PS: Primary Sludge: TWAS: Thickened Waste Activated Sludge6
7
2.3. FBR-Adsorption8
Adsorption is an effective and economical method for the removal of recalcitrant pollutants from9
wastewater, especially when low-cost adsorbent such as grape bagasse (Demiral and Güngör, 2016) and10
cow bone (Cechinel et al., 2014) are utilized. Although treatability studies on adsorption are usually11
conducted in batch (Abidi et al., 2015) or fixed-bed column rectors (Bello et al., 2013), studies have also12
been reported on the use of FBR for adsorption process. When FBR is used in adsorption, operational13
problems encountered in fixed-bed column adsorption such as clogging, temperature gradient, channeling14
and dead zones are eliminated. Table 4 shows reported studies on adsorption using FBR.15
Dora et al., (2013) investigated the adsorption of Arsenic (III) using cashew nut shell in a three-phase16
FBR and reported a removal efficiency of 92.55 % under optimum condition. The adsorption was found17
to be affected by the gas and liquid velocities, particle size and initial static bed height. Kulkarni et al.,18
(2013) studied the adsorption of phenol from wastewater in an FBR using coconut shell activated carbon.19
The adsorption was found to depend on the initial phenol concentration, flowrate and bed particle size.20
Jovanovic et al., (2014) studied the hydrodynamics and sorption studies for the removal of Cu (II) from21
aqueous solution using FBR packed with Zeolite A beads. The process was optimized, with a maximum22
sorption capacity of 23.3 mg/g.23
Zhou et al., (2015) developed an integrated flocculation-adsorption fluidized bed (IFAFB) system for24
the removal of Kaolin clay and phenol from synthetic wastewater. The adsorption capacities of the25
fluidized regime were found to be 8.77 and 24.70 mg/g greater than those of the fixed bed regime. At26
M
ANUSCRIPT
ACCEPTED
ACCEPTED MANUSCRIPT
25
shorter HRT (below 50 min), however, the adsorption was higher in the fixed bed regime. At longer times1
and higher superficial velocities, the adsorption performance of the FBR was superior. Under fluidization,2
the solution forms micro-vortices and create a uniform condition around the adsorbent, resulting in3
effective utilization of the adsorbent. Under fixed bed mode, however, there are discrepancies between4
the two sides of the particle. In a similar study, Wang et al., (2011) reported that the adsorption capacity5
of fixed bed was higher than that of an inverse fluidized bed in their study for aqueous phase adsorption6
of toluene using hydrophobic aerogels. The breakthrough time was found to be shorter in the inverse FBR7
than packed bed. This is perhaps because of the short HRT (50 min) where the packed bed normally8
exhibits a better performance. The use of the inverse FBR might have equally contributed to the lower9
performance of the process.10
Table 411
Applications of FBR-Adsorption in wastewater treatment12
Target
pollutant
Reactor and support
material properties
Operational
conditions
Performance Referenc
e
Emerging
micro-
pollutants
V: 20 m3
H: 5 m
Adsorbent: GAC
DP: 100 – 800 µm
BH: 1.5 – 2.5 m
HRT: 10 – 20 min
Q: 1400 m3
/d
PPHs: 80 %
COD: 40 – 45 %
OM: 30 – 35 %
(Mailler
et al.,
2016)
Kaolin
clay and
Phenol
Cylindrical Plexiglas
D: 30 mm
H: 570 mm
Adsorbent: SiO2/CAC
DP: 0.6 – 1.5 mm
BH: 35 mm
Ul: 4 – 8 mm/s
HRT: 7 s
Kaolin: 95 %
Phenol: 80 %
(Zhou et
al., 2015)
Cu Polycarbonate column
D: 2.4 cm
H:16.7 cm
Adsorbent: Zeolite A
DP: 0.71 – 2.2 mm
Loading: 10.5 - 12.5 g
BH: 4.3 - 10.2 cm
HRT: 1.4 - 4.0 s
Q: 11.6 - 13.5 cm3
/s
Ul: 2.6 - 3.0 cm/s
adsorptive capacity 23.3
mg/g
(Jovanov
ic et al.,
2014)
Arsenic Perplex column
D: 5 cm
H: 150 cm
Adsorbent: Cashew nut shell
DP: 1.1005 – 1.5405 mm
BH: 0.06 – 0.14 m
Ug: 5 – 20 m/s
UL: 0.01 – 0.07 m/s
Arsenic: 93 % (Dora et
al., 2013)
M
ANUSCRIPT
ACCEPTED
ACCEPTED MANUSCRIPT
26
Toluene PVC column
D: 0.076 m
H: 1.47 m
Adsorbent: SiO2
DP: 0.7 – 1.2 mm
Loading: 50 – 200 g
HRT: 6.25 – 24 h
Ug: 0.0016 - 0.00318
m/s
Q: 0.86 – 5.99 L/min
4 % of the adsorbent
weight
(Wang et
al., 2011)
Congo red
phosphate
and nitrate
Conical bottom polyplastic
Adsorbent: formulated clay-
lime
Loading: 0.4 – 1.0 g/L
Qa: 1 L/min Congo red: 99 %
Phosphate: 99 %
Nitrate: 45 %
(Vimons
es et al.,
2010)
Phenol Cylindrical perplex column
V: 70 L
D: 0.2199 m
H: 1.82 m
Adsorbent: PAC
Loading: 2 g/L
pH: 3.5
Ug: 0.0219 m/s
Phenol 95 % (Mohant
y et al.,
2008)
Copper D: 3 cm
H: 120 cm
Adsorbent: clarifier sludge
DP: 0.5 mm
pH: 4
HRT: 60 min
T: 25 o
C
UL: 0.0028 m/s
Copper: 90 % (Lee et
al., 2006)
Copper D: 3 cm
H: 120 cm
Adsorbent: Manganese-
coated sand
DP: 1.0 ± 0.1 mm
pH: 2 – 8
HRT: 60 min
T: 25 o
C
UL: 0.0028 m/s
Copper: 99 % (Lee et
al., 2004)
Phenol Jacket glass column
D: 20 mm
Adsorbent: GAC
DP: 0.937, 1.524 mm
Density: 2100 kg/m3
Loading: 12-24 g
T: 21 – 24 o
C
Q: 0.15–0.35 dm3
/min
Umf: 0.0085 m/s
Phenol: 62 % (Wang
and
Chang,
1999)
V: Reactor volume; D: reactor diameter; H: reactor height; DP: diameter of support media: BH: Initial static bed1
height; Q: liquid flow rate; Qa: air flow rate; HRT: Hydraulic Retention Time; T: Temperature; Umf: Minimum2
fluidization velocity; UL: Liquid superficial velocity; Ug: Gas superficial velocity; CAC: Coconut activated carbon;3
IFAFBR: Integrated Flocculation-Adsorption Fluidized Bed Reactor; IFBR: Inverse Fluidized Bed Reactor; GAC:4
Granular Activated Carbon; OM: Organic matter: PAC: Powder Activated Carbon5
3.0. Effect of Design parameters6
Successful application of FBR requires knowledge of the important design parameters. However,7
despite the extensive applications of FBR, fluidization is still an empirical science (Yang, 2003) and a8
single systematic design approach is yet to emerge. Instead, the design is largely application-specific and9
relies on empirical correlations (Onysko et al., 2002) and experience of the designer (Zhang et al., 2012).10
For example, recently, Deng et al., (2016) developed an integrated methodology for designing FBBR for11
the treatment of dyeing effluents. The method was based on theories, experiments and knowledge base.12
The absence of a robust methodology and the reliance on heuristic may lead to various problems such as13
insufficient or over-fluidization, poor treatment performance and reactor failure. Although attempts have14
M
ANUSCRIPT
ACCEPTED
ACCEPTED MANUSCRIPT
27
been made to understand the design parameters, large-scale applications of FBR still pose significant1
challenge (Reinhold et al., 1996).2
Despite the wide applications of FBR in wastewater treatment, the effect of design parameters is not3
fully established. Also information on the effects of reactor configuration on the mass transfer and the4
reactor performance are somewhat sparse. Some of the design parameters that may affect the performance5
of FBR include reactor geometry, aspect ratio, reactor internals, particle size and density, particle loading6
and fluid superficial velocity.7
3.1. Reactor Geometry8
3.1.1. Shape and cross-sectional area of the reactor9
Reactor configuration is an important parameter that affects mixing and particle distribution in FBR10
(Choi and Shin, 1999). Particle mixing plays an important role in the performance of FBR since it affects11
both heat and mass transfer (Yan et al., 2009). For wastewater treatment, it is necessary to obtain high12
mass transfer rate and uniform temperature in the reactor through fluid-particle interactions.13
Although FBRs are conventionally cylindrical, other shapes such as square columns have been used.14
Dead-zones are encountered more frequently in square columns where the sharp corners of the reactor15
promote their occurrences. The presence of dead-zones inhibits proper particle mixing in the reactor. In16
their comparative study on the effect of bed geometry on mixing rate, Gorji-kandi et al. (2015) concluded17
that mixing rate is greater in a cylindrical bed than a square bed FBR. This was attributed to the presence18
of dead-zones at the corners of the square reactor which caused slow motion of particles. The presence of19
slow fluidization on the wall of the reactor had been confirmed earlier (Efstathios and Michaelides, 2013).20
Therefore, it is necessary to choose appropriate shape of the reactor for effective wastewater treatment.21
The cross-sectional area of the reactor is another parameter that can affect the hydrodynamics and22
treatment performance of FBR. Generally, FBR can be divided into a flatbed or a tapered-bed FBR (Fig.23
4). Conventional FBRs are flatbed reactors with uniform cross-sectional areas. However, wash-out of24
M
ANUSCRIPT
ACCEPTED
ACCEPTED MANUSCRIPT
28
particles occurs sometimes due to high superficial velocity. To overcome this challenge, Scott C. D and1
Hancher C. W. introduced the concept of tapered-bed FBR in 1976 (Parthiban et al., 2007). In Tapered2
FBR, the cross-sectional area of the reactor is made narrower at the bottom (tapered-in) or both bottom3
and top (tapered-in tapered-out) (Askaripour and Dehkordi, 2015). This results in a stable feed4
introduction as well as minimizes eddies and back mixing that could arise in flatbed FBR. However, it is5
necessary to ensure appropriate taper angle so that turbulent flow due to sudden expansion can be6
avoided.7
8
9
10
Fig. 4 Flatbed versus tapered-in FBR (Adapted from: Heat and Mass Transfer in Particulate Suspensions11
In: Springer Briefs in Applied Sciences and Technology, Efstathios and Michaelides, 2013, pp 89 – 199,12
with permission from Springer)13
14
A comparative study on the performance of a flatbed FBR and a tapered FBR showed that the latter15
has superior treatment performance and better hydrodynamic characteristics (Huang et al., 2000). Three16
FBRs having 0 o
, 2.5 o
and 5 o
taper angles were compared in the study. The hydrodynamics characteristics17
and performance of the three FBRs were in the following increasing order 5o
→ 2.5 o
→ 0 o
. A previous18
study by Wu and Huang, (1996) reported that COD removal efficiency of a tapered FBR was higher than19
a flatbed FBR when the taper angle does not exceed 5o
. Above 5 o
taper angle, the performance of the20
flatbed FBR was either higher or lower than the tapered FBR.21
M
ANUSCRIPT
ACCEPTED
ACCEPTED MANUSCRIPT
29
3.1.2. Aspect Ratio1
Aspect ratio, defined as the ratio of the static bed height to the reactor diameter,2
is an important design parameter of FBR. The aspect ratio has an influence on3
fluid circulation velocity and consequently on the phase mixing in the reactor4
(Weipeng et al., 2014). Large aspect ratio promotes bubble coalescence and5
higher solid holdup. This reduces both gas /liquid holdup and the interphase6
mixing. Conversely, a low aspect ratio promotes higher liquid/gas holdup and7
encourages interphase mixing. Therefore, low aspect ratio can reduce the fluid8
flow rate requirement and hence lower the process cost (Ochieng et al., 2003). It9
is therefore necessary to select the appropriate aspect ratio for proper design and10
successful application. Typical ranges of aspect ratio for both laboratory/pilot11
FBRs and technical plants are shown in Table 5 (Jordening and Buchholz,12
1999). Laboratory scale FBRs usually have small diameters in relation to the13
reactor column height and the corresponding static bed height. Since the reactor14
volume is small, a small diameter and a relatively high static bed height can give15
the necessary solid loading. In the case of full scale FBR, a long and narrow16
column may result in slugging effect (Kunii and Levenspiel, 1991) and hence the17
diameter is usually made relatively bigger to achieve the necessary degree of18
fluidization. However, a very large diameter may pose challenges to uniform19
fluidization. Therefore, a compromise is usually necessary (Jordening and20
Buchholz, 1999). For example, Ochieng et al.,(2002) found an aspect ratio of 1021
to be the optimum in their treatment of brewery wastewater using laboratory-22
scale FBBRTable 523
Typical range of aspect ratio for FBR24
25
FBR Type Aspect Ratio
Laboratory scale
Technical plant
5 – 25
2 – 5
26
In FBBR, large aspect ratio results in more surfaces for biomass growth. However, higher aspect ratio27
above the optimum value will increase solid holdup and thereby inhibit proper mixing of the bioparticles28
and wastewater. The increased amount of solid particles due to the high aspect ratio will equally increase29
the fluid pumping requirement of the system (Sabarunisha and Radha, 2014).30
3.1.3. Reactor internals31
Another parameter that affects FBR performance is the presence of an internal structure in the reactor.32
Internals, such as tubes and baffles, are sometimes introduced into the reactor to modify the flow33
structures and improve particles fluidization. Reactor internals promotes uniform mixing which result in34
M
ANUSCRIPT
ACCEPTED
ACCEPTED MANUSCRIPT
30
effective fluidization (Qin et al., 2014). Although the main purpose of internals is to ensure uniform1
fluidization, additional benefits such as enhanced phase contact, controlled solid holdup and improved2
radial mixing are obtained (Jin et al., 2003). The downside of the internals is that they can increase the3
complexity of system design and operation (Dutta and Suciu, 1992).4
Internals can be broadly classified into baffles, tubes, packings, inserted bodies, and other5
configurations developed for various specific applications. Baffles and tubes are the most commonly used6
internals, in wastewater treatments. Examples of baffles include wire mesh, ring, perforated plate etc.7
while tubes can be draft tubes, horizontal and vertical banks. Many studies have been reported on reactor8
internals such as vertical internals (Ramamoorthy and Subramanian, 1981), horizontal tubes (Olowson,9
1994), perforated baffles (Zhao et al., 1992), ring-type internals (Zhu et al., 1997) and other variations. In10
general, internals have effects on the bubble behavior, flow distribution and phase mixing.11
Studies have shown that introducing a draft tube into FBR can enhance the process performance.12
Wang et al., (2015) reported that a FBR with internal draft tube gave a higher decolorisation and TOC13
removal compared with conventional FBR in their study for orange G degradation. Similarly, Nam et al.,14
(2009) reported similar findings when they compared the performance of conventional FBR and FBR15
with an internal draft tube (DTFBR). The DTFBR showed superior performance under all the conditions16
investigated which was attributed to the more uniform distribution of the catalyst.17
In another study, Vinod & Reddy, (2005) used a draft tube FBBR for the treatment of phenolic18
wastewater, achieving up to 96 % removal efficiency. Interestingly, Wei et al., (2000) compared the19
hydrodynamics of FBRs with conventional internal draft tube and with convergence-divergence draft20
tube. Results showed that gas holdup is higher in the FBR with convergence-divergence draft tube than21
the conventional draft tube FBR. Conversely, liquid circulation velocity was found to be lower in the22
convergence-divergence draft tube reactor, perhaps due to the decrease in the velocity caused by the23
divergence/convergence tube.24
However, Nam et al., (2002) reported that internal draft tube has a negligible effect on the performance25
of FBR in the photocatalytic oxidation of methyl orange. The photocatalytic degradation was found to26
M
ANUSCRIPT
ACCEPTED
ACCEPTED MANUSCRIPT
31
depend largely on the amount of catalyst and lamp power rather than the reactor internals. However, the1
range of gas flow rates tested in the study may have been too low to make a significant difference in the2
hydrodynamics of the two different reactors. To buttress that, the authors reported the superiority of the3
DTFBR over the conventional FBR in another study (Nam et al., 2009). Thus, it is obvious that internals4
can affect the reactor hydrodynamics and therefore influences the treatment performance of the FBR.5
3.2. Support Material6
The properties of support materials such as particle size, density and surface characteristics can affect7
the process performance of FBR (Wirsum et al., 2001). The choice of support material would therefore8
determine, to a great extent, the process engineering (Jordening and Buchholz, 1999). The effects of9
particle loading, density, size and surface properties on the reactor performance are discussed in this10
section.11
3.2.1. Particle size and surface property12
Particle size is an important parameter that affects fluidization as well as heat and mass transfer in the13
reactor. In fact, it has been argued that particle size could be the most important factor that govern mass14
transfer in a three-phase FBR (Kim and Kang, 1997). Although developed for gas-solid fluidization,15
Geldart classification of particles can be useful in classifying solids for wastewater applications. Geldart,16
(1973) classified solid particles into four groups (A, B, C and D) based on their mean size and density17
difference between the particles and the fluidizing medium. Group A are particles with small mean size18
between 30 to 100 µm, group B ranges between 100 to 800 µm, group C has mean size less than 20 µm19
while group D has a mean size above 1 mm. For each classification, different flow regimes and bed20
behavior are observed. Although all these types of solids are used in traditional fluidization applications,21
only Geldart B and D particles are applicable to wastewater treatment.22
Both heat and mass transfer in FBR increase with increase in particle size. This is because large particles23
have the capability to break up and disintegrate large bubbles (Nguyen-tien et al., 1984). For a given24
M
ANUSCRIPT
ACCEPTED
ACCEPTED MANUSCRIPT
32
liquid velocity, larger particles would result in a better mass transfer and subsequent reactor performance1
than smaller ones (Begum and Radha, 2015). In a study to investigate the effect of zeolite diameter used2
as a support material in FBBR, it was reported that larger diameter (0.5 – 0.8 mm) gave slightly higher3
COD removal than smaller ones (0.2 – 0.5 mm) (Fernández et al., 2008). Therefore, it is generally4
believed that mass transfer coefficient in FBR increases with increase in bed particle diameter.5
However, large particles can increase bed pressure drop (Dora et al., 2012) which will consequently6
increase the fluidization requirement (Midha et al., 2012). Lakshmi et al., (2000) investigated the effect of7
particle diameter on the minimum fluidization velocity in a two-phase IFBR using LDPE and propylene8
particles. They reported that the minimum fluidization velocity increased with increase in particle9
diameter for the two types of particles investigated. This was attributed to the increase in the Archimedes10
number which increases with increase in particle diameter.11
Surface characteristic of the solid particle is another important parameter that can affect the12
performance of FBR. Solid particles can be hydrophobic or hydrophilic. Unlike hydrophobic particles,13
hydrophilic particles mix excellently with water. This improves the mass transfer coefficient for up-flow14
fluidization (Kim and Kang, 1997). However, for inverse fluidization, the reverse is the case. Han et al.,15
(2003) compared hydrophobic and hydrophilic particles having the same density and concluded that16
hydrophobic are better than hydrophilic particles for inverse fluidization. This was attributed to the17
retardation of rising bubbles near the hydrophobic particles which subsequently increased the gas holdup.18
A similar concept of hydrophobic/hydrophilic was discussed by Choi & Shin, (1999) and observed by19
Buffiere et al., (1998) during their study of an IFBBR. Kim & Kangt, (1997) had equally discussed this in20
terms of the wettability of the particles. This shows the importance of surface properties of FBR support21
materials in wastewater treatment.22
Particles with high specific surface areas, good physicochemical and fluidodynamic properties should23
therefore be used as support materials (Pen and Jose, 2008). Particles with irregular surfaces, sharp angles24
and crevices are suitable for biomass attachment and development which are important in FBBR (Buffiere25
M
ANUSCRIPT
ACCEPTED
ACCEPTED MANUSCRIPT
33
et al., 1998). Silica, quartz sand, granular activated carbon, vitreous coke, glass beads, PVC, are some of1
the common support materials used in FBR (Alfredo et al., 2013). The particle diameter of the support2
materials is usually less than 1 mm, though larger particles have also been used (Vinod and Reddy, 2005).3
The specific area of bed materials after fluidization can be calculated using the following formula:4
ܽ௦		 =
଺ሺଵିఌሻ
ௗ	ట
(4)5
Where6
as = specific surface area (m-1
)7
ε = expanded bed porosity (dimensionless)8
d = support particle diameter (mm)9
ψ = form factor (dimensionless, equals 1 if considered a pseudo-spherical particle)10
3.2.2. Particle loading11
For successful application, it is necessary to understand the effect of particle loading/initial bed height12
on the hydrodynamics of FBR (Delebarre et al., 2004). The initial static bed height is the height of the13
solid particles in the reactor prior to fluidization. Theoretically, the initial static bed height does not affect14
the minimum fluidization velocity ሺU௠௙) in a conventional FBR (Jena et al., 2009). This is because15
fluidization is achieved when the upward inertial and drag forces exerted on the particles equal the16
buoyant weight of the bed. Lakshmi et al., (2000) studied the effect of bed height on U௠௙ in a two-phase17
FBR and reported that constant velocity is obtained for all bed heights investigated.18
However, Delebarre et al., (2004) studied the influence of bed inventory on fluidization characteristics19
of FBR and concluded that the initial static bed height has effect on U௠௙. An increase in bed inventory20
led to increase in U௠௙. However, there were some inaccuracies in the bed height measurements which21
might have affected the authors’ conclusion. Previous study by Garcia et al., (1999) had reported a small22
influence of particle loading on the liquid velocity of the system. In the case of IFBR, however, the23
fluidization velocity decreases with increase in particle loading (Han et al., 2003).24
M
ANUSCRIPT
ACCEPTED
ACCEPTED MANUSCRIPT
34
For a given reactor diameter, particle loading can affect the oxygen mass transfer rate in a three-phase1
FBR. However, the influence of particle loading on oxygen transfer rate is rather complex. High particle2
loading promotes bubble coalescence, which in turns reduces the interfacial area of gas-liquid and hence3
the oxygen mass transfer (Abdel-aziz et al., 2016). Large bubbles will move faster, resulting in shorter4
residence time and consequent low gas hold up. It was reported that an increased particle loading of 15 %5
caused a 30 % drop in oxygen mass transfer in a three-phase FBR for aerobic wastewater treatment (Yu et6
al., 1999).7
The initial static bed also affects the pressure drop across the reactor bed. At U௠௙, the pressure drop8
is equal to the weight of the particles divided by the cross-sectional area of the bed. The pressure drop in9
FBR is the sum of the frictional pressure drop and the static pressure drop. However, the static pressure10
drop is usually negligible and the total pressure drop is then due to the frictional pressure drop only11
(Askaripour and Dehkordi, 2016). Therefore, the frictional pressure drop required to counterbalance the12
weight of the bed increases with increase in initial static bed height (Dora et al., 2012). Thus, it is13
necessary to use appropriate aspect ratio to ensure optimum performance of the system.14
3.2.3. Particle density15
For a given bed height, the density and the surface property of the particles would determine the16
required superficial fluid velocity (Han et al., 2003). Dense particles would require high up-flow velocity17
to achieve fluidization (Escudero, 2010). Also porous materials result in lower superficial velocity18
requirement than non-porous materials (Jordening and Buchholz, 1999). Where FBBR is used, polymeric19
support particles could be the materials of choice because they offer large surface areas for microbial20
growth (Midha et al., 2012). The use of light particles will result in low fluid pumping requirement and21
thereby low operational cost. In such case, however, the aspect ratio should be as low as possible in order22
to achieve bed homogeneity at the low gas/liquid flow rates (Ochieng et al., 2002).23
Conversely, minimum fluidization velocity decreases with increase in particle density in the case of an24
IFBR. A study on the minimum fluidization velocity requirement between a low density polyethylene25
M
ANUSCRIPT
ACCEPTED
ACCEPTED MANUSCRIPT
35
(LDPE) (940 kg/m3
) and polypropylene (PP) (840 kg/m3
) revealed that the LDPE particles required lesser1
velocity to fluidized than the PP particles (Lakshmi et al., 2000). This is because the upward buoyance2
force increases as the particle density decreases and thus higher liquid velocity is required to achieve3
fluidization.4
For a given initial static bed height, particle density affects bed pressure drop. Dense particles increase5
the weight of the initial static bed height and this increases the pressure drop necessary to counterbalance6
the weight (Dora et al., 2012). A correlation of gas velocity, phase holdups and pressure drop can give7
further insights on the influence of the hydrodynamic characteristics on the process performance8
(Equation 5).9
−
d௣
d௭
= ൫ߝsߩs + ߝLߩL + ߝgߩg൯g (5)10
11
ߝs + ߝL + ߝg = 1 (6)12
Where d‫	݌‬is	the	pressure	drop, d‫	ݖ‬is	the	bed	height;	ߝs, ߝL and ߝg are the solid, liquid and gas phase13
holdups respectively; ߩs, ߩL and ߩg are similarly the densities; g is the acceleration due to gravity.14
Clearly from Equation 5, the use of dense particles could lead to an increase in pressure drop, which15
consequently increases power consumption. On the other hand, very low densities could lead to particle16
wash-out. However, a careful design and reactor internal can minimize this problem (Ochieng et al.,17
2002).18
3.3. Superficial fluid velocity19
Superficial fluid velocity ሺU௙
ሻ refers to the volumetric flow rate of the fluid divided by the cross-20
sectional area of the reactor. U௙ is responsible for the particles fluidization and therefore influences the21
particles mixing, heat and mass transfer rate in the reactor (Mostoufi and Chaouki, 2001). Therefore, it is22
necessary to understand how U௙ affect FBR performance. U௙ is required to be within two extremes, the23
minimum fluidization velocity (U௠௙
) and the terminal fluidization velocity (U௧
ሻ.	 U௠௙	is the lowest fluid24
M
ANUSCRIPT
ACCEPTED
ACCEPTED MANUSCRIPT
36
velocity necessary to initiate particles fluidization while U௧ is the fluid velocity at which particles are1
carried out with the fluid flow (Jovanovic et al., 2014).2
U௠௙ is an important parameter which is closely related to the power requirement of the system3
(Ochieng et al., 2003). A high U௠௙	will result in a high fluidization power requirement. Therefore, it is4
necessary to control U௙ slightly above U௠௙ with as much accuracy and precision as possible (Delebarre et5
al., 2004). U௠௙	can be calculated using Equation 7 (Alfredo et al., 2013).6
ܷ௠௙ = 16.50	
ௗమሺఘೞିఘሻ௚
ఓ
(7)7
Where8
ܷ௠௙ = minimum fluidization velocity (m/h)9
d = solid particle diameter (mm)10
ߩ௦, ߩ = specific weight of the solid and the water, respectively (g/m3
)11
µ = dynamic viscosity of water (g/m/h)12
g = acceleration of gravity (m/h2
)13
14
Increasing U௙ leads to increase in liquid circulation and mixing rate, thus a shorter reaction time.15
However, this is only true up to the optimum U௙. On the other hand, very high U௙ is associated with16
particle wash-out from the reactor, especially where FBBRs are employed (Jaafari et al., 2014).17
Therefore, selection of optimum U௙ is necessary to ensure successful operation of FBR.18
Although liquid velocity dominates in a three-phase FBR, the flow regime depends on the ratio of the19
superficial liquid velocity to the superficial gas velocity. Both velocities have to be properly designed and20
controlled. It is necessary to have a small liquid velocity to gas velocity ratio in order to have high mass21
transfer coefficients for counter-current flow FBR (Forster, 1980). However, for a concurrent flow22
process, a high ratio will give a well dispersed bubbles and hence high oxygen transfer rate whereas a23
low ratio would result in bubble coalescence and low oxygen transfer rate (Yu et al., 1999). Both24
M
ANUSCRIPT
ACCEPTED
ACCEPTED MANUSCRIPT
37
superficial liquid and gas velocities will affect solid and liquid holdups. Increasing superficial liquid1
velocity will cause solid particles to expand faster and hence reduces the solid holdup (Akilamudhan et2
al., 2014). This will in turn increase the liquid holdup. On the other hand, gas holdup increases with3
increase in superficial gas velocity (Wei et al., 2000).4
Nikolov et al., (2000) reported that liquid velocity has a weak effect on the oxygen transfer and gas5
velocity has a strong effect in a three phase IFBR. In general, the smaller the amount of air supplied, the6
more economical the process would be which is desirous for industrial applications (Vimonses et al.,7
2010). However, the capacity of FBBR in aerobic wastewater treatment depends on the oxygen transfer8
rate of the aeration system (Forster, 1980).9
Sabarunisha & Radha, (2014) studied the hydrodynamic behavior of an inverse FBBR for phenol10
biodegradation and reported that COD removal increased with an increase in the superficial gas velocity.11
This was attributed to the higher gas holdup, volumetric mass transfer coefficient and oxygen transfer rate12
due to the increased gas velocity. The highest COD and phenol degradation rates were obtained at a gas13
velocity of 0.220 m/s. Above this optimum value, however, the degradation efficiencies became lower. At14
gas velocities above the optimum value, larger bubbles are formed which dominate over the interfacial15
area, resulting in lower mass transfer. U௙ is affected by the properties of bed materials as well as the16
aspect ratio of the reactor (Zhong et al., 2008).17
4.0. Effect of Operational Parameters18
Since FBR is most commonly used in Fenton oxidation, photocatalytic oxidation and aerobic/anaerobic19
treatments, the discussion on the operational parameters has given emphasis to them. Some of the20
operational parameters that affect FBR performance include pH, catalyst concentration, amount of H2O2,21
temperature, UV intensity, HRT, OLR, and amount of carrier materials.22
4.1. pH23
pH has a remarkable effect on FBR-Fenton as efficient degradation of pollutants is attributed to acidic24
pH (Li et al., 2015). This is because the production of OH.
is enhanced at lower pH, usually in the range25
M
ANUSCRIPT
ACCEPTED
ACCEPTED MANUSCRIPT
38
of 2.5 to 4.5 (Malik and Saha, 2003). Higher pH favors the formation of ferric and ferric hydroxide1
complexes which have much lower catalytic capability than ferrous ions. On the other hand, very low pH2
promotes hydrogen formation which may reduce the number of active sites for generating ferrous ions3
(Ratanatamskul et al., 2010). A low pH will lead to the formation of Fe2+
:H2O2 complex, which react4
more slowly with H2O2 and thereby produces OH.
at slower rate. High pH leads to the formation of5
Fe2+
:OH-
complexes which reduces the amount of Fe2+
that are responsible for the decomposition of6
H2O2.7
Chia-Chi et al., (2011) investigated the effect of operational parameters on the decolorisation of textile8
wastewater by FBR-Fenton and reported that the process performance increased as the pH was increased9
from 2 to 3. However, increasing the pH above 3 led to a decrease in the removal efficiency. The10
degradation was highest at pH 3. Low pH was associated with production of FeOOH2+
which compete11
with Fe2+
in reacting with H2O2. At pH above 4, Fe2+
is unstable and easily forms Fe3+
. However, in their12
investigation of parameters affecting FBR-Fenton process for the treatment of recalcitrant organic silicon13
wastewater, Liu et al., (2014) reported that the pH has an insignificant effect on the COD and TOC14
removal. Other parameters such H2O2/Fe2+
and particle loading were found to have more impact on the15
process. Therefore, the effect pH may also depend upon other process parameters such as Fe2+
/H2O216
concentration. From the reviewed literature, the optimum pH in FBR-Fenton process ranges between 2 to17
4 which is quite similar to the range use in conventional Fenton oxidation (Table 1).18
In FBR-Photocatalysis, pH affects the charge on the catalyst particles, size of catalyst aggregates and19
the positions of conductance and valence bands (Meng et al., 2010). At low pH, the environment around20
the photocatalyst would become positively charged and negatively charged at high pH. In order to fully21
study the impact of pH on photocatalytic oxidation, the concept of point of zero charge (PZC) of TiO2 is22
used. The PZC is a condition where the surface charge of TiO2 is zero or neutral and lies in the pH range23
of 4.5 - 7.0. The implication is that the interaction between the photocatalyst and the contaminants is24
minimal. Details on the PCZ have been explained elsewhere (Meng et al., 2010). Under acidic conditions,25
M
ANUSCRIPT
ACCEPTED
ACCEPTED MANUSCRIPT
39
the surface of is TiO2 protonated and deprotonated under alkaline condition (Gaya and Halim, 2008).1
Thus, TiO2 has higher oxidizing power at low pH.2
Nam et al., (2002) investigated the effect of pH on the photocatalytic degradation of methyl orange in a3
three-phase FBR and obtained higher performance at lower pH values. At lower pH, reduction by4
electrons in the conduction band plays an important role in the degradation while at neutral or high pH5
levels, hydroxyl radicals may be the predominant oxidation species. However, very low pH may result in6
excess H+
which can lower the reaction rate.7
In FBBR, pH is an important parameter that affects process performance because of its effect on8
microorganisms. Very high or low pH can affect FBBR performance due to the inhibitory effect of9
superacidity and superalkalinity on the activity of the intracellular enzyme of bacteria (Jianping et al.,10
2003). Lin et al., (2010) studied the biodegradation of Reactive blue 13 in a two-stage anaerobic/aerobic11
FBBR with a Pseudomonas sp. At pH between 5 and 9, the color removal efficiency fluctuated between12
75.6 % to 86.9 %, while the total COD removal efficiency varied between 67.7 % and 90.4 %. The13
optimum pH for the degradation was between 6 and 7.14
Zeroual et al., (2007) investigated the effect of pH (3 to 9) on the decolorisation of different dyes by15
calcium alginate-immobilized Geotrichum sp. in FBBR. Maximum decolorisation was achieved at pH 5.16
Above pH 5, the decolorisation rate decreased significantly. Jianping et al., (2003) studied the effect of17
pH on the denitrification treatment of low C/N ratio nitrate-nitrogen wastewater in a three-phase FBR.18
The optimum pH was found to be between 6.5 to 7.5. Similarly, District et al., (1996) reported an19
improvement in FBBR performance when pH was increased from 7 to 7.5.20
4.2. Temperature21
. Temperature is an important operational parameter, especially in FBBR. Unlike other technologies22
such as a fixed-bed reactor, temperature fluctuation is uncommon in FBBR because of the excellent phase23
mixing. Therefore, t fluidization will improve the process performance in terms of temperature24
uniformity. Nevertheless, it is necessary to establish the optimum temperature for a given process. High25
M
ANUSCRIPT
ACCEPTED
ACCEPTED MANUSCRIPT
40
temperature may cause protein denaturation while low temperature may inhibit the activity of intracellular1
enzymes and result in low metabolism (Jianping et al., 2003).2
For example, an efficient denitrification was achieved at an optimum temperature of 30 o
C during3
autotrophic denitrification using FBBR (Zou et al., 2016) while Jianping et al., (2003) reported an4
optimum temperature between 20 to 35 o
C for the removal of nitrate-nitrogen from wastewater using a5
three-phase FBBR. On the other hand, Zeroual et al., (2007) reported that the decolorisation rate of four6
different dyes using calcium alginate-immobilized Geotrichum sp. increased when the temperature was7
increased from 25 to 35 o
C. However, when the temperature was increased to 45 o
C the decolorisation8
rate decreased drastically. The reduction of decolorisation activity at 45 °C was attributed to the9
denaturation of the enzymes involved in the degradation of the azo dyes and the loss of fungal cell10
viability at high temperature.11
4.3. H2O2 Concentration12
In FBR-Fenton, the concentration of H2O2 determines the potential OH.
that can be generated in the13
reaction. Thus, pollutant degradation increases with increase in H2O2 concentration, until the optimum14
concentration is reached. Beyond the optimum concentration, process performance usually decreases due15
to scavenging effect of the OH.
(Ahmadi et al., 2015). Scavenging effect occurs when the excessive H2O216
acts as radical scavenger and change the more reactive OH.
to a less reactive hydroperoxyl radicals as17
shown in Equations 8 and 9 (Li et al., 2015).18
19
H2O2 + OH.
→ HO2
•
+ H2O (8)20
HO2
•
+ OH.
→ H2O + O2 (9)21
However, the effect of H2O2 on the process is closely linked to the amount of Fe2+
. Therefore, the ratio22
of H2O2 to Fe2+
is equally important. Indeed, some researchers have reported the effect of H2O2 vis-à-vis23
the concentration of Fe2+
(Su et al., 2011). In a study to establish the optimum condition for degrading24
2,4-Dichlorophenol using FBR-Fenton process, H2O2 was found to be the major parameter affecting the25
M
ANUSCRIPT
ACCEPTED
ACCEPTED MANUSCRIPT
41
process (Muangthai et al., 2010). Increasing H2O2 from 1 to 10 mM led to an increased degradation from1
70 % to 98 % at a constant Fe2+
concentration (0.1 mM). Wang et al., (2015) investigated the2
degradation of Orange G in FBR-Fenton and reported that the decolorisation of the dye increases with3
increase in H2O2 up to 25 mg/L.4
There is variation in the optimum amount of H2O2 in the FBR-Fenton process reported in the literature5
(Table 1). Though most of the studies have reported between 50 to 60 mM, others have used6
concentrations outside this range. Since there are differences in the reported studies either from the7
pollutant being degraded or other process parameters, these variations were to be expected. However, all8
the studies have shown that the reaction rate increases with an increase in H2O2 concentration until the9
optimum amount is reached. High concentration may inhibit the degradation due to the scavenging effect10
of the H2O2. Also the ratio of H2O2 to Fe2+
was shown to be significant when discussing the effect of11
H2O2 on the process. Therefore, the optimum dosage of H2O2 is application-specific and depends on other12
parameters such as the Fe2+
concentration.13
4.4. Fe2+
concentration14
Fe2+
acts as a catalyst in decomposing H2O2 to produce OH.
in FBR-Fenton. Therefore, increasing its15
concentration leads to an increase in the production of OH.
. However, increasing the concentration above16
the optimum amount can inhibit the process (Muangthai et al., 2010). This is because excess Fe2+
acts as a17
scavenger, reacting with OH.
and decreasing their availability to oxidize the pollutant. Excess Fe2+
may18
also cause turbidity in the reactor, decreasing light penetration when UV is used (Wang et al., 2015). This19
underscores the importance of establishing the optimum dosage of Fe2+
vis-à-vis the amount of H2O2.20
Previous studies have shown that the concentration of Fe2+
has a positive effect on pollutant21
degradation in FBR-Fenton, with the optimum dosage around 5 mM in most of the reported literature22
(Table 1). Ratanatamskul & Narkwittaya, (2010) found that the degradation of 2,6-dimethylaniline by23
FBR-Fenton process increased from 83 to 100 % when Fe2+
was increased from 1 to 5 mM. The24
optimum concentration was found to be 2.5 mM. In another study, Briones et al., (2012) studied the25
M
ANUSCRIPT
ACCEPTED
ACCEPTED MANUSCRIPT
42
degradation of acetaminophen using FBR-Fenton process and found that increasing the iron concentration1
from 0.01 to 0.1 mmol-1
led to increase in ACT degradation. However, the increase was more evident at2
acidic pH.3
4.5. Photocatalyst Concentration4
FBR-Photocatalysis uses metal oxide, usually TiO2, as the photocatalyst. The concentration of TiO2 has5
a strong effect on the rate of photocatalytic process and hence, the performance of the reactor. When the6
amount of TiO2 is increased, the photocatalytic activity increases and therefore higher degradation rate is7
obtained. This is because the surface area available for photocatalytic reaction increases with an increased8
in the catalyst concentration. However, increasing the concentration above the saturation level may lead9
to turbidity (Meng et al., 2010) which reduces light penetration into the reaction matrix and hinders the10
photocatalytic performance of the reactor (Zulfakar et al., 2011). Also from an economic viewpoint,11
excess catalysts should be avoided so as to keep the operating cost as low as possible. Therefore, it is12
imperative to establish the optimum dosage of the TiO2. Where immobilized TiO2 is used, additional13
removal is obtained via adsorption of pollutants on the surface of the solid.14
Youngsoo Na et al., (2005) studied the photocatalytic decolorisation of rhodamine B by immobilized15
TiO2 /UV in an FBR and reported that the decolorisation rate increased with increase in TiO2 dosage. The16
immobilized TiO2 was responsible for both degradation and adsorption of the dye. However, since UV17
light was used, excessive amount of the catalyst could hinder light penetration. A dosage of 33.8 g/L was18
found to be the optimum concentration. Details of typical photocatalyst concentrations reported in the19
literature can be found in Table 2.20
4.6. UV Intensity21
A source of photons, mostly UV lamp, is usually introduced into FBR-photocatalysis and FBR-Photo-22
Fenton processes. The rate of photon increases as the number and intensity of UV lamps increase. The23
degradation efficiency of FBR-photocatalysis increases with UV light intensity, and shorter wavelength24
gives higher degradation (Lim and Kim, 2002). Shorter wavelength light is adsorbed more strongly by25
M
ANUSCRIPT
ACCEPTED
ACCEPTED MANUSCRIPT
43
TiO2 particles than longer one. Therefore, the penetration distance of photons into TiO2 particles is shorter1
and electrons and holes are formed closer to the surface of the particles.2
In their study for the Photooxidation of sodium lauryl sulfate in a three-phase FBR using TiO2/SiO2 ,3
Nam et al., (2009) found that the degradation rate increased with an increase in the UV light intensity.4
The intensity of light determines the potential number of photons that can be generated and hence the5
number of photons that may eventually reach the catalyst surface. Thus a 65 W lamp gave a better6
performance than a 30 W lamp.7
Also the position of the UV lamp in relation to the reaction matrix is also important. The closer the lamp8
is to the reaction matrix the higher the amount of photons reaching the reactants. Kanki et al., (2005)9
investigated the influence of UV irradiation on FBR-photocatalytic process using TiO2-coated ceramic10
particles. Two FBRs, one with an internal UV lamp (254 nm, 9 W) and the other with an outside black11
lamp (365 nm, 15 W) were used. The reactor with the internal UV lamp degraded the pollutant 4 times12
faster than the other reactor. This signifies the importance of the proximity of the light source to the13
reaction matrix.14
4.7. Hydraulic Retention Time (HRT)15
HRT is the average length of time the wastewater stays in the reactor. Generally, long HRT leads to a16
better performance of FBR-AOPs, until the optimum time is reached. Above the optimum HRT, there is17
usually little or no further degradation of the pollutant. During a treatment of recalcitrant organic silicone18
wastewater using FBR-Fenton, Liu et al., (2014) found out that the degradation of COD and TOC19
increased as the HRT was increased from 15 – 60 min, with no further degradation thereafter. Thus, the20
optimum HRT was 60 min corresponding to COD and TOC removal efficiency of 90 % and 78 %21
respectively. In another study for COD removal from hospital wastewater, 98 % removal efficiency was22
achieved at an HRT of 90 minutes (Anand et al., 2015).23
In FBBR, any change in HRT is likely to affect the OLR and hence the performance of the reactor24
(Haroun and Idris, 2009). The efficiency of pollutant removal in FBBR is a function of the HRT which is25
M
ANUSCRIPT
ACCEPTED
ACCEPTED MANUSCRIPT
44
concomitant with OLR (Perez et al., 2007). Increasing the HRT leads to a decrease in OLR, other1
conditions being equal. For a constant OLR, increase in HRT will lead to higher performance of the2
process as microorganisms will have more time to degrade the pollutant. However, above the optimum3
HRT, the process becomes independent of the HRT (Borja et al., 2001). Although HRT can be controlled4
through flow rate manipulation, it may pose fluidization challenges for the bioparticles (Christianson et5
al., 2015). Thus, there is a need for a trade-off between the HRT and flow rates to obtain the optimum6
condition for each process.7
For aerobic FBBR, the optimum degradation is usually achieved within a short HRT, depending on the8
microorganisms, pollutants and other operational parameters (Table 3). Rajasimman & Karthikeyan,9
(2007) investigated the effect of HRT on the treatment of starch wastewater in an aerobic FBBR and10
reported that the COD reduction increased with increased in HRT for all initial substrate concentrations.11
The optimum removal efficiency of 93.8 5% was achieved after 24 h.12
The effect of HRT on anaerobic FBBR follows the same trend as that of aerobic FBBR. Cuenca et al.,13
(2006) investigated the anaerobic biodegradation of diesel fuel-contaminated wastewater in an FBBR and14
reported that both the diesel and COD removal efficiencies increased with increased in HRT for all the15
conditions investigated. Lin et al., (2010) studied the effect of HRT on dye degradation using a two-stage16
anaerobic/aerobic FBR and reported that the overall degradation was enhanced when HRT was increased17
from 20 h to 70 h.18
4.8. Organic Loading Rate (OLR)19
OLR is the measure of organic pollutants which is expressed as kilogram (kg) of COD per cubic-meter20
(m3
) per day (d). In FBBR, OLR is normally manipulated through variation of flowrate. When OLR is21
increased, the performance of the system reduces due to shock and disturbance on the biomass. However,22
the microorganisms adjust to the new OLR and the process performance usually resumes. Good FBBR23
performance is usually associated with low OLR (Balaji and Poongothai, 2012). On the other hand, when24
the substrate is limiting in the process, increasing OLR can improve the process performance (Fernández25
4. bello 2017. applications of fluidized bed reactor in wastewater treatment

More Related Content

What's hot

Production of Bio-diesel (Butyl Oleate) by Reactive Distillation Technique
Production of Bio-diesel (Butyl Oleate) by Reactive Distillation TechniqueProduction of Bio-diesel (Butyl Oleate) by Reactive Distillation Technique
Production of Bio-diesel (Butyl Oleate) by Reactive Distillation TechniqueIRJET Journal
 
Screening and extraction of heavy metals from anaerobically digested sewage s...
Screening and extraction of heavy metals from anaerobically digested sewage s...Screening and extraction of heavy metals from anaerobically digested sewage s...
Screening and extraction of heavy metals from anaerobically digested sewage s...IRJET Journal
 
Effect of co2 sequestration on headspace
Effect of co2 sequestration on  headspaceEffect of co2 sequestration on  headspace
Effect of co2 sequestration on headspacePreethi Velayutham
 
Activated sludge
Activated sludgeActivated sludge
Activated sludgeAnkit Ojha
 
International Refereed Journal of Engineering and Science (IRJES)
International Refereed Journal of Engineering and Science (IRJES)International Refereed Journal of Engineering and Science (IRJES)
International Refereed Journal of Engineering and Science (IRJES)irjes
 
Economic feasibility report on cetp using physico chemical process-a case study
Economic feasibility report on cetp using physico chemical process-a case studyEconomic feasibility report on cetp using physico chemical process-a case study
Economic feasibility report on cetp using physico chemical process-a case studyeSAT Publishing House
 
OPTIMIZATION OF SODA ASH ENVIRONMENTAL IMPACT USING LCA TOOL
OPTIMIZATION OF SODA ASH ENVIRONMENTAL IMPACT USING LCA   TOOLOPTIMIZATION OF SODA ASH ENVIRONMENTAL IMPACT USING LCA   TOOL
OPTIMIZATION OF SODA ASH ENVIRONMENTAL IMPACT USING LCA TOOLIJARIIE JOURNAL
 
FEASIBILITY STUDY OF TREATMENT OF EFFLUENT FROM A BULK DRUG MANUFACTURING IND...
FEASIBILITY STUDY OF TREATMENT OF EFFLUENT FROM A BULK DRUG MANUFACTURING IND...FEASIBILITY STUDY OF TREATMENT OF EFFLUENT FROM A BULK DRUG MANUFACTURING IND...
FEASIBILITY STUDY OF TREATMENT OF EFFLUENT FROM A BULK DRUG MANUFACTURING IND...Journal For Research
 
Activated sludge calculations with excel course
Activated sludge calculations with excel courseActivated sludge calculations with excel course
Activated sludge calculations with excel coursezubeditufail
 
Fluoride Executive Summary
Fluoride Executive SummaryFluoride Executive Summary
Fluoride Executive SummaryAmlan Sinha
 
IRJET- Characterisation of Grey Water and Treatment using Moving Bed Biof...
IRJET-  	  Characterisation of Grey Water and Treatment using Moving Bed Biof...IRJET-  	  Characterisation of Grey Water and Treatment using Moving Bed Biof...
IRJET- Characterisation of Grey Water and Treatment using Moving Bed Biof...IRJET Journal
 
Activated Sludge Process
Activated Sludge ProcessActivated Sludge Process
Activated Sludge ProcessNiaz Memon
 
IRJET- A Review on Utilization of Sequence Batch Reactor Technology (SBR)...
IRJET-  	  A Review on Utilization of Sequence Batch Reactor Technology (SBR)...IRJET-  	  A Review on Utilization of Sequence Batch Reactor Technology (SBR)...
IRJET- A Review on Utilization of Sequence Batch Reactor Technology (SBR)...IRJET Journal
 

What's hot (19)

Production of Bio-diesel (Butyl Oleate) by Reactive Distillation Technique
Production of Bio-diesel (Butyl Oleate) by Reactive Distillation TechniqueProduction of Bio-diesel (Butyl Oleate) by Reactive Distillation Technique
Production of Bio-diesel (Butyl Oleate) by Reactive Distillation Technique
 
Fn35985990
Fn35985990Fn35985990
Fn35985990
 
Presentation of Berezutskyi 1
Presentation of Berezutskyi 1Presentation of Berezutskyi 1
Presentation of Berezutskyi 1
 
Screening and extraction of heavy metals from anaerobically digested sewage s...
Screening and extraction of heavy metals from anaerobically digested sewage s...Screening and extraction of heavy metals from anaerobically digested sewage s...
Screening and extraction of heavy metals from anaerobically digested sewage s...
 
Msc thesis defence power point
Msc thesis defence power pointMsc thesis defence power point
Msc thesis defence power point
 
Effect of co2 sequestration on headspace
Effect of co2 sequestration on  headspaceEffect of co2 sequestration on  headspace
Effect of co2 sequestration on headspace
 
Activated sludge
Activated sludgeActivated sludge
Activated sludge
 
International Refereed Journal of Engineering and Science (IRJES)
International Refereed Journal of Engineering and Science (IRJES)International Refereed Journal of Engineering and Science (IRJES)
International Refereed Journal of Engineering and Science (IRJES)
 
Economic feasibility report on cetp using physico chemical process-a case study
Economic feasibility report on cetp using physico chemical process-a case studyEconomic feasibility report on cetp using physico chemical process-a case study
Economic feasibility report on cetp using physico chemical process-a case study
 
Thesis Defense Presentation
Thesis Defense PresentationThesis Defense Presentation
Thesis Defense Presentation
 
OPTIMIZATION OF SODA ASH ENVIRONMENTAL IMPACT USING LCA TOOL
OPTIMIZATION OF SODA ASH ENVIRONMENTAL IMPACT USING LCA   TOOLOPTIMIZATION OF SODA ASH ENVIRONMENTAL IMPACT USING LCA   TOOL
OPTIMIZATION OF SODA ASH ENVIRONMENTAL IMPACT USING LCA TOOL
 
FEASIBILITY STUDY OF TREATMENT OF EFFLUENT FROM A BULK DRUG MANUFACTURING IND...
FEASIBILITY STUDY OF TREATMENT OF EFFLUENT FROM A BULK DRUG MANUFACTURING IND...FEASIBILITY STUDY OF TREATMENT OF EFFLUENT FROM A BULK DRUG MANUFACTURING IND...
FEASIBILITY STUDY OF TREATMENT OF EFFLUENT FROM A BULK DRUG MANUFACTURING IND...
 
Alghe oil
Alghe oilAlghe oil
Alghe oil
 
Activated sludge calculations with excel course
Activated sludge calculations with excel courseActivated sludge calculations with excel course
Activated sludge calculations with excel course
 
Fluoride Executive Summary
Fluoride Executive SummaryFluoride Executive Summary
Fluoride Executive Summary
 
IRJET- Characterisation of Grey Water and Treatment using Moving Bed Biof...
IRJET-  	  Characterisation of Grey Water and Treatment using Moving Bed Biof...IRJET-  	  Characterisation of Grey Water and Treatment using Moving Bed Biof...
IRJET- Characterisation of Grey Water and Treatment using Moving Bed Biof...
 
Activated Sludge Process
Activated Sludge ProcessActivated Sludge Process
Activated Sludge Process
 
IRJET- A Review on Utilization of Sequence Batch Reactor Technology (SBR)...
IRJET-  	  A Review on Utilization of Sequence Batch Reactor Technology (SBR)...IRJET-  	  A Review on Utilization of Sequence Batch Reactor Technology (SBR)...
IRJET- A Review on Utilization of Sequence Batch Reactor Technology (SBR)...
 
20320130406020 2
20320130406020 220320130406020 2
20320130406020 2
 

Similar to 4. bello 2017. applications of fluidized bed reactor in wastewater treatment

sewer treatment proposal.pptx
sewer treatment proposal.pptxsewer treatment proposal.pptx
sewer treatment proposal.pptxThushan9
 
Optimizing the Reverse Osmosis Process Parameters by Maximizing Recovery by T...
Optimizing the Reverse Osmosis Process Parameters by Maximizing Recovery by T...Optimizing the Reverse Osmosis Process Parameters by Maximizing Recovery by T...
Optimizing the Reverse Osmosis Process Parameters by Maximizing Recovery by T...QUESTJOURNAL
 
Hydrothermal liquefaction of_foodwaste_mqp_final
Hydrothermal liquefaction of_foodwaste_mqp_finalHydrothermal liquefaction of_foodwaste_mqp_final
Hydrothermal liquefaction of_foodwaste_mqp_finalMuhammad Usman
 
Ammonia Recovery using membrane distillation
Ammonia Recovery using membrane distillationAmmonia Recovery using membrane distillation
Ammonia Recovery using membrane distillationChristos Charisiadis
 
Exergo-economic analysis of a seawater reverse osmosis plant with various ret...
Exergo-economic analysis of a seawater reverse osmosis plant with various ret...Exergo-economic analysis of a seawater reverse osmosis plant with various ret...
Exergo-economic analysis of a seawater reverse osmosis plant with various ret...ahmad598
 
A review of imperative technologies for for waste water tratament 1
A review of imperative technologies for for waste water tratament 1A review of imperative technologies for for waste water tratament 1
A review of imperative technologies for for waste water tratament 1Edgy Rod
 
Optimization of ZLD in Distillery Industry by Reverse Osmosis Process for Pre...
Optimization of ZLD in Distillery Industry by Reverse Osmosis Process for Pre...Optimization of ZLD in Distillery Industry by Reverse Osmosis Process for Pre...
Optimization of ZLD in Distillery Industry by Reverse Osmosis Process for Pre...ijceronline
 
Leachate generation from tsdf and its treatment options
Leachate generation from tsdf and its treatment optionsLeachate generation from tsdf and its treatment options
Leachate generation from tsdf and its treatment optionsAyushi Chaturvedi
 
Existing biological nitrogen removal processes and current scope of advancement
Existing biological nitrogen removal processes and current scope of advancementExisting biological nitrogen removal processes and current scope of advancement
Existing biological nitrogen removal processes and current scope of advancementSandip Magdum
 
Biogas portal article srinivas kasulla
Biogas portal  article srinivas kasullaBiogas portal  article srinivas kasulla
Biogas portal article srinivas kasullaSrinivas Kasulla
 
Biological treatments of water
Biological treatments of waterBiological treatments of water
Biological treatments of waterMozakkir Azad
 
Hydrochar for-industrial-wastewater-treatment-an-overview-on-its-advantages-a...
Hydrochar for-industrial-wastewater-treatment-an-overview-on-its-advantages-a...Hydrochar for-industrial-wastewater-treatment-an-overview-on-its-advantages-a...
Hydrochar for-industrial-wastewater-treatment-an-overview-on-its-advantages-a...Ahmed Hasham
 
Completed Final Year Project
Completed Final Year ProjectCompleted Final Year Project
Completed Final Year ProjectAilbhe Gullane
 
Performance evaluation of modified lab-scale UASB reactor with different OLR ...
Performance evaluation of modified lab-scale UASB reactor with different OLR ...Performance evaluation of modified lab-scale UASB reactor with different OLR ...
Performance evaluation of modified lab-scale UASB reactor with different OLR ...IRJET Journal
 
Process optimization potential china chemicals
Process optimization potential china chemicalsProcess optimization potential china chemicals
Process optimization potential china chemicalsKai Pflug
 
Production of Syngas from Biomass
Production of Syngas from Biomass  Production of Syngas from Biomass
Production of Syngas from Biomass Awais Chaudhary
 
Performance Evaluation of STP’s based on Different Technologies
Performance Evaluation of STP’s based on Different TechnologiesPerformance Evaluation of STP’s based on Different Technologies
Performance Evaluation of STP’s based on Different TechnologiesIRJET Journal
 

Similar to 4. bello 2017. applications of fluidized bed reactor in wastewater treatment (20)

MAKENDRAN C
MAKENDRAN CMAKENDRAN C
MAKENDRAN C
 
sewer treatment proposal.pptx
sewer treatment proposal.pptxsewer treatment proposal.pptx
sewer treatment proposal.pptx
 
Optimizing the Reverse Osmosis Process Parameters by Maximizing Recovery by T...
Optimizing the Reverse Osmosis Process Parameters by Maximizing Recovery by T...Optimizing the Reverse Osmosis Process Parameters by Maximizing Recovery by T...
Optimizing the Reverse Osmosis Process Parameters by Maximizing Recovery by T...
 
Hydrothermal liquefaction of_foodwaste_mqp_final
Hydrothermal liquefaction of_foodwaste_mqp_finalHydrothermal liquefaction of_foodwaste_mqp_final
Hydrothermal liquefaction of_foodwaste_mqp_final
 
Ammonia Recovery using membrane distillation
Ammonia Recovery using membrane distillationAmmonia Recovery using membrane distillation
Ammonia Recovery using membrane distillation
 
Exergo-economic analysis of a seawater reverse osmosis plant with various ret...
Exergo-economic analysis of a seawater reverse osmosis plant with various ret...Exergo-economic analysis of a seawater reverse osmosis plant with various ret...
Exergo-economic analysis of a seawater reverse osmosis plant with various ret...
 
A review of imperative technologies for for waste water tratament 1
A review of imperative technologies for for waste water tratament 1A review of imperative technologies for for waste water tratament 1
A review of imperative technologies for for waste water tratament 1
 
Optimization of ZLD in Distillery Industry by Reverse Osmosis Process for Pre...
Optimization of ZLD in Distillery Industry by Reverse Osmosis Process for Pre...Optimization of ZLD in Distillery Industry by Reverse Osmosis Process for Pre...
Optimization of ZLD in Distillery Industry by Reverse Osmosis Process for Pre...
 
Leachate generation from tsdf and its treatment options
Leachate generation from tsdf and its treatment optionsLeachate generation from tsdf and its treatment options
Leachate generation from tsdf and its treatment options
 
Existing biological nitrogen removal processes and current scope of advancement
Existing biological nitrogen removal processes and current scope of advancementExisting biological nitrogen removal processes and current scope of advancement
Existing biological nitrogen removal processes and current scope of advancement
 
Biogas portal article srinivas kasulla
Biogas portal  article srinivas kasullaBiogas portal  article srinivas kasulla
Biogas portal article srinivas kasulla
 
Biological treatments of water
Biological treatments of waterBiological treatments of water
Biological treatments of water
 
Hydrochar for-industrial-wastewater-treatment-an-overview-on-its-advantages-a...
Hydrochar for-industrial-wastewater-treatment-an-overview-on-its-advantages-a...Hydrochar for-industrial-wastewater-treatment-an-overview-on-its-advantages-a...
Hydrochar for-industrial-wastewater-treatment-an-overview-on-its-advantages-a...
 
Completed Final Year Project
Completed Final Year ProjectCompleted Final Year Project
Completed Final Year Project
 
Performance evaluation of modified lab-scale UASB reactor with different OLR ...
Performance evaluation of modified lab-scale UASB reactor with different OLR ...Performance evaluation of modified lab-scale UASB reactor with different OLR ...
Performance evaluation of modified lab-scale UASB reactor with different OLR ...
 
Sinkwastecare
SinkwastecareSinkwastecare
Sinkwastecare
 
Process optimization potential china chemicals
Process optimization potential china chemicalsProcess optimization potential china chemicals
Process optimization potential china chemicals
 
Production of Syngas from Biomass
Production of Syngas from Biomass  Production of Syngas from Biomass
Production of Syngas from Biomass
 
Performance Evaluation of STP’s based on Different Technologies
Performance Evaluation of STP’s based on Different TechnologiesPerformance Evaluation of STP’s based on Different Technologies
Performance Evaluation of STP’s based on Different Technologies
 
Article 2.pdf
Article 2.pdfArticle 2.pdf
Article 2.pdf
 

More from Britani Keith

28 problemas resueltos (1)
28 problemas resueltos (1)28 problemas resueltos (1)
28 problemas resueltos (1)Britani Keith
 
Carga y descarga de un condensador
Carga y descarga de un condensadorCarga y descarga de un condensador
Carga y descarga de un condensadorBritani Keith
 
Obtención de-fibra-dietética-a-partir-de-sáculos-de-naranja-aplicando-un-trat...
Obtención de-fibra-dietética-a-partir-de-sáculos-de-naranja-aplicando-un-trat...Obtención de-fibra-dietética-a-partir-de-sáculos-de-naranja-aplicando-un-trat...
Obtención de-fibra-dietética-a-partir-de-sáculos-de-naranja-aplicando-un-trat...Britani Keith
 

More from Britani Keith (6)

Minerales tabla
Minerales tablaMinerales tabla
Minerales tabla
 
Gold pyrite
Gold pyriteGold pyrite
Gold pyrite
 
LA COMPUTACION
LA COMPUTACIONLA COMPUTACION
LA COMPUTACION
 
28 problemas resueltos (1)
28 problemas resueltos (1)28 problemas resueltos (1)
28 problemas resueltos (1)
 
Carga y descarga de un condensador
Carga y descarga de un condensadorCarga y descarga de un condensador
Carga y descarga de un condensador
 
Obtención de-fibra-dietética-a-partir-de-sáculos-de-naranja-aplicando-un-trat...
Obtención de-fibra-dietética-a-partir-de-sáculos-de-naranja-aplicando-un-trat...Obtención de-fibra-dietética-a-partir-de-sáculos-de-naranja-aplicando-un-trat...
Obtención de-fibra-dietética-a-partir-de-sáculos-de-naranja-aplicando-un-trat...
 

Recently uploaded

Introduction to IEEE STANDARDS and its different types.pptx
Introduction to IEEE STANDARDS and its different types.pptxIntroduction to IEEE STANDARDS and its different types.pptx
Introduction to IEEE STANDARDS and its different types.pptxupamatechverse
 
Structural Analysis and Design of Foundations: A Comprehensive Handbook for S...
Structural Analysis and Design of Foundations: A Comprehensive Handbook for S...Structural Analysis and Design of Foundations: A Comprehensive Handbook for S...
Structural Analysis and Design of Foundations: A Comprehensive Handbook for S...Dr.Costas Sachpazis
 
APPLICATIONS-AC/DC DRIVES-OPERATING CHARACTERISTICS
APPLICATIONS-AC/DC DRIVES-OPERATING CHARACTERISTICSAPPLICATIONS-AC/DC DRIVES-OPERATING CHARACTERISTICS
APPLICATIONS-AC/DC DRIVES-OPERATING CHARACTERISTICSKurinjimalarL3
 
What are the advantages and disadvantages of membrane structures.pptx
What are the advantages and disadvantages of membrane structures.pptxWhat are the advantages and disadvantages of membrane structures.pptx
What are the advantages and disadvantages of membrane structures.pptxwendy cai
 
(MEERA) Dapodi Call Girls Just Call 7001035870 [ Cash on Delivery ] Pune Escorts
(MEERA) Dapodi Call Girls Just Call 7001035870 [ Cash on Delivery ] Pune Escorts(MEERA) Dapodi Call Girls Just Call 7001035870 [ Cash on Delivery ] Pune Escorts
(MEERA) Dapodi Call Girls Just Call 7001035870 [ Cash on Delivery ] Pune Escortsranjana rawat
 
High Profile Call Girls Nagpur Meera Call 7001035870 Meet With Nagpur Escorts
High Profile Call Girls Nagpur Meera Call 7001035870 Meet With Nagpur EscortsHigh Profile Call Girls Nagpur Meera Call 7001035870 Meet With Nagpur Escorts
High Profile Call Girls Nagpur Meera Call 7001035870 Meet With Nagpur EscortsCall Girls in Nagpur High Profile
 
VIP Call Girls Service Kondapur Hyderabad Call +91-8250192130
VIP Call Girls Service Kondapur Hyderabad Call +91-8250192130VIP Call Girls Service Kondapur Hyderabad Call +91-8250192130
VIP Call Girls Service Kondapur Hyderabad Call +91-8250192130Suhani Kapoor
 
(PRIYA) Rajgurunagar Call Girls Just Call 7001035870 [ Cash on Delivery ] Pun...
(PRIYA) Rajgurunagar Call Girls Just Call 7001035870 [ Cash on Delivery ] Pun...(PRIYA) Rajgurunagar Call Girls Just Call 7001035870 [ Cash on Delivery ] Pun...
(PRIYA) Rajgurunagar Call Girls Just Call 7001035870 [ Cash on Delivery ] Pun...ranjana rawat
 
Biology for Computer Engineers Course Handout.pptx
Biology for Computer Engineers Course Handout.pptxBiology for Computer Engineers Course Handout.pptx
Biology for Computer Engineers Course Handout.pptxDeepakSakkari2
 
Internship report on mechanical engineering
Internship report on mechanical engineeringInternship report on mechanical engineering
Internship report on mechanical engineeringmalavadedarshan25
 
Processing & Properties of Floor and Wall Tiles.pptx
Processing & Properties of Floor and Wall Tiles.pptxProcessing & Properties of Floor and Wall Tiles.pptx
Processing & Properties of Floor and Wall Tiles.pptxpranjaldaimarysona
 
OSVC_Meta-Data based Simulation Automation to overcome Verification Challenge...
OSVC_Meta-Data based Simulation Automation to overcome Verification Challenge...OSVC_Meta-Data based Simulation Automation to overcome Verification Challenge...
OSVC_Meta-Data based Simulation Automation to overcome Verification Challenge...Soham Mondal
 
Porous Ceramics seminar and technical writing
Porous Ceramics seminar and technical writingPorous Ceramics seminar and technical writing
Porous Ceramics seminar and technical writingrakeshbaidya232001
 
(RIA) Call Girls Bhosari ( 7001035870 ) HI-Fi Pune Escorts Service
(RIA) Call Girls Bhosari ( 7001035870 ) HI-Fi Pune Escorts Service(RIA) Call Girls Bhosari ( 7001035870 ) HI-Fi Pune Escorts Service
(RIA) Call Girls Bhosari ( 7001035870 ) HI-Fi Pune Escorts Serviceranjana rawat
 
Introduction and different types of Ethernet.pptx
Introduction and different types of Ethernet.pptxIntroduction and different types of Ethernet.pptx
Introduction and different types of Ethernet.pptxupamatechverse
 

Recently uploaded (20)

Introduction to IEEE STANDARDS and its different types.pptx
Introduction to IEEE STANDARDS and its different types.pptxIntroduction to IEEE STANDARDS and its different types.pptx
Introduction to IEEE STANDARDS and its different types.pptx
 
9953056974 Call Girls In South Ex, Escorts (Delhi) NCR.pdf
9953056974 Call Girls In South Ex, Escorts (Delhi) NCR.pdf9953056974 Call Girls In South Ex, Escorts (Delhi) NCR.pdf
9953056974 Call Girls In South Ex, Escorts (Delhi) NCR.pdf
 
Structural Analysis and Design of Foundations: A Comprehensive Handbook for S...
Structural Analysis and Design of Foundations: A Comprehensive Handbook for S...Structural Analysis and Design of Foundations: A Comprehensive Handbook for S...
Structural Analysis and Design of Foundations: A Comprehensive Handbook for S...
 
DJARUM4D - SLOT GACOR ONLINE | SLOT DEMO ONLINE
DJARUM4D - SLOT GACOR ONLINE | SLOT DEMO ONLINEDJARUM4D - SLOT GACOR ONLINE | SLOT DEMO ONLINE
DJARUM4D - SLOT GACOR ONLINE | SLOT DEMO ONLINE
 
APPLICATIONS-AC/DC DRIVES-OPERATING CHARACTERISTICS
APPLICATIONS-AC/DC DRIVES-OPERATING CHARACTERISTICSAPPLICATIONS-AC/DC DRIVES-OPERATING CHARACTERISTICS
APPLICATIONS-AC/DC DRIVES-OPERATING CHARACTERISTICS
 
What are the advantages and disadvantages of membrane structures.pptx
What are the advantages and disadvantages of membrane structures.pptxWhat are the advantages and disadvantages of membrane structures.pptx
What are the advantages and disadvantages of membrane structures.pptx
 
Call Us -/9953056974- Call Girls In Vikaspuri-/- Delhi NCR
Call Us -/9953056974- Call Girls In Vikaspuri-/- Delhi NCRCall Us -/9953056974- Call Girls In Vikaspuri-/- Delhi NCR
Call Us -/9953056974- Call Girls In Vikaspuri-/- Delhi NCR
 
(MEERA) Dapodi Call Girls Just Call 7001035870 [ Cash on Delivery ] Pune Escorts
(MEERA) Dapodi Call Girls Just Call 7001035870 [ Cash on Delivery ] Pune Escorts(MEERA) Dapodi Call Girls Just Call 7001035870 [ Cash on Delivery ] Pune Escorts
(MEERA) Dapodi Call Girls Just Call 7001035870 [ Cash on Delivery ] Pune Escorts
 
Exploring_Network_Security_with_JA3_by_Rakesh Seal.pptx
Exploring_Network_Security_with_JA3_by_Rakesh Seal.pptxExploring_Network_Security_with_JA3_by_Rakesh Seal.pptx
Exploring_Network_Security_with_JA3_by_Rakesh Seal.pptx
 
High Profile Call Girls Nagpur Meera Call 7001035870 Meet With Nagpur Escorts
High Profile Call Girls Nagpur Meera Call 7001035870 Meet With Nagpur EscortsHigh Profile Call Girls Nagpur Meera Call 7001035870 Meet With Nagpur Escorts
High Profile Call Girls Nagpur Meera Call 7001035870 Meet With Nagpur Escorts
 
VIP Call Girls Service Kondapur Hyderabad Call +91-8250192130
VIP Call Girls Service Kondapur Hyderabad Call +91-8250192130VIP Call Girls Service Kondapur Hyderabad Call +91-8250192130
VIP Call Girls Service Kondapur Hyderabad Call +91-8250192130
 
(PRIYA) Rajgurunagar Call Girls Just Call 7001035870 [ Cash on Delivery ] Pun...
(PRIYA) Rajgurunagar Call Girls Just Call 7001035870 [ Cash on Delivery ] Pun...(PRIYA) Rajgurunagar Call Girls Just Call 7001035870 [ Cash on Delivery ] Pun...
(PRIYA) Rajgurunagar Call Girls Just Call 7001035870 [ Cash on Delivery ] Pun...
 
Biology for Computer Engineers Course Handout.pptx
Biology for Computer Engineers Course Handout.pptxBiology for Computer Engineers Course Handout.pptx
Biology for Computer Engineers Course Handout.pptx
 
Internship report on mechanical engineering
Internship report on mechanical engineeringInternship report on mechanical engineering
Internship report on mechanical engineering
 
Processing & Properties of Floor and Wall Tiles.pptx
Processing & Properties of Floor and Wall Tiles.pptxProcessing & Properties of Floor and Wall Tiles.pptx
Processing & Properties of Floor and Wall Tiles.pptx
 
OSVC_Meta-Data based Simulation Automation to overcome Verification Challenge...
OSVC_Meta-Data based Simulation Automation to overcome Verification Challenge...OSVC_Meta-Data based Simulation Automation to overcome Verification Challenge...
OSVC_Meta-Data based Simulation Automation to overcome Verification Challenge...
 
★ CALL US 9953330565 ( HOT Young Call Girls In Badarpur delhi NCR
★ CALL US 9953330565 ( HOT Young Call Girls In Badarpur delhi NCR★ CALL US 9953330565 ( HOT Young Call Girls In Badarpur delhi NCR
★ CALL US 9953330565 ( HOT Young Call Girls In Badarpur delhi NCR
 
Porous Ceramics seminar and technical writing
Porous Ceramics seminar and technical writingPorous Ceramics seminar and technical writing
Porous Ceramics seminar and technical writing
 
(RIA) Call Girls Bhosari ( 7001035870 ) HI-Fi Pune Escorts Service
(RIA) Call Girls Bhosari ( 7001035870 ) HI-Fi Pune Escorts Service(RIA) Call Girls Bhosari ( 7001035870 ) HI-Fi Pune Escorts Service
(RIA) Call Girls Bhosari ( 7001035870 ) HI-Fi Pune Escorts Service
 
Introduction and different types of Ethernet.pptx
Introduction and different types of Ethernet.pptxIntroduction and different types of Ethernet.pptx
Introduction and different types of Ethernet.pptx
 

4. bello 2017. applications of fluidized bed reactor in wastewater treatment

  • 1. Accepted Manuscript Applications of fluidized bed reactor in wastewater treatment – A review of the major design and operational parameters Mustapha Mohammed Bello, Abdul Aziz Abdul Raman, Monash Purushothaman PII: S0959-6526(16)31490-1 DOI: 10.1016/j.jclepro.2016.09.148 Reference: JCLP 8108 To appear in: Journal of Cleaner Production Received Date: 8 May 2016 Revised Date: 11 August 2016 Accepted Date: 18 September 2016 Please cite this article as: Bello MM, Abdul Raman AA, Purushothaman M, Applications of fluidized bed reactor in wastewater treatment – A review of the major design and operational parameters, Journal of Cleaner Production (2016), doi: 10.1016/j.jclepro.2016.09.148. This is a PDF file of an unedited manuscript that has been accepted for publication. As a service to our customers we are providing this early version of the manuscript. The manuscript will undergo copyediting, typesetting, and review of the resulting proof before it is published in its final form. Please note that during the production process errors may be discovered which could affect the content, and all legal disclaimers that apply to the journal pertain.
  • 2. M ANUSCRIPT ACCEPTED ACCEPTED MANUSCRIPT Effluent Influent Recycle Distributor Fluidizedmedia REACTOR GEOMETRY ▪ Reactor Shape ▪ Reactor Internals ▪ Aspect Ratio CHARACTERISTICS OF SUPPORT MATERIAL ▪ Hyrdraulic Retention Time (HRT) ▪ Catalyst Concentration ▪ Temperature ▪ pH Particles Loading ▪ Particles Density ▪ Particles Size ▪ SUPERFICIALFLUID VELOCITY REACTOR'S INTERNAL PROPERTIES
  • 3. M ANUSCRIPT ACCEPTED ACCEPTED MANUSCRIPT 1 Word Count: 21,0201 1 Abbreviations2 Applications of Fluidized Bed Reactor in Wastewater Treatment – A Review of the Major Design3 and Operational Parameters4 Mustapha Mohammed Bello a , Abdul Aziz Abdul Raman a, *, Monash Purushothaman b 5 a Department of Chemical Engineering, Faculty of Engineering, University of Malaya, Kuala Lumpur,6 50603, Malaysia7 b Department of Chemical Engineering, School of Civil and Chemical Engineering (SCALE), VIT8 University, Vellore – 632014, Tamilnadu, India9 *Corresponding author: Email: aziz@um.edu.my (A. A. Abdul Raman),10 mmbello.cda@buk.edu.ng (M. M. Bello)11 monash.purushothaman@vit.ac.in (M. Purushothaman)12 Tel: +60 3 79675300; fax: +60 3 79675319.13 Abstract14 One of the current challenges of wastewater treatment is the presence of recalcitrant pollutants which are15 difficult to remove using conventional treatment technologies. This poses a threat to environmental16 sustainability and hinders the efforts of many industries to adopt cleaner production through zero-17 discharge and subsequent wastewater reuse. Effective wastewater treatment technologies are therefore18 needed to address this challenge. Accordingly, the last few years have seen intensified effort to develop19 more effective wastewater treatment technologies. The use of fluidized bed reactor in wastewater20 treatment, particularly Advanced Oxidation Processes and biological treatment, represents a unique21 opportunity for cost-effective treatment of wastewater containing recalcitrant pollutants. Although the22 Abbreviations: AOPs: Advanced oxidation processes; BPA: Bisphenol A; COD: Chemical oxygen demand; DMSO: Dimethyl sulfoxide; DTFBR: Draft tube fluidized bed reactor; FBR: Fluidized bed reactor; FBBR: Fluidized-bed bioreactor; HLR: Hydraulic retention time; IFBBR: Inverse fluidized bed bioreactor; IFBR: Inverse fluidized bed reactor; IFAFB: Integrated flocculation-adsorption fluidized bed; LDPE: Low density polyethylene; MO: Methyl orange; OH. : Hydroxyl radicals; OLR: Organic loading rate; OM: Organic matter; PC: Phthalocyanine; PP: Polypropylene; PZC: Point of zero charge; RB: Rhodamine B; RB13: Reactive blue 13; TOC: Total organic carbon; UV: Ultraviolet; VSS: Volatile suspended solids
  • 4. M ANUSCRIPT ACCEPTED ACCEPTED MANUSCRIPT 2 application of fluidized bed reactor in biological wastewater treatment is well established with many1 large-scale plants in existence, its application in advanced oxidation processes is mostly at laboratory-2 scale. For proper design, upscaling and process improvement, information on the major parameters3 affecting the processes is important. This paper offers an overview on the applications of fluidized bed4 reactor in wastewater treatment, with emphasis on the important design and operational parameters5 affecting its performance. The discussion covers liquid-solid and gas-liquid-solid fluidized bed reactors6 and their applications in advanced oxidation processes, biological as well as adsorption processes which7 are effective wastewater treatment technologies. Fluidized bed reactors are excellent contacting devices8 and have the potential to enhance the effectiveness and energy efficiency of these treatment processes if9 properly design and utilized. An energy efficient and cost-effective wastewater treatment technology is10 crucial to industries adopting cleaner production. Important parameters such as reactor geometry, aspect11 ratio, support materials, reactor internal, superficial fluid velocity and other operational parameters are12 reviewed. The review concluded with perspective on future research interests.13 Keywords:14 Fluidized bed reactor; Fluidized bed Fenton; Fluidized bed bioreactor; Wastewater treatment; Advanced15 oxidation processes; Parameters16 1.0. Introduction17 There is consensus that more effective wastewater treatment technologies are needed for the removal18 of recalcitrant pollutants that are increasingly encountered in both domestic and industrial effluents. This19 is largely due to the need for environmental protection on one hand, and the need to have cost-effective20 wastewater treatment technologies on the other. Driven by these reasons, industries have intensified21 efforts to adopt cleaner production using strategies such as zero-discharge (Tabassum et al., 2015),22 process modifications (Zhang and Wang, 2015) and other appropriate methods. Adopting zero-discharge23 through wastewater reuse is attractive (Othaman et al., 2014) as it can lower production cost and ensure24 environmental sustainability. Unfortunately, conventional wastewater treatment technologies are not25
  • 5. M ANUSCRIPT ACCEPTED ACCEPTED MANUSCRIPT 3 effective in degrading recalcitrant pollutants which are hydrophobic and generally of high molecular1 weight (Pouran et al., 2014). Thus, the last few years have seen increased research towards developing2 treatment technologies that can degrade recalcitrant pollutants while meeting the cost-effectiveness3 needed by industries.4 Among the possible technologies for treating recalcitrant wastewater, Advanced oxidation processes5 (AOPs) have received wide attention.. These technologies are based on the generation of powerful6 oxidants through various processes as put forward by Glaze and coworkers (Glaze et al., 1987). The most7 common oxidant is the hydroxyl radical (OH. ), a powerful and non-selective oxidant with a redox8 potential of 2.8 eV that can effectively degrade organic pollutants. Another attractive technology is9 biological treatment which is widely used to treat both domestic and industrial wastewaters. While10 interest on AOPs is due to their effectiveness in degrading recalcitrant pollutants, biological processes are11 considered inexpensive and eco-friendly. In either case, an effective contacting device is essential for12 proper application of the technology.13 Fluidized bed reactor (FBR) has proven to be an effective reactor in the applications of both AOPs14 (Tisa et al., 2014) and biological processes (Zou et al., 2016). Some of the excellent features of FBR15 include low operating cost (Ahmadi et al., 2015), high resistance to system upsets (Brackin et al., 1996),16 high mass transfer rates and uniform mixing (Andalib et al., 2014). Many researchers have investigated17 the applications of FBR in wastewater treatment, particularly AOPs and biological processes. Although18 the application of FBR in AOPs is relatively new, FBR has been extensively used in biological19 wastewater treatment, with many large-scale fluidized bed bioreactors (FBBRs) in existence.20 To derive apposite support for the review, some relevant studies are highlighted here. It is pertinent to21 note that most of the studies on FBR have been on its applications in areas such as combustion,22 gasification, catalytic processes and other more established processes. For example Corella et al., (2007)23 reviewed the application of FBR in biomass gasification, the so called “dual” fluidized bed biomass24 gasifier. Abdelmotalib et al., (2015) reviewed heat transfer in gas-solid fluidized bed combustors,25 discussing the effect of operating parameters on the heat transfer. Similarly, Singh and Kumar, (2016)26
  • 6. M ANUSCRIPT ACCEPTED ACCEPTED MANUSCRIPT 4 reviewed the current status of oxygen-fired fluidized bed combustion. Such literature emphasized gas-1 solid FBR, which is not applicable to wastewater treatment. The earlier studies of FBR applications in2 wastewater treatment were mainly on aerobic oxidation and denitrification. With increased interest in3 anaerobic process, studies on the use of FBR in anaerobic wastewater treatment with concomitant4 methane generation were reported in the early 80s. Heijnen et al., (1989) presented a state of the art5 review on the application of anaerobic FBBRs in wastewater treatment. The review discussed the basic6 concept of anaerobic FBBR, process development and the challenges facing the technology. Studies7 reported around that time were mainly on process performance. Converti et al., (1990) studied the8 performance of FBBR in anaerobic treatment of wine wastewater containing high COD and proposed a9 kinetic model for the process. Similarly, Borja et al., (1995) evaluated the kinetic reaction of an FBBR10 treating slaughterhouse waste with concomitant methane generation. Haribabu and Sivasubramanian,11 (2016) studied the biodegradation of organic pollutant from domestic wastewater using FBBR and12 achieved a COD removal of 96. 7 % under optimum condition. Wang et al., (2016) conducted anaerobic13 digestion of primary sludge (PS) and thickened waste activated (TWAS) using FBBR and reported that14 the system performed better than conventional anaerobic processes. A high-rate autotrophic15 denitrification using FBBR was reported where complete nitrate removal was achieved at a hydraulic16 retention time (HRT) of 10 min (Zou et al., 2016). However, the earlier studies on the application of FBR17 in AOPs were reported in the late 90s (Chou and Huang, 1999).18 Currently, there is growing interest in the applications of FBR in wastewater treatment, particularly in19 AOPs where it has shown potential in addressing some of the drawbacks of Fenton oxidation (Chen et20 al., 2016) and improving the performance of photocatalysis (Shet and Vidya, 2016). Anand et al., (2015)21 investigated the performance of fluidized bed solar photo Fenton oxidation for the treatment of hospital22 wastewater and achieved 98 % COD removal at HRT of 90 min. The process achieved 92 % COD23 removal at 60 min HRT compared with 67 % obtained using conventional solar photo Fenton oxidation.24 Chen et al., (2015) evaluated the effect of different carriers and operating parameters on the degradation25 of flax wastewater by fluidized bed Fenton process. SiO2 was reported to be the most appropriate carrier26
  • 7. M ANUSCRIPT ACCEPTED ACCEPTED MANUSCRIPT 5 while Fe2+ , H2O2 and bed expansion are significant operating parameters. Matira et al., (2015) studied the1 degradation of dimethyl sulfoxide (DMSO) using a fluidized bed Fenton process and achieved 95 %2 DMSO degradation and 34 % TOC removal after 2 h. The process also showed better performance than3 conventional Fenton process. Dong et al., (2014) conducted visible-light photocatalytic degradation of4 methyl orange over spherical activated carbon-supported and Er3+ :YAlO3-doped TiO2 in a fluidized bed5 reactor. The process achieved an optimum color removal of 65 % after 8 h, with a reaction rate constant6 of 22.17mgL-1 h-1 . Mailler et al., (2016) studied the removal of emerging pollutants from wastewater7 treatment plant discharges by micro-grain activated carbon in fluidized bed as tertiary treatment at large8 pilot scale. The obvious advantage of the process was the continuous injection of fresh dose of adsorbent9 and non-requirement of additional separation steps.10 Recent studies have also been directed towards process intensification and energy efficiency through11 process integration. For example, Apollo and Aoyi, (2016) investigated the combined anaerobic digestion12 and photocatalytic treatment of distillery effluent using FBR. Besides the improved performance of the13 combined process, the methane generation could provide the necessary power to drive the ultraviolet14 (UV) lamp. Studies have also been reported on the application of an integrated anaerobic fluidized bed15 membrane bioreactor for wastewater treatment (Kim et al., 2016). The integrated process results in low16 energy consumption and reduces membrane fouling. Li et al., (2014) utilized a fluidized bed membrane17 bioelectrochemical reactor as an energy-efficient wastewater treatment process. Besides achieving more18 than 90 % COD and 80 % suspended solids removals, the overall energy balance of the process was19 theoretically neutral.20 Some reviews have also been presented on FBR applications in wastewater treatment. Burghate and21 Ingole, (2013) presented an overview on FBBR, discussing the basic concepts, advantages and22 applications in both aerobic and anaerobic treatments. Although the review had highlighted the need for23 standardizing the design procedure of FBBR, the discussion on the design parameters was limited. In their24 review for anaerobic biofilm reactors for the treatment of dairy industry wastewater, Karadag et al.,25 (2015) discussed the application of FBBR and highlighted its advantages. Tisa et al., (2014) attempted to26
  • 8. M ANUSCRIPT ACCEPTED ACCEPTED MANUSCRIPT 6 capture the recent applications of FBR in AOPs. However, the review mainly discussed the basic concept1 of FBR-AOPs and their specific applications to different wastewater streams. Thus, a review with focus2 on the major influential parameters of FBR is yet to be presented.3 Despite the wide applications of FBR in wastewater treatment, its designing and operation still pose4 significant challenges. The lack of proper understanding of the influential parameters can lead to5 improper design and poor reactor performance. Therefore, a prerequisite knowledge for FBR design and6 operational parameters is necessary for successful application of the technology. This paper reviews, for7 the first time, the major parameters affecting the performance of FBR in wastewater treatment. The goal8 is to offer an overview of the recent applications of FBR in wastewater treatment and provide insights on9 the major design and operational parameters which are prerequisites for successful design and application10 of the technology.11 Since fluidization technology has wide applications, large volume of literature on various aspects of the12 technology exists. Thus, to keep the review within reasonable proportions, the discussion covers only13 liquid-solid and gas-liquid-solid FBRs and their applications in wastewater treatment. Thus, throughout14 the paper, FBR refers to either liquid-solid or gas-liquid-solid system used for wastewater treatment. The15 review is presented as follows:16 1. The basic concepts of FBR and its applications in wastewater treatment are first discussed17 2. Important parameters related to reactor design and process hydrodynamics are then reviewed18 3. The operational parameters are discussed with emphasis on FBR-Fenton, FBR-Photocatalysis and19 FBBR20 4. Lastly, the review offered a perspective on future research interest21 1.1. Fluidized Bed and Fluidized Bed Reactor (FBR)22 The basic concept of a fluidized bed involves passing a fluid through a static bed of solid particles with a23 superficial velocity enough to suspend the particles and cause them to behave as though they were fluid.24 When the fluid is introduced into the static bed at a low velocity, it simply passes through the voids of the25 solid particles and the bed remains fixed. As the velocity increases, the bed expands until the particles26
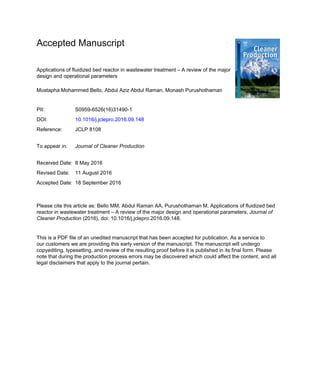
  • 9. M ANUSCRIPT ACCEPTED ACCEPTED MANUSCRIPT 7 become suspended when the buoyancy force balances the drag and gravitational forces. At a particular1 velocity, the minimum fluidization velocity (Umf), the pressure drop across the bed equals the weight of2 the particles and the bed becomes completely suspended (Khan et al., 2014). Fluidization impacts3 excellent features onto the system such as excellent particle mixing, uniform temperature distribution and4 high mass transfer rate (Tisa et al., 2014). Depending on the fluidization velocity, various flow regimes5 such as particulate/smooth fluidization, bubbling fluidization, slugging fluidization, turbulent fluidization,6 and pneumatic conveying regimes can be obtained (Yang, 2003). The principle of fluidization has been7 extensively utilized, particularly in chemical processes where efficient mixing and mass/heat transfer are8 essential.9 FBR is a contacting device that uses the principle of fluidized bed system in its operation. It is similar10 to the commonly used packed bed reactors in many aspects, except that the packing material is expanded11 by the upward or downward movement of the fluid (Burghate and Ingole, 2013). The degree of the bed12 expansion depends on the particle size and density, the up-flow velocity of the fluid and its viscosity.13 FBR involves multiphase flow system (solid-gas, solid-liquid, or solid-liquid-gas) which may include14 momentum exchange, heat exchange and mass transfer. Because of its excellent features , FBR is one of15 the most of important reactor systems use in chemical and biotechnology applications (Si et al., 2011).16 Initially, applications of FBR had been limited to catalytic cracking, combustion, coating, granulation,17 drying and other chemical applications. However, FBR was later deployed for wastewater treatments.18 Fig. 1 shows the basic concept of FBR in wastewater treatment. The wastewater is introduced into the19 bed of the reactor at a particular superficial velocity enough to suspend the support media. The purpose of20 the distributor (spager, if air) is to uniformly distribute the effluent across the reactor bed. Depending on21 the system design, recycling of the effluent is usually employed. The fluidized media can be an22 immobilized catalyst in AOPs or microorganisms in biological treatment.23
  • 10. M ANUSCRIPT ACCEPTED ACCEPTED MANUSCRIPT 8 1 Fig 1. Basic concept of FBR in wastewater treatment application2 1.2. Classifications of FBR for wastewater treatment3 In chemical industries , various types of FBRs such as bubbling fluidized bed, circulating fluidized4 bed, turbulent fluidized bed, floating fluidized bed, twin fluidized bed and many other classifications5 based on flow regime and reactor design are used (Jordening and Buchholz, 1999). However, most of6 these have been developed for specific chemical applications, often involving very high superficial fluid7 velocities typically not needed in wastewater treatment. Thus, this review departs from these8 conventional classifications and discusses FBR in a way that is more applicable to wastewater treatment9 (Fig. 2).10
  • 11. M ANUSCRIPT ACCEPTED ACCEPTED MANUSCRIPT 9 1 Fig. 2 Classification of FBR applicable to wastewater treatment2 1.2.1. Two-phase versus three-phase FBR3 Two-phase FBR involves a liquid-solid or gas-solid process where fluidization is brought about by the4 liquid or gas. In wastewater treatment, however, only liquid-solid system is applicable. The solid phase5 could be a variety of support materials or catalysts while the liquid phase is always the wastewater. The6 three-phase system involves gas-liquid-solid process where aeration or oxygenation is added to a typical7 liquid-solid FBR. In a two-phase FBR, fluidization is provided by the flow of wastewater through the8 catalyst or biomass bed. In a three-phase system, fluidization is provided by the concurrent or9 countercurrent flow of the liquid and gas through the solid bed. The three-phase system was developed to10 improve, inter alia, the oxygen limitation encountered in two-phase FBRs (Choi et al., 2000). However,11 the three-phase system has some challenges such as particle elutriation with high gas flow rate and12 increased agitation which may cause reactor failure. Although two phase systems are simpler in design13 and easier to control, the three-phase systems have seen wider applications (Han et al., 2003).14 1.2.2. Upward-fluidization versus downward/inverse-fluidization in FBR15 FBR can also be classified based on the direction of the fluid flow. Conventional FBR uses solid16 particles that are denser than the fluid phase and fluidization is achieved by the upward fluid flow from17 the bottom of the reactor. However, inverse fluidized bed reactor (IFBR) was later introduced to18 Classification of FBR for wastewater treatment Based on reactant phase 2-Phase FBR 3-Phase FBR Based on direction of fluidization Upflow (conventional) FBR Downflow (inverse) FBR
  • 12. M ANUSCRIPT ACCEPTED ACCEPTED MANUSCRIPT 10 overcome some challenges intrinsic to the conventional FBR, such as un-controlled growth of biomass1 which can affect the bioparticles hydrodynamics (Lakshmi et al., 2000). In IFBR, the density of the solid2 particles is lower than the fluid phase and fluidization is achieved by the downward fluid flow opposite to3 the net buoyancy of the particles (Nikolov et al., 2000). The IFBR is argued to possess superior4 hydrodynamic characteristics than conventional FBR. However, the downside of IFBR is that it usually5 requires higher superficial fluid velocity (Buffiere et al., 1998).6 2.0. Applications of FBR in Wastewater Treatment7 Initially developed for gas generation by Winkler F. in 1920s, FBR has found various applications in8 chemical and biochemical industries such coal gasification, metal refining, catalytic cracking, powder9 technology, food processing and other numerous applications (Tavoulareas, 1991). However, it was only10 in the early 70s that FBR was investigated as a possible reactor for biological wastewater treatment.11 Subsequent years saw a lot of progress, and by 1984, full-scale FBBRs were developed and installed12 (Heijnen et al., 1989). The application of FBR in AOPs is relatively new, with the earliest literature13 appearing in the late 90s. The works of Diz and Novak, (1998) and Chou and Huang, (1999) may have14 been the earliest reported studies on the application of FBR in AOPs.15 FBRs have attracted interest as it has shown more effectiveness in wastewater treatment compared to16 other contacting devices such as fixed-bed column and activated sludge (Burghate and Ingole, 2013).17 Excellent mixing, high mass transfer rates, and low sludge production are some of the features that make18 FBR an attractive technology (Andalib et al., 2014). Since the solid particles are vigorously agitated by19 the fluid passing through the bed, an excellent mixing and little or no temperature gradient is obtained20 (Dora et al., 2013). FBR is commonly used in AOPs, biological treatment and adsorption. Therefore, its21 applications are discussed under these three areas (Fig. 3).22
  • 13. M ANUSCRIPT ACCEPTED ACCEPTED MANUSCRIPT 11 1 Fig. 3. Applications of FBR in wastewater treatment.2 3 2.1. FBR-AOPs4 The concept of AOPs was put forward by Glaze and coworkers as processes of generating reactive OH. 5 radicals with a redox potential of 2.8 eV that are capable of degrading organic pollutants(Glaze et al.,6 1987). The OH. radicals are generated in situ through either one or a combination of chemical oxidations7 by using H2O2 , ozone, and radiation assisted sources such as ultraviolet (Soon and Hameed, 2011).8 Typical AOPs include Fenton and Fenton-like processes, photocatalysis, electrochemical oxidation,9 Ozonation, and ultrasound cavitation. AOPs are very effective in degrading recalcitrant pollutants and10 have many advantages over conventional wastewater treatment methods. Unlike conventional treatments11 which either separate the pollutants from the wastewater stream or convert them to some intermediate12 compounds, AOPs are capable of mineralizing organic pollutants to H2O and CO2 (Ahmadi et al., 2015).13 This made AOPs very attractive, especially in the treatment of recalcitrant and persistent organic14 pollutants that have defied the conventional treatment technologies.15 Since a number of chemical reactions are necessary for the generation of OH. , then the choice of a16 reactor is very important. Because of the excellent features of FBR, many researchers have investigated17 its potential application in AOPs. Combining FBR technology with AOPs can reduce sludge production18 Application of FBR in Wastewater Treatment Advanced Oxidation Processes FBR-Fenton FBR- Photocatlysis Biological Processes FBBR Adsorption FBR- Adsorption
  • 14. M ANUSCRIPT ACCEPTED ACCEPTED MANUSCRIPT 12 (Briones et al., 2012), increase catalyst reusability (Tisa et al., 2014)and improve process performance.1 The most commonly investigated FBR-AOPs are FBR-Fenton and FBR-Photocatalysis.2 2.1.1. FBR-Fenton3 Fenton oxidation is considered one of the most effective AOPs because of its rapid formation of OH. in4 acidic medium (Asghar et al., 2015). The process consists of a homogeneous catalytic reaction between5 ferrous iron (Fe2+ ) and hydrogen peroxide (H2O2) to produce OH. that can oxidized organic pollutants as6 shown in Equations 1 – 3 (Alalm et al., 2015). The decomposition of the pollutants using Fenton process7 occurs in two stages (Lu et al., 1999). The first stage is the rapid reaction of Fe2+ and H2O2 which8 produces large amount of OH. that can rapidly oxide the pollutants. The second stage involves a reaction9 between Fe3+ and H2O2 which produces less OH. and decomposes the pollutant rather less rapidly. This10 stage produces hydroperoxyl radicals, which have lower oxidative power.11 H2O2 + Fe2+ → Fe3+ + OH. + OH- (1)12 OH. + Organic →Products (2)13 OH. + Fe2+ →Fe3+ + OH- (3)14 When Fe2+ and/or Fe3+ are used as the active sites, the process is referred to as homogenous Fenton and15 depends on the chemical interactions between the catalysts. Although the homogeneous Fenton process is16 widely employed because of its effectiveness and ease of operation (Bellotindos et al., 2014), it has17 inherent disadvantages of excessive sludge production (Anotai et al., 2012a) and limited range of18 operational pH (Rodríguez et al., 2016). Thus, heterogeneous Fenton oxidation was developed to19 overcome some of these limitations (Buthiyappan et al., 2016). In heterogeneous Fenton oxidation, the20 reaction occurs between H2O2 and iron ions existing in multiple forms such as [Fe(OH)2]+ [Fe(H2O)]2+ ,21 Fe2O3, α-FeOOH (Soon and Hameed, 2011) or other transition metal-substituted oxides (Pouran et al.,22 2014). In addition to the chemical changes, physical adsorption occurs at the surface of the solid catalyst23 which reduces sludge generation. However, the heterogeneous process is reportedly less effective than24 homogeneous Fenton oxidation due to mass-transfer limitation.25
  • 15. M ANUSCRIPT ACCEPTED ACCEPTED MANUSCRIPT 13 To overcome some of the limitations of Fenton oxidation, researchers have recently explored the1 advantages of FBR as a possible solution. FBR can combine the effectiveness of homogeneous Fenton2 and the sludge reduction of heterogeneous Fenton. The solid materials in the reactor provide surfaces for3 iron crystallization which reduces the sludge generated and increases catalyst reusability (Anotai et al.,4 2009). A possible reaction mechanism that is thought to occur in FBR-Fenton has been proposed by Chou5 and Huang, (1999). Furthermore, because of the excellent features of FBR, the performance of FBR-6 Fenton has been shown to be superior to that of conventional Fenton process (Liu et al., 2014) . Lu and7 coworkers have conducted several works on the application of FBR-Fenton in degrading various8 recalcitrant pollutants such as textile wastewater (Su et al., 2011), dimethyl sulfoxide (Bellotindos et al.,9 2014), acetaminophen (Luna et al., 2013), monoethanolamine (Su et al., 2013)and phenol (Muangthai et10 al., 2010).11 Table 1 summarizes experimental conditions and results from previous studies on FBR-Fenton. The12 reported studies have largely considered synthetic wastewaters under laboratory-scale investigations. The13 FBRs usually consist of a cylindrical glass column with working volumes ranging between 1 to 2 L. The14 support materials commonly used include SiO2, Al2O3, and waste Iron oxide (BT4). Anand et al., (2015)15 studied the performance of a fluidized bed solar Fenton reactor in the removal of COD from hospital16 wastewater. The reactor was a cylindrical vessel of 1.5 L with silica granules as carriers. Maximum COD17 removal of 98 % was obtained at 90 min HRT. The fluidized bed solar Fenton oxidation performed better18 than conventional solar Fenton oxidation.19 Li et al., (2015) studied the oxidation of bisphenol A by Photo-Fenton-like process by a waste iron20 oxide in a three-phase FBR. The system consists of a Pyrex tube with an integrated 15 W UV lamp21 which removed 90 % TOC after 180 min.. The use of waste iron oxide, a by-product of tannery22 wastewater treatment, is attractive as it could increase the cost-effectiveness of the process. The study of23 Bellotindos et al., (2014) considered the degradation of a synthetic pollutant, Dimethyl Sulfoxide24 (DMSO), using FBR-Fenton process with silica as carriers., Up to 98 % DMSO degradation was25 achieved under optimum conditions, with the FBR-Fenton process showing superior performance than26
  • 16. M ANUSCRIPT ACCEPTED ACCEPTED MANUSCRIPT 14 conventional Fenton process. Similarly, Cheng et al., (2014) studied the degradation of Phthalocyanine1 (PC) dyes by photo-assisted Fenton process in an up-flow FBR . The system consists of a 1.45 L fiber2 glass plastic surrounded by 6 UV germicidal lamp and achieved 95 % PC degradation.3 However, Liu et al., (2014) investigated the treatment of real wastewater using FBR-Fenton.4 Recalcitrant silicone wastewater was treated using a 3.92 L reactor with different carrier materials. The5 process achieved 95 % COD and 85 % TOC removals at HRT of 60 min. Compared to the traditional6 Fenton process, the COD and TOC removal rates were found to increase by 20% and 15% respectively.7 Other reported studies are quite similar to the discussed literature. Although most of the studies have been8 on lab-scale, it can be seen that combining FBR with Fenton process enhances process performance, with9 the potential to overcome some of the drawbacks of conventional Fenton oxidation.10 Table 111 Applications of FBR-Fenton in wastewater treatment12 Target pollutants Reactor and Support Material Properties Operational Conditions Performance Reference DMSO Hospital wastewater: COD H: 140 cm D: 5.2 cm Solid: silica Dp: 0.42-0.5 mm PL: 68.97 g/L V: 1.5 L D: 0.053 mm H: 1330 mm Solid: Silica Dp: 0.42-0.59 mm PL: 40g/L pH: 3 Fe2+ : 5 mM H2O2: 32.5 mM HRT: 240 min pH: 3 Fe2+ : 5 mM H2O2: 50 mM HRT: 90 min Q: :12 L/min DMSO: 95.22 % COD: 34.38 % COD: 98 % (Chen et al., 2016) (Anand et al., 2015) Orange G Coaxial cylinder V: 1.5 L D: 35 mm, H: 300 mm Solid: iron oxide (BT4) Dp: 0.42-0.59 mm PL: 6 g/L pH: 3 T: 25 o C H2O2: 25 mg/L UV: 15 W, 365 nm TOC: 78.9 % Color: 92 % (Wang et al., 2015) BPA Cylindrical V: 1.5 L Solid: Iron oxide (BT4) pH: 3 H2O2: 0.7 mmol/L HRT: 180 min UV: 15 W, 365 nm TOC: 90 % (Li et al., 2015) DMSO Cylindrical glass V: 1.3 L D: 5.23 cm, H: 133 cm, Solid: SiO2 pH: 3 Fe2+ : 5 mM H2O2: 60 mM HRT: 2 h DMSO: 98 % (Bellotindo s et al., 2014)
  • 17. M ANUSCRIPT ACCEPTED ACCEPTED MANUSCRIPT 15 Phthalocyanine (PC) Cylindrical Fiber glass H: 400 mm D: 25 mm Solid: Fe (II)/γ-Al2O2, PL: 60 g/L pH: 2 – 4 UV light: 254 nm PC: 95 % (Cheng et al., 2014) Organic silicone wastewater Cylindrical Plexiglass V: 3.92 L D: 8 cm H: 78 cm Solid: quartz / brick/GAC Dp: 0.5 – 0.8 mm Carrier filling rate: 35 % pH: 3.5 HRT: 60 min H2O2/ Fe2+ 13.6:1 Q: 3 mL/h COD: 95 % TOC: 85 % (Liu et al., 2014) Acetaminophen (ACT) Cylindrical glass reactor V: 1.45 L Solid: SiO2 & glass beads Dp: 0.5 mm, 2 & 4 mm pH: 3 Fe2+ : 0.05 – 0.1 mM H2O2: 5 – 25 mM ACT: 99.6 % (Luna et al., 2013) 2,2,3,3-tetrafluoro-1- propanol (TFP) Cylindrical glass V: 1.5 L D: 7.5 cm H: 50 cm Solid: BT5 iron oxide DP: 0.25 – 0.5 mm H2O2: 10 mM UV: 254 nm lamp TFP: 99.65 % Fluoride: 99 % (Shih et al., 2013) MEA and phosphate Cylindrical vessel V: 1.45 L Solid: SiO2 Dp: 0.24 – 0.5 mm PL: 100 g/L 50 % bed expansion pH: 3 H2O2: 50 mM MEA/Fe2+ : 3 mM MEA: 76 % Phosphate: 45 % (Su et al., 2013) TFT-LCD wastewater: MEA Cylindrical glass V: 1.45 L Solid: SiO2 DP: 0.42 – 0.5 mm PL:: 100 g pH: 3 Fe2+ : 3 mM H2O2: 50 mM MEA 98.9 % COD: 64.7 % Iron: 67.4 % (Anotai et al., 2012a) O-toluidine Cylindrical glass V: 1.35 L D:5.23 cm H:133 cm Solid: SiO2 carriers DP: 0.42 – 0.59 mm PL: 50 – 300 g pH: 2 – 4 Fe2+ : 0.1 – 1.0 mM H2O2: 1 – 17 mM O-toluidine: 64.2 % COD: 36.7 % Iron: 100 % (Anotai et al., 2012b) Pharmaceutical wastewater: acetaminophen (ACT) Cylindrical glass V: 1.45 L Solid: SiO2 carriers Dp: 0.5 mm PL: 100 g/L pH: 3.22 Fe2+ : 1 – 5 mM H2O2: 100 mM ACT 97.8 % (Briones et al., 2012) Dyes: RB5, RO16, RB2 Cylindrical glass V: 1.35 L D: 5.23 cm H: 133 cm Solid: SiO2 and Al2O3 PL: 74.07 g/L 50 % bed expansion pH: 3.22 Fe2+ : 0.06 mM H2O2: 19.87 mM RB 5 and RO16: 99 % RB2: 96 % COD: 34 – 49 % (Su et al., 2011) Textile wastewater Cylindrical glass V: 1.35 L pH: 2 – 5 [COD]: [Fe2 ]: COD: 86.7 % Color: 97.9 % (Su et al., 2011)
  • 18. M ANUSCRIPT ACCEPTED ACCEPTED MANUSCRIPT 16 D: 5.23 cm H: 133 cm Solid: SiO2 PL: 74.07 g/L 50 % bed expansion [H2O2] =1:0.95:7.94 Aniline Cylindrical glass V: 1.35 L D: 5.2 cm H: 133 cm Solid: SiO2 carriers DP: 0.42 – 0.84 mm Solids: glass beads 2 & 4 mm pH: 3 Fe2+ : 0.00107 mM H2O2: 58 mM HRT: 60 min Aniline: 96 % (Anotai et al., 2010) 2, 6, Dimethylaniline Cylindrical glass V: 1.35L Solid: Al2O3 carriers DP: 2.5 mm pH: 3 H2O2: 2.5 mM Fe2+ :10 mM Complete degradation after 10 min (Ratanatam skul et al., 2010) 2,4-dichlorophenol Cylindrical glass V: 1.35 L Solid: silica carriers DP: 0.84-2.00 mm PL: 100 g/L pH: 3 H2O2: 10 mM Fe2+ :0.25 mM 2,4-DCP: 99 % COD: 55 % Iron: 14 % (Muangthai et al., 2010) Nitrobenzene and Iron removal Cylindrical glass V: 1.35 L Solid: Al2O3 carriers DP: 0.8 -2.0 mm pH: 2.8±0.2 H2O2: 50 mM Fe2+ : 5 mM Nitrobenzene: 90 % Iron: 30 – 65 % (Anotai et al., 2009) Phenol Cylindrical Pyrex tube V: 150 m L D: 2.0 cm Solid: SiO2-immobilized iron oxide DP: 0.89 mm pH: 2.8±0.2 H2O2: 500 mg/L T: 30 o C Q: 1.5 L/min TOC: 98 % (Huang and Huang, 2009) Benzoic Acid (BA) D: 2 cm H: 100 cm Solid: γ-FeOOH carriers DP: 0.564 mm Density: 1.11 g/cm3 PL: 80 g 50 % bed expansion pH: 2.85 – 3.74 Ul: 0.011 m/s BA: 95 % Iron: 90 % TOC: 59 % (Chou and Huang, 1999) V: Reactor volume; D: reactor diameter; H: reactor height; DP: diameter of support media: BH: Initial static bed1 height; Q: liquid flow rate; Qa: air flow rate: HRT: Hydraulic Retention Time; T: Temperature; Umf: Minimum2 superficial velocity; UL: superficial Liquid velocity; Ug: superficial gas velocity; PL: Solid particle loading; BPA:3 Bisphenol A; DMSO: Dimethyl Sulfoxide; TFT-LCD: Thin film transistor liquid crystal display; MEA:4 Monoethanolamine5 6 7 2.1.2. FBR-Photocatalysis8 Photocatalytic oxidation is another AOPs where the application of FBR has attracted recent interests.9 In Photocatalysis, a semiconductor metal oxide is used as a photocatalyst to oxide organic pollutants to10 carbon dioxide and water (Rosa et al., 2015). The process involves illuminating metal oxide in aqueous11
  • 19. M ANUSCRIPT ACCEPTED ACCEPTED MANUSCRIPT 17 suspension with irradiation having a photon energy (hv) equal to or greater than the band gap energy of1 the metal. This generates valence band holes and conduction band electrons which can react with water2 and the hydroxyl ion to generate OH. (Pelaez et al., 2010). Two broad light spectrum, UV (200 – 400 nm)3 and visible light (400 – 700 nm), are commonly used to generate the light photon (Cheng et al., 2016).4 Although metal oxides such ZnO, NiO, ZnS, Fe2O3 can be used, TiO2 is the most widely used5 photocatalyst due to its strong photoctivity, high stability, non-toxicity and commercial availability6 (Ananpattarachai and Kajitvichyanukul, 2015). Once the surface of the TiO2 is photo-activated, OH. will7 be generated and subsequently oxidized organic pollutants (Chong et al., 2015). Details of the8 fundamentals of photocatalysis have been well documented (Meng et al., 2010).9 Although powder photocatalyst has large specific surface area which enhances mass transfer during10 wastewater treatment, it is necessary to have a downstream separation stage which increases the cost of11 treatment (Pozzo et al., 2000). To overcome this, the powder is usually impregnated onto the surface of12 other compounds such as Al2O3, SiO2 or perlite which have larger surface areas. This solves some of the13 challenges of using powder catalyst, including the need for downstream separation and possible particles14 elutriation. Because of the excellent features of FBR, researchers have investigated its application in15 photocatalytic oxidation. It is believed that besides its excellent mixing and high mass transfer, FBR can16 also enhance light penetration and exposure of the interior of the reaction matrix (Nam et al., 2002).17 Table 2 gives a summary of reported studies on FBR-Photocatalysis which have largely been on18 laboratory-scale using synthetic wastewaters. The FBRs used are mostly three-phase systems where air is19 supplied to increase the rate of the photocatalytic degradation. Most of the studies have reported an20 improvement in process performance with the application of FBR. This is largely due to the improved21 light penetration and possible adsorption of pollutants onto the support materials.22 Dong et al., (2014) studied the visible-light photocatalytic degradation of Methyl Orange (MO) over23 AC-supported and Er3+ :YAlO3-doped TiO2 using FBR. Maximum decolorisation of 65.3 % was achieved24 after 8 h . The performance of the system was found to be higher under the UV irradiation. Similarly, Shet25 and Shetty, (2016) compared the performance of a photocatalytic fluidized bed degradation of phenol26
  • 20. M ANUSCRIPT ACCEPTED ACCEPTED MANUSCRIPT 18 using Ag@TiO2 under UV and solar irradiations. Around 76 % degradation was achieved using UV while1 only 40 % was achieved under solar irradiation. The high band of TiO2 is known to prevent it from2 utilizing visible irradiation and hence its lower performance compared to UV irradiation.3 Mungmart et al., (2011) investigated the degradation of phenol in a three-phase FBR using different4 metal oxides. The performances of reactors utilizing O3, TiO2 deposited on silica beads, metal catalyst (Ni5 or Co) impregnated on mesoporous carbon beads, or O3 in combination with each catalyst were6 compared. It was found that the reactor with Co impregnated on mesoporous carbon beads gave the7 highest phenol removal while the reactor with only Ozone gave the lowest phenol removal. The carbon8 beads provided adsorption sites for the phenol, thereby increasing the removal rate. Kanki et al., (2005)9 studied the degradation of phenol and bisphenol A in a fluidized bed photocatalytic reactor using TiO2-10 coated ceramic particles. Two FBRs, one with an internal UV lamp (254 nm, 9 W) and the other with an11 outside black lamp (365 nm, 15 W) were compared. The reactor with the internal UV lamp degraded the12 pollutant 4 times faster than the other reactor. Clearly, the intensity and location of the lamp have an13 effect on the reactor performance.14 15 16 17 18 Table 219 Applications of FBR-Photocatalysis in wastewater treatment20 Target pollutant Rector and support material properties Operational Conditions Performance Reference Phenol Cylindrical column H: 52 cm D: 1.6 cm Catalyst: Ag/TiO2 Loading: 0.25 – 0.75 g Solid: Glass beads pH: 3 HRT 420 min Q: 140 mL/min Qa: 1.5 L/min UV lamps:18 W Phenol: 84 % (Shet and Vidya, 2016) MO Annulus reactor D: 60 mm H: 1 mm Support: Glass beads BH: 33 mm LED: 36 W, 455 – 533 nm T: 20 o C MO: 65.3% (Dong et al., 2014)
  • 21. M ANUSCRIPT ACCEPTED ACCEPTED MANUSCRIPT 19 Phenol Cylindrical quartz tube V: 235 ml D:31.6 mm H: 300 mm Catalyst: TiO2/Co/Ni Loading: 2.5 – 20 g Qa: 1 L/min HRT: 10 min UV: 15-W, 254 nm Phenol: 100 % (Mungmart et al., 2011) Phenol Quartz glass column H: 600 mm D: 60 mm Catalyst: TiO2 Support: quartz sand pH: 7 T: 30 o C loading: 0.33 g/L UV: 20 W, 254 nm Phenol: 99 % (Zulfakar et al., 2011) Sodium lauryl sulfate(SLS) Stainless steel reactor with draft tube V: 7 L D: 0.1 m H: 1.0 m Catalyst: immobilized TiO2 Particle size: 130 µm loading: 2.448 g/L Support: SiO2 Qa: 0.2 cm/s 30 W UV-A (365 nm) Black Light Blue Lamp 65 W UV-C (254 nm) Germicidal Lamp SLS: 100 % (Nam et al., 2009) Congo Red (CR) Stainless steel column with conical bottom catalyst: Titania/Kaolinite loading: 6 g/dm3 pH: 7 Qa: 0.5 dm3 /min 11 W UV light (256 nm) COD: 80 % Decolorisation: 95.5 % (Chong et al., 2009) Acid dye Acrylic cylindrical column H: 210 mm D: 90 mm Catalyst: ZnFe2/TiO2-GAC Loading: 20 – 40 g Q: 3 L/min HRT: 4 h visible light lamp (150 W) Acid dye: 60 % (Wang et al., 2009) Phenol and Bisphenol A Rectangular column V: 4 dm3 H: 20 cm UV lamps (9 W, 254 nm) Catalyst: Immobilized TiO2 Dp: 0.7 mm Air-flow rate: 0.5 dm3 HRT: 200 min Phenol/BPA: 100 % (Kanki et al., 2005) Rhodamine B Rectangular acrylic vessel V: 2.8 H: 250 mm Catalyst: TiO2 Loading: 33.8 g/ Qa: 7.0 L/min 8-W Germicidal lamps RB: 100 % (Na et al., 2005) Microcystin-LR (MLR) Cylindrical column D: 68 cm H: 65 cm Solid carrier: TiO2-coated GAC BH: 2.5 cm Q: 150 – 200 cm3 /s UV: 4 W, 370 nm T: 20 o C MLR: 95 % (Lee et al., 2004) Rhodamine B V: 24 L Solid carrier: TiO2-coated ceramic DP: 1.5 mm Loading: 25 g/L Qa: 1 L/min UV: 20 W HRT: 180 min 87 % degradation (Na et al., 2004)
  • 22. M ANUSCRIPT ACCEPTED ACCEPTED MANUSCRIPT 20 Dyes: Crystal violet & Azure B Cylindrical glass vessel D: 45 mm H: 250 mm Solid carrier: ZnO immobilized in alginate gel beads DP: 2.5 – 3.0 mm Loading: 20 g Qa: 2 L/min UV: 125 W, 650 nm T: 25 o C Decolorisation: 77-100 % TOC: 52-90 % (Couto et al., 2002) TCE Annular quartz glass tube reactor D: 55 mm H: 600 mm Catalyst: immobilized TiO2 Support: Silica gel DP: 220-417 µm HRT: 10 min Ug: 5.1 cm/s 6 white lamps (8 W, 365 nm) 6 Germicidal lamps (8 W 254 nm) TCE: 80 % (Lim and Kim, 2002) MO Acrylic pipe with draft tube V: 2.5 L D: 10 cm H: 45 cm Catalyst: Degussa P-25 Particle size: 21 nm Loading: 0.2 g/L pH: 3 15 W UV-lamp Qa: 1.5 L/min MO: 100 % (Nam et al., 2002) V: Reactor volume; D: reactor diameter; H: reactor height; DP: diameter of support media: BH: Initial static bed1 height; Q: liquid flow rate; Qa: air flow rate: HRT: Hydraulic Retention Time; T: Temperature; Umf: Minimum2 superficial velocity; UL: Liquid superficial velocity; Ug: Gas superficial velocity; MO: Methyl Orange; TCE:3 Trichloroethylene;4 2.2. Fluidized Bed Bioreactor (FBBR)5 FBBR has been widely used for aerobic and anaerobic wastewater treatments. The system consists of6 microorganisms-coated particles in wastewater which is sufficiently fluidized to keep the phases7 thoroughly mixed (Vinod and Reddy, 2005). The support materials of FBBR normally have extremely8 large specific surfaces and achieve treatment levels in shorter time than conventional biological treatment9 processes (Alfredo et al., 2013). This is because the fluidization maximizes surface contact between10 microorganisms and the pollutants. It has been argued that FBBR offers the stability and ease of operation11 of a trickling filter and the high efficiency of activated sludge process (Burghate and Ingole, 2013). For12 example, it was reported that FBBR operated at lower HRT and gave better performance than a stirred13 tank reactor in the degradation of phenol (Gonzalez et al., 2001). Fluidization provides a favorable gas-14 liquid mass transfer, which promotes good pollutant-biomass contact and suitable oxygen transfer rate15 (Pen and Jose, 2008). Obviously fluidization will do away with preferential flow paths, bed clogging and16 other problems encountered in fixed-bed reactors (Jaafari et al., 2014).17
  • 23. M ANUSCRIPT ACCEPTED ACCEPTED MANUSCRIPT 21 Although FBBR is a well-established technology with full-scale plants in existence, lab-scale studies1 are still being conducted towards process improvement, application of new materials and integration with2 other technologies. For example, Logan and coworkers have recently combined FBBR with membrane3 bioreactor as a possible solution to membrane fouling (Kim et al., 2011, 2016). Improved treatment4 efficiency, stable mixed liquor suspended solid and reduced transmembrane pressure are obtained when5 FBBR is combined with membrane bioreactor (Shin et al., 2014).6 Table 3 gives a summary of some reported studies on wastewater treatment using FBBR. Both two7 phase and three-phase processes have been used, with some researchers exploring the advantages of an8 inverse fluidized bed bioreactor (IFBBR). Haribabu and Sivasubramanian, (2016) studied the9 biodegradation of organic matter in domestic wastewater using IFBBR and achieved a maximum COD10 removal of 96.7 %. A three-phase FBR with a working volume of 0.0125 m3 and employing low density11 biocarries was used. The low density media had a positive effect on the minimum fluidization velocity12 and increased the efficiency of the process.13 Lin et al., (2010) investigated the biodegradation of RB13 in a two-stage anaerobic/aerobic FBBR and14 achieved color and COD removal efficiencies of 86.9% and 90.4% respectively. Rajasimman and15 Karthikeyan, (2007) investigated the effect of HRT on the aerobic digestion of starch wastewater using16 FBBR with low density biomass support. The COD removal increased with increase in HRT for all initial17 substrate concentration, with maximum removal (95.6 %)at 40 h HRT.18 Cuenca et al., (2006) studied the anaerobic biodegradation of diesel fuel-contaminated wastewater19 using FBBR and reported that both diesel and COD removal efficiencies increased with increased in HRT20 for all the conditions investigated. Mustafa et al., (2014) studied the treatment of municipal wastewater21 sludge using anaerobic FBBR and reported that the treatment performance decreased with increased in22 organic loading rate (OLR). A volatile suspended solids (VSS) removal efficiencies of 88 %, 79 % and 7023 % were achieved at OLRs of 4.2, 9.5 and 19 kg COD/m3 -d respectively. A COD removal efficiency of 6824 % was obtained at OLR of 19 kg COD/m3 -d. Borja et al., (2004) carried out mesophilic anaerobic25
  • 24. M ANUSCRIPT ACCEPTED ACCEPTED MANUSCRIPT 22 digestion of wastewater from the production of protein isolates from chickpea flour using FBBR and1 reported that the percentage COD removal decreased with increase in OLR.2 Table 33 Applications of FBBR in wastewater treatment4 Target pollutant Reactor and support material properties Operational Conditions Removal Reference PS/ TWAS Plexiglass rectangular column V: 16 L H: 3.6 m Support: HDPE DP: 600–850 µm Density: 1554 kg/m3 T: 37 o C HRT: 2.2 – 4 d OLR: 12 -18kg COD/m3 d (Wang et al., 2016) Domestic wastewater V: 0.0125 m3 D: 0.1 m H: 1.8 m Support: LDPE Density: 870 kg/m3 BH: 0.6 – 1.0 m HRT: 6.25 – 24 h Q: 10 – 80 mL/min Ug:0.0016 - 0.00318 m/s COD: 96.7 % (Haribabu and Sivasubraman ian, 2016) Autotrophic denitrification Glass column V: 580 ml Support media: GAC DP: 0.5 -1 mm pH: 5.8 T: 20 – 30 o C Q: 800 mL/min, HRT: 10 min OLR: 500 mg/L h Bed expansion: 25 % N: 100 % (Zou et al., 2016) Aquaculture Effluent: Nitrate removal V: 2.85 L D: 0.31 m H: 3.9 m BH: 0.9 m Support: Sulfur biofilters, DP: 0.3 mm Phase I: HRT: 3.2-3.3 min, Flowrate: 63-65 L/min Phase II: HRT: 3.2-4.8 min Flowrate: 67-43 L/min 13 – 42% bed expansion N: 49 % (Christianson et al., 2015) Aquaculture effluent: denitrification V: 285 L D: 0.31 m H: 3.9 m Support: sand biofilters DP: 0.11 mm BH: 0.9 m HLR: 188 L/min m2 HRT: 15 min Q: 13.7 L/min 50 % bed expansion N: 26.9 % (Tsukuda et al., 2015) Denitrification of mining water V: 1 L Support: GAC Dp: 0.5 – 1 mm T: 7 – 22 o C HRT: 12 h Q: 800 mL/min 25 % bed expansion Denitrification: 100 % (Zou et al., 2015) Cu, Ni & Zn removal V: 2.5 L D: 0.08 m H: 1.0 m HRT: 24 h pH: 7 & 5 OLR: 1 g COD/L. d 30 % bed expansion Cu: 97.5 % Ni: 65.9 % Zn: 97.0 % COD: 61.9 % (Janyasuthiw ong et al., 2015)
  • 25. M ANUSCRIPT ACCEPTED ACCEPTED MANUSCRIPT 23 Synthetic municipal wastewater: denitrification Plexiglass column V: 608 ml D: 2.54 cm H: 100 cm Support: zeolite DP: 600 – 850 µm T: 20 ± 3 o C HRT: 0.6 h OLR: 5.9 – 7 kg COD/m3 d Q: 20 ± 2 L/day N2O: 0.53 % (Eldyasti et al., 2014) Currant wastewater: COD Plexiglass column V: 3.95 L D: 60 mm H: 140 cm BH: 0.6 m Support: PVC DP: 2 mm T: 35 ± 2 o C OLR: 9.4 to 24.2 kg COD/m3 Umf: 0.75 m/min 30 % bed expansion COD: 96. 9 % (Jaafari et al., 2014) Domestic wastewater Plexiglass plate V:7.6 L, Support : GAC Loading: 200 – 300 g T: 15 - 35 o C HRT: 6 h COD: 74.0 ± 3.7% (Gao et al., 2014) Formaldehyde Pillar glass reactor V: 486 mL D: 3.6 cm H: 46 cm Support: Gel beads HRT: 24 h T: 30 & 37 o C Degradation: 98. 37 % at 30 o C Degradation: 96.83 % at 37 o C (Qiu et al., 2014) Metal precipitation (Cu, Pb, Cd, Zn) PVC pipe with conical bottom V:2.5 L D: 0.05 m H: 1.0 m Support: LDPE beads DP: 3 mm T: 25 o C HRT: 24 h 30 % bed expansion Removal: 99 % (Villa-Gomez et al., 2014) PS & TWAS V: 16 L H: 3.6 m Support media: zeolite carries DP: 425 – 610 µm OLR: 8 – 19 kg/m3 -d Q: 3.4 L/d COD: 68 % for PS COD: 55 % for TWAS (Mustafa et al., 2014) Petrochemical wastewater: COD and TPH Glass column with draft tube V: 4.36 L T: 20 – 25 o C HRT: 6 h Qa: 2-5 L/h, OLR:1.61-2.56 kg COD/m3 .d COD: 87 % TPH: 95 % (Qin et al., 2014) Thin stillage H: 3.6 m Support: Zeolite DP: 425 – 610 µm T: 37 o C, UL: 1.4 cm/s OLR: 29 ±1.2 kg COD/m3 d COD: 88 % TSS: 78 % (Andalib et al., 2012) Dyeing Effluent: color and COD V: 0.02 m2 D: 0.15 m H: 1.17 m BH: 0.25 m Support media: PVC Qa: 0.025 m/s HRT: 26 h 50 % bed expansion COD: 83.3 % Color: 89.5 % (Balaji and Poongothai, 2012) Sulfide oxidation Glass column V: 0.6 L D: 0.045 m H: 0.38 m Support: nylon DP: 2-3 mm T: 30 ± 2 o C HRT: 25 – 70 min Uup: 14 – 20 m/h Degradation: 92 % (Midha et al., 2012)
  • 26. M ANUSCRIPT ACCEPTED ACCEPTED MANUSCRIPT 24 Density: 1140 kg/m3 BH: 16 cm Real acid drainage mine water V: 300 mL Support media: AC DP: 0.5 – 1 mm T: 35 o C HRT: 12 – 24 h pH: 2.7 – 7 15 – 20 % bed expansion Sulfate: 90 % COD: 80 % Metal: 99.9 % (Sahinkaya et al., 2011) V: Reactor volume; D: reactor diameter; H: reactor height; DP: diameter of support media: BH: Initial static bed1 height; Q: liquid flow rate; Qa: air flow rate: HRT: Hydraulic Retention Time; T: Temperature; Umf: Minimum2 superficial velocity; UL: Liquid superficial velocity; Ug: Gas superficial velocity; OLR: Organic Loading Rate;3 IFBBR: Inverse Fluidized Bed Bioreactor; IAFMBR: Inverse Anaerobic Fluidized Bed Bioreactor; GAC: Granular4 Activated Carbon; HDPE: High Density Polypropylene; LDPE: Low Density Polypropylene; TPH: Total Petroleum5 Hydrocarbon; PS: Primary Sludge: TWAS: Thickened Waste Activated Sludge6 7 2.3. FBR-Adsorption8 Adsorption is an effective and economical method for the removal of recalcitrant pollutants from9 wastewater, especially when low-cost adsorbent such as grape bagasse (Demiral and Güngör, 2016) and10 cow bone (Cechinel et al., 2014) are utilized. Although treatability studies on adsorption are usually11 conducted in batch (Abidi et al., 2015) or fixed-bed column rectors (Bello et al., 2013), studies have also12 been reported on the use of FBR for adsorption process. When FBR is used in adsorption, operational13 problems encountered in fixed-bed column adsorption such as clogging, temperature gradient, channeling14 and dead zones are eliminated. Table 4 shows reported studies on adsorption using FBR.15 Dora et al., (2013) investigated the adsorption of Arsenic (III) using cashew nut shell in a three-phase16 FBR and reported a removal efficiency of 92.55 % under optimum condition. The adsorption was found17 to be affected by the gas and liquid velocities, particle size and initial static bed height. Kulkarni et al.,18 (2013) studied the adsorption of phenol from wastewater in an FBR using coconut shell activated carbon.19 The adsorption was found to depend on the initial phenol concentration, flowrate and bed particle size.20 Jovanovic et al., (2014) studied the hydrodynamics and sorption studies for the removal of Cu (II) from21 aqueous solution using FBR packed with Zeolite A beads. The process was optimized, with a maximum22 sorption capacity of 23.3 mg/g.23 Zhou et al., (2015) developed an integrated flocculation-adsorption fluidized bed (IFAFB) system for24 the removal of Kaolin clay and phenol from synthetic wastewater. The adsorption capacities of the25 fluidized regime were found to be 8.77 and 24.70 mg/g greater than those of the fixed bed regime. At26
  • 27. M ANUSCRIPT ACCEPTED ACCEPTED MANUSCRIPT 25 shorter HRT (below 50 min), however, the adsorption was higher in the fixed bed regime. At longer times1 and higher superficial velocities, the adsorption performance of the FBR was superior. Under fluidization,2 the solution forms micro-vortices and create a uniform condition around the adsorbent, resulting in3 effective utilization of the adsorbent. Under fixed bed mode, however, there are discrepancies between4 the two sides of the particle. In a similar study, Wang et al., (2011) reported that the adsorption capacity5 of fixed bed was higher than that of an inverse fluidized bed in their study for aqueous phase adsorption6 of toluene using hydrophobic aerogels. The breakthrough time was found to be shorter in the inverse FBR7 than packed bed. This is perhaps because of the short HRT (50 min) where the packed bed normally8 exhibits a better performance. The use of the inverse FBR might have equally contributed to the lower9 performance of the process.10 Table 411 Applications of FBR-Adsorption in wastewater treatment12 Target pollutant Reactor and support material properties Operational conditions Performance Referenc e Emerging micro- pollutants V: 20 m3 H: 5 m Adsorbent: GAC DP: 100 – 800 µm BH: 1.5 – 2.5 m HRT: 10 – 20 min Q: 1400 m3 /d PPHs: 80 % COD: 40 – 45 % OM: 30 – 35 % (Mailler et al., 2016) Kaolin clay and Phenol Cylindrical Plexiglas D: 30 mm H: 570 mm Adsorbent: SiO2/CAC DP: 0.6 – 1.5 mm BH: 35 mm Ul: 4 – 8 mm/s HRT: 7 s Kaolin: 95 % Phenol: 80 % (Zhou et al., 2015) Cu Polycarbonate column D: 2.4 cm H:16.7 cm Adsorbent: Zeolite A DP: 0.71 – 2.2 mm Loading: 10.5 - 12.5 g BH: 4.3 - 10.2 cm HRT: 1.4 - 4.0 s Q: 11.6 - 13.5 cm3 /s Ul: 2.6 - 3.0 cm/s adsorptive capacity 23.3 mg/g (Jovanov ic et al., 2014) Arsenic Perplex column D: 5 cm H: 150 cm Adsorbent: Cashew nut shell DP: 1.1005 – 1.5405 mm BH: 0.06 – 0.14 m Ug: 5 – 20 m/s UL: 0.01 – 0.07 m/s Arsenic: 93 % (Dora et al., 2013)
  • 28. M ANUSCRIPT ACCEPTED ACCEPTED MANUSCRIPT 26 Toluene PVC column D: 0.076 m H: 1.47 m Adsorbent: SiO2 DP: 0.7 – 1.2 mm Loading: 50 – 200 g HRT: 6.25 – 24 h Ug: 0.0016 - 0.00318 m/s Q: 0.86 – 5.99 L/min 4 % of the adsorbent weight (Wang et al., 2011) Congo red phosphate and nitrate Conical bottom polyplastic Adsorbent: formulated clay- lime Loading: 0.4 – 1.0 g/L Qa: 1 L/min Congo red: 99 % Phosphate: 99 % Nitrate: 45 % (Vimons es et al., 2010) Phenol Cylindrical perplex column V: 70 L D: 0.2199 m H: 1.82 m Adsorbent: PAC Loading: 2 g/L pH: 3.5 Ug: 0.0219 m/s Phenol 95 % (Mohant y et al., 2008) Copper D: 3 cm H: 120 cm Adsorbent: clarifier sludge DP: 0.5 mm pH: 4 HRT: 60 min T: 25 o C UL: 0.0028 m/s Copper: 90 % (Lee et al., 2006) Copper D: 3 cm H: 120 cm Adsorbent: Manganese- coated sand DP: 1.0 ± 0.1 mm pH: 2 – 8 HRT: 60 min T: 25 o C UL: 0.0028 m/s Copper: 99 % (Lee et al., 2004) Phenol Jacket glass column D: 20 mm Adsorbent: GAC DP: 0.937, 1.524 mm Density: 2100 kg/m3 Loading: 12-24 g T: 21 – 24 o C Q: 0.15–0.35 dm3 /min Umf: 0.0085 m/s Phenol: 62 % (Wang and Chang, 1999) V: Reactor volume; D: reactor diameter; H: reactor height; DP: diameter of support media: BH: Initial static bed1 height; Q: liquid flow rate; Qa: air flow rate; HRT: Hydraulic Retention Time; T: Temperature; Umf: Minimum2 fluidization velocity; UL: Liquid superficial velocity; Ug: Gas superficial velocity; CAC: Coconut activated carbon;3 IFAFBR: Integrated Flocculation-Adsorption Fluidized Bed Reactor; IFBR: Inverse Fluidized Bed Reactor; GAC:4 Granular Activated Carbon; OM: Organic matter: PAC: Powder Activated Carbon5 3.0. Effect of Design parameters6 Successful application of FBR requires knowledge of the important design parameters. However,7 despite the extensive applications of FBR, fluidization is still an empirical science (Yang, 2003) and a8 single systematic design approach is yet to emerge. Instead, the design is largely application-specific and9 relies on empirical correlations (Onysko et al., 2002) and experience of the designer (Zhang et al., 2012).10 For example, recently, Deng et al., (2016) developed an integrated methodology for designing FBBR for11 the treatment of dyeing effluents. The method was based on theories, experiments and knowledge base.12 The absence of a robust methodology and the reliance on heuristic may lead to various problems such as13 insufficient or over-fluidization, poor treatment performance and reactor failure. Although attempts have14
  • 29. M ANUSCRIPT ACCEPTED ACCEPTED MANUSCRIPT 27 been made to understand the design parameters, large-scale applications of FBR still pose significant1 challenge (Reinhold et al., 1996).2 Despite the wide applications of FBR in wastewater treatment, the effect of design parameters is not3 fully established. Also information on the effects of reactor configuration on the mass transfer and the4 reactor performance are somewhat sparse. Some of the design parameters that may affect the performance5 of FBR include reactor geometry, aspect ratio, reactor internals, particle size and density, particle loading6 and fluid superficial velocity.7 3.1. Reactor Geometry8 3.1.1. Shape and cross-sectional area of the reactor9 Reactor configuration is an important parameter that affects mixing and particle distribution in FBR10 (Choi and Shin, 1999). Particle mixing plays an important role in the performance of FBR since it affects11 both heat and mass transfer (Yan et al., 2009). For wastewater treatment, it is necessary to obtain high12 mass transfer rate and uniform temperature in the reactor through fluid-particle interactions.13 Although FBRs are conventionally cylindrical, other shapes such as square columns have been used.14 Dead-zones are encountered more frequently in square columns where the sharp corners of the reactor15 promote their occurrences. The presence of dead-zones inhibits proper particle mixing in the reactor. In16 their comparative study on the effect of bed geometry on mixing rate, Gorji-kandi et al. (2015) concluded17 that mixing rate is greater in a cylindrical bed than a square bed FBR. This was attributed to the presence18 of dead-zones at the corners of the square reactor which caused slow motion of particles. The presence of19 slow fluidization on the wall of the reactor had been confirmed earlier (Efstathios and Michaelides, 2013).20 Therefore, it is necessary to choose appropriate shape of the reactor for effective wastewater treatment.21 The cross-sectional area of the reactor is another parameter that can affect the hydrodynamics and22 treatment performance of FBR. Generally, FBR can be divided into a flatbed or a tapered-bed FBR (Fig.23 4). Conventional FBRs are flatbed reactors with uniform cross-sectional areas. However, wash-out of24
  • 30. M ANUSCRIPT ACCEPTED ACCEPTED MANUSCRIPT 28 particles occurs sometimes due to high superficial velocity. To overcome this challenge, Scott C. D and1 Hancher C. W. introduced the concept of tapered-bed FBR in 1976 (Parthiban et al., 2007). In Tapered2 FBR, the cross-sectional area of the reactor is made narrower at the bottom (tapered-in) or both bottom3 and top (tapered-in tapered-out) (Askaripour and Dehkordi, 2015). This results in a stable feed4 introduction as well as minimizes eddies and back mixing that could arise in flatbed FBR. However, it is5 necessary to ensure appropriate taper angle so that turbulent flow due to sudden expansion can be6 avoided.7 8 9 10 Fig. 4 Flatbed versus tapered-in FBR (Adapted from: Heat and Mass Transfer in Particulate Suspensions11 In: Springer Briefs in Applied Sciences and Technology, Efstathios and Michaelides, 2013, pp 89 – 199,12 with permission from Springer)13 14 A comparative study on the performance of a flatbed FBR and a tapered FBR showed that the latter15 has superior treatment performance and better hydrodynamic characteristics (Huang et al., 2000). Three16 FBRs having 0 o , 2.5 o and 5 o taper angles were compared in the study. The hydrodynamics characteristics17 and performance of the three FBRs were in the following increasing order 5o → 2.5 o → 0 o . A previous18 study by Wu and Huang, (1996) reported that COD removal efficiency of a tapered FBR was higher than19 a flatbed FBR when the taper angle does not exceed 5o . Above 5 o taper angle, the performance of the20 flatbed FBR was either higher or lower than the tapered FBR.21
  • 31. M ANUSCRIPT ACCEPTED ACCEPTED MANUSCRIPT 29 3.1.2. Aspect Ratio1 Aspect ratio, defined as the ratio of the static bed height to the reactor diameter,2 is an important design parameter of FBR. The aspect ratio has an influence on3 fluid circulation velocity and consequently on the phase mixing in the reactor4 (Weipeng et al., 2014). Large aspect ratio promotes bubble coalescence and5 higher solid holdup. This reduces both gas /liquid holdup and the interphase6 mixing. Conversely, a low aspect ratio promotes higher liquid/gas holdup and7 encourages interphase mixing. Therefore, low aspect ratio can reduce the fluid8 flow rate requirement and hence lower the process cost (Ochieng et al., 2003). It9 is therefore necessary to select the appropriate aspect ratio for proper design and10 successful application. Typical ranges of aspect ratio for both laboratory/pilot11 FBRs and technical plants are shown in Table 5 (Jordening and Buchholz,12 1999). Laboratory scale FBRs usually have small diameters in relation to the13 reactor column height and the corresponding static bed height. Since the reactor14 volume is small, a small diameter and a relatively high static bed height can give15 the necessary solid loading. In the case of full scale FBR, a long and narrow16 column may result in slugging effect (Kunii and Levenspiel, 1991) and hence the17 diameter is usually made relatively bigger to achieve the necessary degree of18 fluidization. However, a very large diameter may pose challenges to uniform19 fluidization. Therefore, a compromise is usually necessary (Jordening and20 Buchholz, 1999). For example, Ochieng et al.,(2002) found an aspect ratio of 1021 to be the optimum in their treatment of brewery wastewater using laboratory-22 scale FBBRTable 523 Typical range of aspect ratio for FBR24 25 FBR Type Aspect Ratio Laboratory scale Technical plant 5 – 25 2 – 5 26 In FBBR, large aspect ratio results in more surfaces for biomass growth. However, higher aspect ratio27 above the optimum value will increase solid holdup and thereby inhibit proper mixing of the bioparticles28 and wastewater. The increased amount of solid particles due to the high aspect ratio will equally increase29 the fluid pumping requirement of the system (Sabarunisha and Radha, 2014).30 3.1.3. Reactor internals31 Another parameter that affects FBR performance is the presence of an internal structure in the reactor.32 Internals, such as tubes and baffles, are sometimes introduced into the reactor to modify the flow33 structures and improve particles fluidization. Reactor internals promotes uniform mixing which result in34
  • 32. M ANUSCRIPT ACCEPTED ACCEPTED MANUSCRIPT 30 effective fluidization (Qin et al., 2014). Although the main purpose of internals is to ensure uniform1 fluidization, additional benefits such as enhanced phase contact, controlled solid holdup and improved2 radial mixing are obtained (Jin et al., 2003). The downside of the internals is that they can increase the3 complexity of system design and operation (Dutta and Suciu, 1992).4 Internals can be broadly classified into baffles, tubes, packings, inserted bodies, and other5 configurations developed for various specific applications. Baffles and tubes are the most commonly used6 internals, in wastewater treatments. Examples of baffles include wire mesh, ring, perforated plate etc.7 while tubes can be draft tubes, horizontal and vertical banks. Many studies have been reported on reactor8 internals such as vertical internals (Ramamoorthy and Subramanian, 1981), horizontal tubes (Olowson,9 1994), perforated baffles (Zhao et al., 1992), ring-type internals (Zhu et al., 1997) and other variations. In10 general, internals have effects on the bubble behavior, flow distribution and phase mixing.11 Studies have shown that introducing a draft tube into FBR can enhance the process performance.12 Wang et al., (2015) reported that a FBR with internal draft tube gave a higher decolorisation and TOC13 removal compared with conventional FBR in their study for orange G degradation. Similarly, Nam et al.,14 (2009) reported similar findings when they compared the performance of conventional FBR and FBR15 with an internal draft tube (DTFBR). The DTFBR showed superior performance under all the conditions16 investigated which was attributed to the more uniform distribution of the catalyst.17 In another study, Vinod & Reddy, (2005) used a draft tube FBBR for the treatment of phenolic18 wastewater, achieving up to 96 % removal efficiency. Interestingly, Wei et al., (2000) compared the19 hydrodynamics of FBRs with conventional internal draft tube and with convergence-divergence draft20 tube. Results showed that gas holdup is higher in the FBR with convergence-divergence draft tube than21 the conventional draft tube FBR. Conversely, liquid circulation velocity was found to be lower in the22 convergence-divergence draft tube reactor, perhaps due to the decrease in the velocity caused by the23 divergence/convergence tube.24 However, Nam et al., (2002) reported that internal draft tube has a negligible effect on the performance25 of FBR in the photocatalytic oxidation of methyl orange. The photocatalytic degradation was found to26
  • 33. M ANUSCRIPT ACCEPTED ACCEPTED MANUSCRIPT 31 depend largely on the amount of catalyst and lamp power rather than the reactor internals. However, the1 range of gas flow rates tested in the study may have been too low to make a significant difference in the2 hydrodynamics of the two different reactors. To buttress that, the authors reported the superiority of the3 DTFBR over the conventional FBR in another study (Nam et al., 2009). Thus, it is obvious that internals4 can affect the reactor hydrodynamics and therefore influences the treatment performance of the FBR.5 3.2. Support Material6 The properties of support materials such as particle size, density and surface characteristics can affect7 the process performance of FBR (Wirsum et al., 2001). The choice of support material would therefore8 determine, to a great extent, the process engineering (Jordening and Buchholz, 1999). The effects of9 particle loading, density, size and surface properties on the reactor performance are discussed in this10 section.11 3.2.1. Particle size and surface property12 Particle size is an important parameter that affects fluidization as well as heat and mass transfer in the13 reactor. In fact, it has been argued that particle size could be the most important factor that govern mass14 transfer in a three-phase FBR (Kim and Kang, 1997). Although developed for gas-solid fluidization,15 Geldart classification of particles can be useful in classifying solids for wastewater applications. Geldart,16 (1973) classified solid particles into four groups (A, B, C and D) based on their mean size and density17 difference between the particles and the fluidizing medium. Group A are particles with small mean size18 between 30 to 100 µm, group B ranges between 100 to 800 µm, group C has mean size less than 20 µm19 while group D has a mean size above 1 mm. For each classification, different flow regimes and bed20 behavior are observed. Although all these types of solids are used in traditional fluidization applications,21 only Geldart B and D particles are applicable to wastewater treatment.22 Both heat and mass transfer in FBR increase with increase in particle size. This is because large particles23 have the capability to break up and disintegrate large bubbles (Nguyen-tien et al., 1984). For a given24
  • 34. M ANUSCRIPT ACCEPTED ACCEPTED MANUSCRIPT 32 liquid velocity, larger particles would result in a better mass transfer and subsequent reactor performance1 than smaller ones (Begum and Radha, 2015). In a study to investigate the effect of zeolite diameter used2 as a support material in FBBR, it was reported that larger diameter (0.5 – 0.8 mm) gave slightly higher3 COD removal than smaller ones (0.2 – 0.5 mm) (Fernández et al., 2008). Therefore, it is generally4 believed that mass transfer coefficient in FBR increases with increase in bed particle diameter.5 However, large particles can increase bed pressure drop (Dora et al., 2012) which will consequently6 increase the fluidization requirement (Midha et al., 2012). Lakshmi et al., (2000) investigated the effect of7 particle diameter on the minimum fluidization velocity in a two-phase IFBR using LDPE and propylene8 particles. They reported that the minimum fluidization velocity increased with increase in particle9 diameter for the two types of particles investigated. This was attributed to the increase in the Archimedes10 number which increases with increase in particle diameter.11 Surface characteristic of the solid particle is another important parameter that can affect the12 performance of FBR. Solid particles can be hydrophobic or hydrophilic. Unlike hydrophobic particles,13 hydrophilic particles mix excellently with water. This improves the mass transfer coefficient for up-flow14 fluidization (Kim and Kang, 1997). However, for inverse fluidization, the reverse is the case. Han et al.,15 (2003) compared hydrophobic and hydrophilic particles having the same density and concluded that16 hydrophobic are better than hydrophilic particles for inverse fluidization. This was attributed to the17 retardation of rising bubbles near the hydrophobic particles which subsequently increased the gas holdup.18 A similar concept of hydrophobic/hydrophilic was discussed by Choi & Shin, (1999) and observed by19 Buffiere et al., (1998) during their study of an IFBBR. Kim & Kangt, (1997) had equally discussed this in20 terms of the wettability of the particles. This shows the importance of surface properties of FBR support21 materials in wastewater treatment.22 Particles with high specific surface areas, good physicochemical and fluidodynamic properties should23 therefore be used as support materials (Pen and Jose, 2008). Particles with irregular surfaces, sharp angles24 and crevices are suitable for biomass attachment and development which are important in FBBR (Buffiere25
  • 35. M ANUSCRIPT ACCEPTED ACCEPTED MANUSCRIPT 33 et al., 1998). Silica, quartz sand, granular activated carbon, vitreous coke, glass beads, PVC, are some of1 the common support materials used in FBR (Alfredo et al., 2013). The particle diameter of the support2 materials is usually less than 1 mm, though larger particles have also been used (Vinod and Reddy, 2005).3 The specific area of bed materials after fluidization can be calculated using the following formula:4 ܽ௦ = ଺ሺଵିఌሻ ௗ ట (4)5 Where6 as = specific surface area (m-1 )7 ε = expanded bed porosity (dimensionless)8 d = support particle diameter (mm)9 ψ = form factor (dimensionless, equals 1 if considered a pseudo-spherical particle)10 3.2.2. Particle loading11 For successful application, it is necessary to understand the effect of particle loading/initial bed height12 on the hydrodynamics of FBR (Delebarre et al., 2004). The initial static bed height is the height of the13 solid particles in the reactor prior to fluidization. Theoretically, the initial static bed height does not affect14 the minimum fluidization velocity ሺU௠௙) in a conventional FBR (Jena et al., 2009). This is because15 fluidization is achieved when the upward inertial and drag forces exerted on the particles equal the16 buoyant weight of the bed. Lakshmi et al., (2000) studied the effect of bed height on U௠௙ in a two-phase17 FBR and reported that constant velocity is obtained for all bed heights investigated.18 However, Delebarre et al., (2004) studied the influence of bed inventory on fluidization characteristics19 of FBR and concluded that the initial static bed height has effect on U௠௙. An increase in bed inventory20 led to increase in U௠௙. However, there were some inaccuracies in the bed height measurements which21 might have affected the authors’ conclusion. Previous study by Garcia et al., (1999) had reported a small22 influence of particle loading on the liquid velocity of the system. In the case of IFBR, however, the23 fluidization velocity decreases with increase in particle loading (Han et al., 2003).24
  • 36. M ANUSCRIPT ACCEPTED ACCEPTED MANUSCRIPT 34 For a given reactor diameter, particle loading can affect the oxygen mass transfer rate in a three-phase1 FBR. However, the influence of particle loading on oxygen transfer rate is rather complex. High particle2 loading promotes bubble coalescence, which in turns reduces the interfacial area of gas-liquid and hence3 the oxygen mass transfer (Abdel-aziz et al., 2016). Large bubbles will move faster, resulting in shorter4 residence time and consequent low gas hold up. It was reported that an increased particle loading of 15 %5 caused a 30 % drop in oxygen mass transfer in a three-phase FBR for aerobic wastewater treatment (Yu et6 al., 1999).7 The initial static bed also affects the pressure drop across the reactor bed. At U௠௙, the pressure drop8 is equal to the weight of the particles divided by the cross-sectional area of the bed. The pressure drop in9 FBR is the sum of the frictional pressure drop and the static pressure drop. However, the static pressure10 drop is usually negligible and the total pressure drop is then due to the frictional pressure drop only11 (Askaripour and Dehkordi, 2016). Therefore, the frictional pressure drop required to counterbalance the12 weight of the bed increases with increase in initial static bed height (Dora et al., 2012). Thus, it is13 necessary to use appropriate aspect ratio to ensure optimum performance of the system.14 3.2.3. Particle density15 For a given bed height, the density and the surface property of the particles would determine the16 required superficial fluid velocity (Han et al., 2003). Dense particles would require high up-flow velocity17 to achieve fluidization (Escudero, 2010). Also porous materials result in lower superficial velocity18 requirement than non-porous materials (Jordening and Buchholz, 1999). Where FBBR is used, polymeric19 support particles could be the materials of choice because they offer large surface areas for microbial20 growth (Midha et al., 2012). The use of light particles will result in low fluid pumping requirement and21 thereby low operational cost. In such case, however, the aspect ratio should be as low as possible in order22 to achieve bed homogeneity at the low gas/liquid flow rates (Ochieng et al., 2002).23 Conversely, minimum fluidization velocity decreases with increase in particle density in the case of an24 IFBR. A study on the minimum fluidization velocity requirement between a low density polyethylene25
  • 37. M ANUSCRIPT ACCEPTED ACCEPTED MANUSCRIPT 35 (LDPE) (940 kg/m3 ) and polypropylene (PP) (840 kg/m3 ) revealed that the LDPE particles required lesser1 velocity to fluidized than the PP particles (Lakshmi et al., 2000). This is because the upward buoyance2 force increases as the particle density decreases and thus higher liquid velocity is required to achieve3 fluidization.4 For a given initial static bed height, particle density affects bed pressure drop. Dense particles increase5 the weight of the initial static bed height and this increases the pressure drop necessary to counterbalance6 the weight (Dora et al., 2012). A correlation of gas velocity, phase holdups and pressure drop can give7 further insights on the influence of the hydrodynamic characteristics on the process performance8 (Equation 5).9 − d௣ d௭ = ൫ߝsߩs + ߝLߩL + ߝgߩg൯g (5)10 11 ߝs + ߝL + ߝg = 1 (6)12 Where d‫ ݌‬is the pressure drop, d‫ ݖ‬is the bed height; ߝs, ߝL and ߝg are the solid, liquid and gas phase13 holdups respectively; ߩs, ߩL and ߩg are similarly the densities; g is the acceleration due to gravity.14 Clearly from Equation 5, the use of dense particles could lead to an increase in pressure drop, which15 consequently increases power consumption. On the other hand, very low densities could lead to particle16 wash-out. However, a careful design and reactor internal can minimize this problem (Ochieng et al.,17 2002).18 3.3. Superficial fluid velocity19 Superficial fluid velocity ሺU௙ ሻ refers to the volumetric flow rate of the fluid divided by the cross-20 sectional area of the reactor. U௙ is responsible for the particles fluidization and therefore influences the21 particles mixing, heat and mass transfer rate in the reactor (Mostoufi and Chaouki, 2001). Therefore, it is22 necessary to understand how U௙ affect FBR performance. U௙ is required to be within two extremes, the23 minimum fluidization velocity (U௠௙ ) and the terminal fluidization velocity (U௧ ሻ. U௠௙ is the lowest fluid24
  • 38. M ANUSCRIPT ACCEPTED ACCEPTED MANUSCRIPT 36 velocity necessary to initiate particles fluidization while U௧ is the fluid velocity at which particles are1 carried out with the fluid flow (Jovanovic et al., 2014).2 U௠௙ is an important parameter which is closely related to the power requirement of the system3 (Ochieng et al., 2003). A high U௠௙ will result in a high fluidization power requirement. Therefore, it is4 necessary to control U௙ slightly above U௠௙ with as much accuracy and precision as possible (Delebarre et5 al., 2004). U௠௙ can be calculated using Equation 7 (Alfredo et al., 2013).6 ܷ௠௙ = 16.50 ௗమሺఘೞିఘሻ௚ ఓ (7)7 Where8 ܷ௠௙ = minimum fluidization velocity (m/h)9 d = solid particle diameter (mm)10 ߩ௦, ߩ = specific weight of the solid and the water, respectively (g/m3 )11 µ = dynamic viscosity of water (g/m/h)12 g = acceleration of gravity (m/h2 )13 14 Increasing U௙ leads to increase in liquid circulation and mixing rate, thus a shorter reaction time.15 However, this is only true up to the optimum U௙. On the other hand, very high U௙ is associated with16 particle wash-out from the reactor, especially where FBBRs are employed (Jaafari et al., 2014).17 Therefore, selection of optimum U௙ is necessary to ensure successful operation of FBR.18 Although liquid velocity dominates in a three-phase FBR, the flow regime depends on the ratio of the19 superficial liquid velocity to the superficial gas velocity. Both velocities have to be properly designed and20 controlled. It is necessary to have a small liquid velocity to gas velocity ratio in order to have high mass21 transfer coefficients for counter-current flow FBR (Forster, 1980). However, for a concurrent flow22 process, a high ratio will give a well dispersed bubbles and hence high oxygen transfer rate whereas a23 low ratio would result in bubble coalescence and low oxygen transfer rate (Yu et al., 1999). Both24
  • 39. M ANUSCRIPT ACCEPTED ACCEPTED MANUSCRIPT 37 superficial liquid and gas velocities will affect solid and liquid holdups. Increasing superficial liquid1 velocity will cause solid particles to expand faster and hence reduces the solid holdup (Akilamudhan et2 al., 2014). This will in turn increase the liquid holdup. On the other hand, gas holdup increases with3 increase in superficial gas velocity (Wei et al., 2000).4 Nikolov et al., (2000) reported that liquid velocity has a weak effect on the oxygen transfer and gas5 velocity has a strong effect in a three phase IFBR. In general, the smaller the amount of air supplied, the6 more economical the process would be which is desirous for industrial applications (Vimonses et al.,7 2010). However, the capacity of FBBR in aerobic wastewater treatment depends on the oxygen transfer8 rate of the aeration system (Forster, 1980).9 Sabarunisha & Radha, (2014) studied the hydrodynamic behavior of an inverse FBBR for phenol10 biodegradation and reported that COD removal increased with an increase in the superficial gas velocity.11 This was attributed to the higher gas holdup, volumetric mass transfer coefficient and oxygen transfer rate12 due to the increased gas velocity. The highest COD and phenol degradation rates were obtained at a gas13 velocity of 0.220 m/s. Above this optimum value, however, the degradation efficiencies became lower. At14 gas velocities above the optimum value, larger bubbles are formed which dominate over the interfacial15 area, resulting in lower mass transfer. U௙ is affected by the properties of bed materials as well as the16 aspect ratio of the reactor (Zhong et al., 2008).17 4.0. Effect of Operational Parameters18 Since FBR is most commonly used in Fenton oxidation, photocatalytic oxidation and aerobic/anaerobic19 treatments, the discussion on the operational parameters has given emphasis to them. Some of the20 operational parameters that affect FBR performance include pH, catalyst concentration, amount of H2O2,21 temperature, UV intensity, HRT, OLR, and amount of carrier materials.22 4.1. pH23 pH has a remarkable effect on FBR-Fenton as efficient degradation of pollutants is attributed to acidic24 pH (Li et al., 2015). This is because the production of OH. is enhanced at lower pH, usually in the range25
  • 40. M ANUSCRIPT ACCEPTED ACCEPTED MANUSCRIPT 38 of 2.5 to 4.5 (Malik and Saha, 2003). Higher pH favors the formation of ferric and ferric hydroxide1 complexes which have much lower catalytic capability than ferrous ions. On the other hand, very low pH2 promotes hydrogen formation which may reduce the number of active sites for generating ferrous ions3 (Ratanatamskul et al., 2010). A low pH will lead to the formation of Fe2+ :H2O2 complex, which react4 more slowly with H2O2 and thereby produces OH. at slower rate. High pH leads to the formation of5 Fe2+ :OH- complexes which reduces the amount of Fe2+ that are responsible for the decomposition of6 H2O2.7 Chia-Chi et al., (2011) investigated the effect of operational parameters on the decolorisation of textile8 wastewater by FBR-Fenton and reported that the process performance increased as the pH was increased9 from 2 to 3. However, increasing the pH above 3 led to a decrease in the removal efficiency. The10 degradation was highest at pH 3. Low pH was associated with production of FeOOH2+ which compete11 with Fe2+ in reacting with H2O2. At pH above 4, Fe2+ is unstable and easily forms Fe3+ . However, in their12 investigation of parameters affecting FBR-Fenton process for the treatment of recalcitrant organic silicon13 wastewater, Liu et al., (2014) reported that the pH has an insignificant effect on the COD and TOC14 removal. Other parameters such H2O2/Fe2+ and particle loading were found to have more impact on the15 process. Therefore, the effect pH may also depend upon other process parameters such as Fe2+ /H2O216 concentration. From the reviewed literature, the optimum pH in FBR-Fenton process ranges between 2 to17 4 which is quite similar to the range use in conventional Fenton oxidation (Table 1).18 In FBR-Photocatalysis, pH affects the charge on the catalyst particles, size of catalyst aggregates and19 the positions of conductance and valence bands (Meng et al., 2010). At low pH, the environment around20 the photocatalyst would become positively charged and negatively charged at high pH. In order to fully21 study the impact of pH on photocatalytic oxidation, the concept of point of zero charge (PZC) of TiO2 is22 used. The PZC is a condition where the surface charge of TiO2 is zero or neutral and lies in the pH range23 of 4.5 - 7.0. The implication is that the interaction between the photocatalyst and the contaminants is24 minimal. Details on the PCZ have been explained elsewhere (Meng et al., 2010). Under acidic conditions,25
  • 41. M ANUSCRIPT ACCEPTED ACCEPTED MANUSCRIPT 39 the surface of is TiO2 protonated and deprotonated under alkaline condition (Gaya and Halim, 2008).1 Thus, TiO2 has higher oxidizing power at low pH.2 Nam et al., (2002) investigated the effect of pH on the photocatalytic degradation of methyl orange in a3 three-phase FBR and obtained higher performance at lower pH values. At lower pH, reduction by4 electrons in the conduction band plays an important role in the degradation while at neutral or high pH5 levels, hydroxyl radicals may be the predominant oxidation species. However, very low pH may result in6 excess H+ which can lower the reaction rate.7 In FBBR, pH is an important parameter that affects process performance because of its effect on8 microorganisms. Very high or low pH can affect FBBR performance due to the inhibitory effect of9 superacidity and superalkalinity on the activity of the intracellular enzyme of bacteria (Jianping et al.,10 2003). Lin et al., (2010) studied the biodegradation of Reactive blue 13 in a two-stage anaerobic/aerobic11 FBBR with a Pseudomonas sp. At pH between 5 and 9, the color removal efficiency fluctuated between12 75.6 % to 86.9 %, while the total COD removal efficiency varied between 67.7 % and 90.4 %. The13 optimum pH for the degradation was between 6 and 7.14 Zeroual et al., (2007) investigated the effect of pH (3 to 9) on the decolorisation of different dyes by15 calcium alginate-immobilized Geotrichum sp. in FBBR. Maximum decolorisation was achieved at pH 5.16 Above pH 5, the decolorisation rate decreased significantly. Jianping et al., (2003) studied the effect of17 pH on the denitrification treatment of low C/N ratio nitrate-nitrogen wastewater in a three-phase FBR.18 The optimum pH was found to be between 6.5 to 7.5. Similarly, District et al., (1996) reported an19 improvement in FBBR performance when pH was increased from 7 to 7.5.20 4.2. Temperature21 . Temperature is an important operational parameter, especially in FBBR. Unlike other technologies22 such as a fixed-bed reactor, temperature fluctuation is uncommon in FBBR because of the excellent phase23 mixing. Therefore, t fluidization will improve the process performance in terms of temperature24 uniformity. Nevertheless, it is necessary to establish the optimum temperature for a given process. High25
  • 42. M ANUSCRIPT ACCEPTED ACCEPTED MANUSCRIPT 40 temperature may cause protein denaturation while low temperature may inhibit the activity of intracellular1 enzymes and result in low metabolism (Jianping et al., 2003).2 For example, an efficient denitrification was achieved at an optimum temperature of 30 o C during3 autotrophic denitrification using FBBR (Zou et al., 2016) while Jianping et al., (2003) reported an4 optimum temperature between 20 to 35 o C for the removal of nitrate-nitrogen from wastewater using a5 three-phase FBBR. On the other hand, Zeroual et al., (2007) reported that the decolorisation rate of four6 different dyes using calcium alginate-immobilized Geotrichum sp. increased when the temperature was7 increased from 25 to 35 o C. However, when the temperature was increased to 45 o C the decolorisation8 rate decreased drastically. The reduction of decolorisation activity at 45 °C was attributed to the9 denaturation of the enzymes involved in the degradation of the azo dyes and the loss of fungal cell10 viability at high temperature.11 4.3. H2O2 Concentration12 In FBR-Fenton, the concentration of H2O2 determines the potential OH. that can be generated in the13 reaction. Thus, pollutant degradation increases with increase in H2O2 concentration, until the optimum14 concentration is reached. Beyond the optimum concentration, process performance usually decreases due15 to scavenging effect of the OH. (Ahmadi et al., 2015). Scavenging effect occurs when the excessive H2O216 acts as radical scavenger and change the more reactive OH. to a less reactive hydroperoxyl radicals as17 shown in Equations 8 and 9 (Li et al., 2015).18 19 H2O2 + OH. → HO2 • + H2O (8)20 HO2 • + OH. → H2O + O2 (9)21 However, the effect of H2O2 on the process is closely linked to the amount of Fe2+ . Therefore, the ratio22 of H2O2 to Fe2+ is equally important. Indeed, some researchers have reported the effect of H2O2 vis-à-vis23 the concentration of Fe2+ (Su et al., 2011). In a study to establish the optimum condition for degrading24 2,4-Dichlorophenol using FBR-Fenton process, H2O2 was found to be the major parameter affecting the25
  • 43. M ANUSCRIPT ACCEPTED ACCEPTED MANUSCRIPT 41 process (Muangthai et al., 2010). Increasing H2O2 from 1 to 10 mM led to an increased degradation from1 70 % to 98 % at a constant Fe2+ concentration (0.1 mM). Wang et al., (2015) investigated the2 degradation of Orange G in FBR-Fenton and reported that the decolorisation of the dye increases with3 increase in H2O2 up to 25 mg/L.4 There is variation in the optimum amount of H2O2 in the FBR-Fenton process reported in the literature5 (Table 1). Though most of the studies have reported between 50 to 60 mM, others have used6 concentrations outside this range. Since there are differences in the reported studies either from the7 pollutant being degraded or other process parameters, these variations were to be expected. However, all8 the studies have shown that the reaction rate increases with an increase in H2O2 concentration until the9 optimum amount is reached. High concentration may inhibit the degradation due to the scavenging effect10 of the H2O2. Also the ratio of H2O2 to Fe2+ was shown to be significant when discussing the effect of11 H2O2 on the process. Therefore, the optimum dosage of H2O2 is application-specific and depends on other12 parameters such as the Fe2+ concentration.13 4.4. Fe2+ concentration14 Fe2+ acts as a catalyst in decomposing H2O2 to produce OH. in FBR-Fenton. Therefore, increasing its15 concentration leads to an increase in the production of OH. . However, increasing the concentration above16 the optimum amount can inhibit the process (Muangthai et al., 2010). This is because excess Fe2+ acts as a17 scavenger, reacting with OH. and decreasing their availability to oxidize the pollutant. Excess Fe2+ may18 also cause turbidity in the reactor, decreasing light penetration when UV is used (Wang et al., 2015). This19 underscores the importance of establishing the optimum dosage of Fe2+ vis-à-vis the amount of H2O2.20 Previous studies have shown that the concentration of Fe2+ has a positive effect on pollutant21 degradation in FBR-Fenton, with the optimum dosage around 5 mM in most of the reported literature22 (Table 1). Ratanatamskul & Narkwittaya, (2010) found that the degradation of 2,6-dimethylaniline by23 FBR-Fenton process increased from 83 to 100 % when Fe2+ was increased from 1 to 5 mM. The24 optimum concentration was found to be 2.5 mM. In another study, Briones et al., (2012) studied the25
  • 44. M ANUSCRIPT ACCEPTED ACCEPTED MANUSCRIPT 42 degradation of acetaminophen using FBR-Fenton process and found that increasing the iron concentration1 from 0.01 to 0.1 mmol-1 led to increase in ACT degradation. However, the increase was more evident at2 acidic pH.3 4.5. Photocatalyst Concentration4 FBR-Photocatalysis uses metal oxide, usually TiO2, as the photocatalyst. The concentration of TiO2 has5 a strong effect on the rate of photocatalytic process and hence, the performance of the reactor. When the6 amount of TiO2 is increased, the photocatalytic activity increases and therefore higher degradation rate is7 obtained. This is because the surface area available for photocatalytic reaction increases with an increased8 in the catalyst concentration. However, increasing the concentration above the saturation level may lead9 to turbidity (Meng et al., 2010) which reduces light penetration into the reaction matrix and hinders the10 photocatalytic performance of the reactor (Zulfakar et al., 2011). Also from an economic viewpoint,11 excess catalysts should be avoided so as to keep the operating cost as low as possible. Therefore, it is12 imperative to establish the optimum dosage of the TiO2. Where immobilized TiO2 is used, additional13 removal is obtained via adsorption of pollutants on the surface of the solid.14 Youngsoo Na et al., (2005) studied the photocatalytic decolorisation of rhodamine B by immobilized15 TiO2 /UV in an FBR and reported that the decolorisation rate increased with increase in TiO2 dosage. The16 immobilized TiO2 was responsible for both degradation and adsorption of the dye. However, since UV17 light was used, excessive amount of the catalyst could hinder light penetration. A dosage of 33.8 g/L was18 found to be the optimum concentration. Details of typical photocatalyst concentrations reported in the19 literature can be found in Table 2.20 4.6. UV Intensity21 A source of photons, mostly UV lamp, is usually introduced into FBR-photocatalysis and FBR-Photo-22 Fenton processes. The rate of photon increases as the number and intensity of UV lamps increase. The23 degradation efficiency of FBR-photocatalysis increases with UV light intensity, and shorter wavelength24 gives higher degradation (Lim and Kim, 2002). Shorter wavelength light is adsorbed more strongly by25
  • 45. M ANUSCRIPT ACCEPTED ACCEPTED MANUSCRIPT 43 TiO2 particles than longer one. Therefore, the penetration distance of photons into TiO2 particles is shorter1 and electrons and holes are formed closer to the surface of the particles.2 In their study for the Photooxidation of sodium lauryl sulfate in a three-phase FBR using TiO2/SiO2 ,3 Nam et al., (2009) found that the degradation rate increased with an increase in the UV light intensity.4 The intensity of light determines the potential number of photons that can be generated and hence the5 number of photons that may eventually reach the catalyst surface. Thus a 65 W lamp gave a better6 performance than a 30 W lamp.7 Also the position of the UV lamp in relation to the reaction matrix is also important. The closer the lamp8 is to the reaction matrix the higher the amount of photons reaching the reactants. Kanki et al., (2005)9 investigated the influence of UV irradiation on FBR-photocatalytic process using TiO2-coated ceramic10 particles. Two FBRs, one with an internal UV lamp (254 nm, 9 W) and the other with an outside black11 lamp (365 nm, 15 W) were used. The reactor with the internal UV lamp degraded the pollutant 4 times12 faster than the other reactor. This signifies the importance of the proximity of the light source to the13 reaction matrix.14 4.7. Hydraulic Retention Time (HRT)15 HRT is the average length of time the wastewater stays in the reactor. Generally, long HRT leads to a16 better performance of FBR-AOPs, until the optimum time is reached. Above the optimum HRT, there is17 usually little or no further degradation of the pollutant. During a treatment of recalcitrant organic silicone18 wastewater using FBR-Fenton, Liu et al., (2014) found out that the degradation of COD and TOC19 increased as the HRT was increased from 15 – 60 min, with no further degradation thereafter. Thus, the20 optimum HRT was 60 min corresponding to COD and TOC removal efficiency of 90 % and 78 %21 respectively. In another study for COD removal from hospital wastewater, 98 % removal efficiency was22 achieved at an HRT of 90 minutes (Anand et al., 2015).23 In FBBR, any change in HRT is likely to affect the OLR and hence the performance of the reactor24 (Haroun and Idris, 2009). The efficiency of pollutant removal in FBBR is a function of the HRT which is25
  • 46. M ANUSCRIPT ACCEPTED ACCEPTED MANUSCRIPT 44 concomitant with OLR (Perez et al., 2007). Increasing the HRT leads to a decrease in OLR, other1 conditions being equal. For a constant OLR, increase in HRT will lead to higher performance of the2 process as microorganisms will have more time to degrade the pollutant. However, above the optimum3 HRT, the process becomes independent of the HRT (Borja et al., 2001). Although HRT can be controlled4 through flow rate manipulation, it may pose fluidization challenges for the bioparticles (Christianson et5 al., 2015). Thus, there is a need for a trade-off between the HRT and flow rates to obtain the optimum6 condition for each process.7 For aerobic FBBR, the optimum degradation is usually achieved within a short HRT, depending on the8 microorganisms, pollutants and other operational parameters (Table 3). Rajasimman & Karthikeyan,9 (2007) investigated the effect of HRT on the treatment of starch wastewater in an aerobic FBBR and10 reported that the COD reduction increased with increased in HRT for all initial substrate concentrations.11 The optimum removal efficiency of 93.8 5% was achieved after 24 h.12 The effect of HRT on anaerobic FBBR follows the same trend as that of aerobic FBBR. Cuenca et al.,13 (2006) investigated the anaerobic biodegradation of diesel fuel-contaminated wastewater in an FBBR and14 reported that both the diesel and COD removal efficiencies increased with increased in HRT for all the15 conditions investigated. Lin et al., (2010) studied the effect of HRT on dye degradation using a two-stage16 anaerobic/aerobic FBR and reported that the overall degradation was enhanced when HRT was increased17 from 20 h to 70 h.18 4.8. Organic Loading Rate (OLR)19 OLR is the measure of organic pollutants which is expressed as kilogram (kg) of COD per cubic-meter20 (m3 ) per day (d). In FBBR, OLR is normally manipulated through variation of flowrate. When OLR is21 increased, the performance of the system reduces due to shock and disturbance on the biomass. However,22 the microorganisms adjust to the new OLR and the process performance usually resumes. Good FBBR23 performance is usually associated with low OLR (Balaji and Poongothai, 2012). On the other hand, when24 the substrate is limiting in the process, increasing OLR can improve the process performance (Fernández25