Downtown office assessment trends - values increasing year over year
•
0 likes•144 views

Learn about what is going on with downtown office assessments. See the trend in assessments from the previous years. *Spoiler* large increases in Downtown office assessed values continue year over year.
Recommended

Recommended
More Related Content
Viewers also liked
Viewers also liked (13)
Similar to Downtown office assessment trends - values increasing year over year
Similar to Downtown office assessment trends - values increasing year over year (20)
Recently uploaded
Recently uploaded (20)
Downtown office assessment trends - values increasing year over year
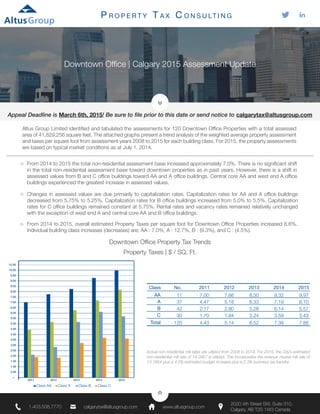
- 1. Appeal Deadline is March 6th, 2015! Be sure to file prior to this date or send notice to calgarytax@altusgroup.com Downtown Office | Calgary 2015 Assessment Update P R O P E R T Y T A X C O N S U LT I N G 1.403.508.7770 calgarytax@altusgroup.com www.altusgroup.com 2020 4th Street SW, Suite 310, Calgary, AB T2S 1W3 Canada Altus Group Limited identified and tabulated the assessments for 120 Downtown Office Properties with a total assessed area of 41,829,256 square feet. The attached graphs present a trend analysis of the weighted average property assessment and taxes per square foot from assessment years 2008 to 2015 for each building class. For 2015, the property assessments are based on typical market conditions as at July 1, 2014. Changes in assessed values are due primarily to capitalization rates. Capitalization rates for AA and A office buildings decreased from 5.75% to 5.25%. Capitalization rates for B office buildings increased from 5.0% to 5.5%. Capitalization rates for C office buildings remained constant at 5.75%. Rental rates and vacancy rates remained relatively unchanged with the exception of west end A and central core AA and B office buildings. From 2014 to 2015 the total non‐residential assessment base increased approximately 7.0%. There is no significant shift in the total non‐residential assessment base toward downtown properties as in past years. However, there is a shift in assessed values from B and C office buildings toward AA and A office buildings. Central core AA and west end A office buildings experienced the greatest increase in assessed values. From 2014 to 2015, overall estimated Property Taxes per square foot for Downtown Office Properties increased 6.6%. Individual building class increases (decreases) are; AA : 7.0%, A : 12.7%, B : (9.3%), and C : (4.5%). 6.00 5.50 5.00 4.50 4.00 3.50 3.00 2.50 2.00 1.50 1.00 0.50 2011 2012 2013 2014 2015 10.00 9.50 9.00 8.50 8.00 7.50 7.00 6.50 10.50 Class AA Class A Class B Class C 2015 9.97 8.10 5.57 3.43 7.88 2014 9.32 7.19 6.14 3.59 7.39 2013 8.30 6.33 5.28 3.24 6.52 2012 7.66 5.18 2.80 1.84 5.14 2011 7.00 4.47 2.17 1.70 4.43 No. 11 37 42 30 120 Class AA A B C Total Actual non‐residential mill rates are utilized from 2008 to 2014. For 2015, the City’s estimated non‐residential mill rate of 14.0967 is utilized. This incorporates the revenue neutral mill rate of 13.1864 plus a 4.5% estimated budget increase plus a 2.3% business tax transfer. Downtown Office Property Tax Trends Property Taxes | $ / SQ. Ft.