Unit 3: Morgan-Keenan Luminosity Class
•
0 likes•427 views

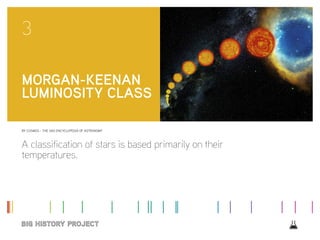
A classification of stars is based primarily on their temperatures. Register to explore the whole course here: https://school.bighistoryproject.com/bhplive?WT.mc_id=Slideshare12202017

Recommended
More Related Content
What's hot
What's hot (12)
Viewers also liked
Viewers also liked (7)
Similar to Unit 3: Morgan-Keenan Luminosity Class
Similar to Unit 3: Morgan-Keenan Luminosity Class (20)
More from Big History Project
More from Big History Project (20)
Recently uploaded
Recently uploaded (20)
Unit 3: Morgan-Keenan Luminosity Class
- 1. BY COSMOS - THE SAO ENCYCLOPEDIA OF ASTRONOMY A classification of stars is based primarily on their temperatures. 3 MORGAN-KEENAN LUMINOSITY CLASS
- 2. BIG HISTORY PROJECT MORGAN-KEENAN LUMINOSITY CLASS 2 The Harvard spectral classification scheme assigns each star a spectral type which is further divided into 10 sub-classes depending on the absorption features present in the spectrum. For example, our Sun has a temperature of about 5,700 Kelvin and is classified as a G2 star. However, this classification scheme does not completely describe the star as it cannot distinguish between stars with the same temperature but different luminosities. In other words, it cannot distinguish between main sequence (dwarf) stars, giant stars and supergiant stars. For this reason, the Morgan-Keenan luminosity class (MK or MKK) was established. Originally containing roman numerals between I (supergiant star) and V (main sequence), these days, class I stars have been subdivided into Ia-O, Ia and Ib, and classes VI (sub-dwarf) and D (white dwarf) have been added. To completely describe the star, the MK luminosity class is appended to the original Harvard classification for the star. For example, our Sun is a main sequence G2 star, therefore its full classification is G2V. The following table summarizes the MK Luminosity Classes: Class Star Ia-O extremely luminous supergiants Ia luminous supergiants Ib less luminous supergiants II bright giants III normal giants IV subgiants V main sequence dwarf stars VI, or sd subdwarfs D white dwarfs HERTZSPRUNG-RUSSELL DIAGRAM The Hertzsprung-Russell diagram (HR diagram) is one of the most important tools in the study of stellar evolution. Developed independently in the early 1900s by Ejnar Hertzsprung and Henry Norris Russell, it plots the temperature of stars against their luminosity (the theoretical HR diagram), or the colour of stars (or spectral type) against their absolute magnitude (the observational HR diagram, also known as a colour-magnitude diagram). Depending on its initial mass, every star goes through specific evolutionary stages dictated by its internal structure and how it produces energy. Each of these stages corresponds to a change in the temperature and luminosity of the star, which can be seen to move to different regions on the HR diagram as it evolves. This reveals the true power of the HR diagram – astronomers can know a star’s internal structure and Hertzsprung-Russell diagram
- 3. BIG HISTORY PROJECT MORGAN-KEENAN LUMINOSITY CLASS 3 evolutionary stage simply by determining its position in the diagram. This Hertzsprung-Russell diagram shows a group of stars in various stages of their evolution. By far the most prominent feature is the main sequence, which runs from the upper left (hot, luminous stars) to the bottom right (cool, faint stars) of the diagram. The giant branch is also well populated and there are many white dwarfs. Also plotted are the Morgan-Keenan luminosity classes that distinguish between stars of the same temperature but different luminosity. There are 3 main regions (or evolutionary stages) of the HR diagram: 1. The main sequence stretching from the upper left (hot, luminous stars) to the bottom right (cool, faint stars) dominates the HR diagram. It is here that stars spend about 90% of their lives burning hydrogen into helium in their cores. Main sequence stars have a Morgan-Keenan luminosity class labelled V. 2. Red giant and supergiant stars (luminosity classes I through III) occupy the region above the main sequence. They have low surface temperatures and high luminosities which, according to the Stefan-Boltzmann law, means they also have large radii. Stars enter this evolutionary stage once they have exhausted the hydrogen fuel in their cores and have started to burn helium and other heavier elements. 3. White dwarf stars (luminosity class D) are the final evolutionary stage of low to intermediate mass stars, and are found in the bottom left of the HR diagram. These stars are very hot but have low luminosities due to their small size. The Sun is found on the main sequence with a luminosity of 1 and a temperature of around 5,400 Kelvin. Astronomers generally use the HR diagram to either summarize the evolution of stars, or to investigate the properties of a collection of stars. In particular, by plotting a HR diagram for either a globular or open cluster of stars, astronomers can estimate the age of the cluster from where stars appear to turnoff the main sequence. Comparison of the current-day Sun and the Sun as a red giant in the future.
- 4. BIG HISTORY PROJECT MORGAN-KEENAN LUMINOSITY CLASS 4 Source COSMOS - The SAO Encyclopedia of Astronomy http://astronomy.swin.edu. au/cosmos/ Cover image: Artist’s depiction of the life cycle of a Sun-like star, starting as a main-sequence star at lower left then expanding through the subgiant and giant phases, until its outer envelope is expelled to form a planetary nebula at upper right. ESO/S. Steinhöfel - ESO. CC BY 4.0. https://commons.wikimedia. org/wiki/File:The_life_of_Sun-like_ stars.jpg Image of Hertzsprung-Russel Diagram identifying many well known stars in the Milky Way galaxy. CC BY 4.0. https:// www.eso.org/public/images/eso0728c/ Image of a comparison of the current- day Sun and the Sun as a red giant in the future. Credit: Oona Räisänen (User:Mysid), User:Mrsanitazier. - Vectorized in Inkscape by Mysid on a JPEG by Mrsanitazier. CC BY-SA 3.0. https://commons.wikimedia.org/w/ index.php?curid=2585107