
Recommended
Recommended
More Related Content
Similar to Exchange Rates - Previous YearsYEAR 11YEAR 12YEAR 13
Similar to Exchange Rates - Previous YearsYEAR 11YEAR 12YEAR 13 (20)
More from BetseyCalderon89
More from BetseyCalderon89 (20)
Recently uploaded
Recently uploaded (20)
Exchange Rates - Previous YearsYEAR 11YEAR 12YEAR 13
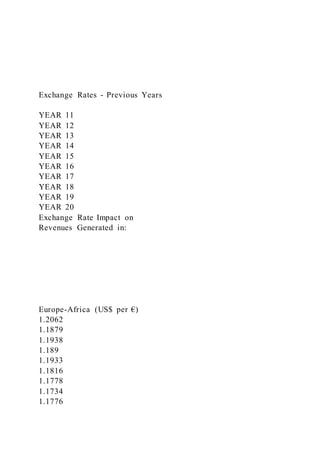
- 1. Exchange Rates - Previous Years YEAR 11 YEAR 12 YEAR 13 YEAR 14 YEAR 15 YEAR 16 YEAR 17 YEAR 18 YEAR 19 YEAR 20 Exchange Rate Impact on Revenues Generated in: Europe-Africa (US$ per €) 1.2062 1.1879 1.1938 1.189 1.1933 1.1816 1.1778 1.1734 1.1776
- 2. 1.1877 Asia-Pacific (US$ per Sing$) 0.752 0.7419 0.7429 0.7424 0.7456 0.7422 0.7424 0.7433 0.7441 0.7469 Latin America (US$ per R) 0.1783 0.1723 0.1791 0.1778 0.1799 0.181 0.1771 0.1733 0.1752 0.1789 Exchange Rate Impact on Cost of Pairs Shipped from: North America Plant to
- 3. Europe-Africa (€ per US$) 0.829 0.8418 0.8377 0.841 0.838 0.8463 0.849 0.8522 0.8492 0.842 Asia-Pacific (Sing$ per US$) 1.3298 1.3479 1.3461 1.347 1.3412 1.3473 1.347 1.3454 1.3439 1.3389 Latin America (R per US$) 5.6085 5.8038 5.5835 5.6243 5.5586 5.5249 5.6465 5.7703 5.7078
- 4. 5.5897 Europe-Africa Plant to North America (US$ per €) 1.2062 1.1879 1.1938 1.189 1.1933 1.1816 1.1778 1.1734 1.1776 1.1877 Asia-Pacific (Sing$ per €) 1.6041 1.601 1.6069 1.6015 1.6003 1.5921 1.5863 1.5788 1.5825 1.5903 Latin America (R per €) 6.7659 6.8966 6.6313 6.689
- 5. 6.6357 6.5274 6.6489 6.7705 6.7249 6.6401 Asia-Pacific Plant to North America (US$ per Sing$) 0.752 0.7419 0.7429 0.7424 0.7456 0.7422 0.7424 0.7433 0.7441 0.7469 Europe-Africa (€ per Sing$) 0.6234 0.6246 0.6223 0.6244 0.6249 0.6281 0.6304 0.6334 0.6319 0.6288
- 6. Latin America (R per Sing$) 4.218 4.307 4.1434 4.1762 4.1455 4.1013 4.1924 4.2886 4.2481 4.1742 Latin America Plant to North America (US$ per R) 0.1783 0.1723 0.1791 0.1778 0.1799 0.181 0.1771 0.1733 0.1752 0.1789 Europe-Africa (€ per R) 0.1478 0.145 0.1508 0.1495 0.1507
- 7. 0.1532 0.1504 0.1477 0.1487 0.1506 Asia-Pacific (Sing$ per R) 0.2371 0.2322 0.2413 0.2395 0.2412 0.2438 0.2385 0.2332 0.2354 0.2396 Exchange Rates Affecting Year 20 YEAR 19 YEAR 20 REVENUE IMPACT Exchange Rate Impact on Revenues Generated in: Europe-Africa (US$ per €) 1.1776
- 8. 1.1877 4.29% Asia-Pacific (US$ per Sing$) 0.7441 0.7469 1.88% Latin America (US$ per R) 0.1752 0.1789 10.56% Exchange Rate Impact on Cost of Pairs Shipped from: North America Plant to Europe-Africa (€ per US$) 0.8492 0.8420 -4.24% Asia-Pacific (Sing$ per US$) 1.3439 1.3389 -1.86% Latin America (R per US$) 5.7078 5.5897 -10.35% Europe-Africa Plant to North America (US$ per €) 1.1776 1.1877 4.29% Asia-Pacific (Sing$ per €) 1.5825 1.5903 2.46% Latin America (R per €) 6.7249
- 9. 6.6401 -6.30% Asia-Pacific Plant to North America (US$ per Sing$) 0.7441 0.7469 1.88% Europe-Africa (€ per Sing$) 0.6319 0.6288 -2.45% Latin America (R per Sing$) 4.2481 4.1742 -8.70% Latin America Plant to North America (US$ per R) 0.1752 0.1789 10.56% Europe-Africa (€ per R) 0.1487 0.1506 6.39% Asia-Pacific (Sing$ per R) 0.2354 0.2396 8.92% BSG SIMULATION ANA SOFIA ELJACH OSCAR GUTIERREZ PROFESSOR JUAN STEGMANN
- 10. BUSI-4900D-1 Mission Statement Our mission is to collaborate to develop technology, processes and quality products according to the demand of our customers and meet the needs of our staff in their economic welfare, in addition to striving to maintain a balance between processes and ecology. VISION Develop a leading company as well as products with the highest quality standards and passion for services to our customers harmoniously linking technology, development, personnel and ecology. VALUES In our company we have 8 values as a must for all workers Treat others as you would like to be treated Integrity Trust Honest and open communications
- 11. Gratitude Honesty, simplicity and doing something that has real value for you Passion OBJECTIVES Become the "world leader in the sports industry" in improving the working conditions of its suppliers and reducing the environmental impact of its business, for which it commits to improve the quality of information about its suppliers in the coming years and work in greater control. In addition, the group aims to develop and launch a training program in Human Resource Management Systems for its suppliers in China, Vietnam, Indonesia and Thailand; and review and improve communication channels with its employees to identify cases of breaches of labor standards, among other commitments. MARKET DESCRIPTION North America: This is one of the regions where we can sell our shoes with higher prices, because of the economical situation of most of the people.
- 12. LATIN AMERICAN MARKET This part of America is so different being just miles away from North America, good región to produce and set the factories, low cost salaries to employees and you can sell in medium-high prices. ASIAN-PACIFIC MARKET This is so far one of the best regions to put your principal factories because of the low production costs. Big industries have most of their manufacturing here. AFRICAN & EUROPEAN MARKET Europe is an excellent region to sell with high prices, people here pay more than in other regions because they have better quality in their economy. Africa could be a good place to set factories, unfortunately the salaries here are to easy to pay by big industries which is not incurring into CSR. PERFORMANCE
- 13. STRATEGIES The most important marketing strategy of us is undoubtedly the well-designed promotion plan. We spent profit on advertising to raise public awareness of the new product or the existing product that already has a market. In general, brand ambassadors are athletes who leave their mark on the minds of public opinion so that a person who practices some type of sport would like to own a product from us. They are also based on the recent technology of interactive digital advertising as part of the marketing strategy. Another strategy we had was to boost production to meet the demand. As a company, we were not delivering enough product on the market which was leaving us behind.
- 14. We had to work on overtime and full production to meet the customers needs which impacted positively on our KPI’s OUR LEARNINGS Definitely we learned much from the SIM, until now we had learned the theoretical part of what it is to run a company and what it implies, but once you get into detail all the operating costs, administration costs, marketing plans, sales, etc. Things get complicated It gave us a more accurate picture of what it means to start a business and do it internationally in all the different continents, we also realized that in each region the operation is very different due to the politics, economy and culture of each country. We experimented with the financial part and the sales, seeing how we were doing on the KPI’s was very interesting and that really gave us a lot of feedback on how things were going in the business. Group Power Point Discussion COLLAPSE Top of Form · A brief review of the financial performance of your company
- 15. during the time you and your co-managers have run the company. This review should consist of charts showing the following: . Trends in the company's annual total revenues . Trends in the company's annual earnings per share (EPS) . Trends in the company's annual return on equity investment (ROE) . Trends in the company's annual credit rating . Trends in the company's year-end stock price . Trends in the company's annual image rating The Performance Highlights report (accessible through your Decisions / Reports Program menu), includes a charting feature at the bottom of the report page. You can easily create a trend chart for each of the above six performance indicators and save each chart to a local storage device for insertion into a PowerPoint presentation or Word document. Double-click on the chart to download and (depending on the web browser you are using) you will be prompted to save to a PNG file. Once you have named and saved a picture file you can insert the picture into a PowerPoint slide or Word document using the Insert tab at the top of the MS Office program. If you wish to create additional performance graphs you may do so, but the above six performance measures tell an adequate story about your company's historical performance. · A slide describing your strategic vision for the company. · A slide that shows what performance targets for EPS, ROE, credit rating, and image rating you and your co-managers would set for each of the next two years (assuming the simulation were to continue). You may also want to indicate a stock price target as well. · A slide that sets forth your company's competitive strategy for the internet market in some detail and how that strategy has evolved over the years you have managed the company. You may need to have more than one slide here if your company's strategy for the internet market varies markedly from geographic region to geographic region.
- 16. · A slide that sets forth your company's competitive strategy for the wholesale market in some detail and how that strategy has evolved over the years. Again, more than one slide may be needed if your company's strategy for the wholesale market varies markedly from one geographic region to another, such that your company is pursuing a meaningfully different competitive strategy in some regions versus others. · A slide that sets forth your company's competitive strategy for the private-label market in some detail and how that strategy has evolved over the years you have managed the company. · A slide describing your company's production strategy (as concerns plant capacity and location, use of overtime, and work force compensation/training strategy). · A slide describing your company's finance strategy (as concerns dividends, use of debt versus equity, stock issues/repurchases, actions to achieve/maintain a strong credit rating, etc.) You should clearly describe your company's dividend policy during the period you have managed the company. Here, you should also set forth what sort of dividend increases, if any, you would likely consider paying out in the next two upcoming years (given the EPS targets you have established). · A slide showing (1) those companies you consider to be your strongest/closest competitors in the internet market as of the last year or two of the simulation, (2) those companies that are your strongest/closest competitors in the wholesale market, and (3) those companies that are your strongest/closest competitors in the private-label market. · One or more slides detailing the actions you would take to out-compete these close rivals in the next two years (assuming the simulation continues for several more years). Since the actions may differ between internet, wholesale, and private- label, you may well need more than one slide here. · A set of slides detailing the "lessons learned" about crafting a winning strategy and about what the managers of a company should or should not do for a company to be financially and
- 17. competitively successful in a head-to-head battle against shrewdly-managed rival companies. You should, of course, adjust the content of your presentation to conform to whatever topical outline that your instructor specifies. Thus, depending on what your instructor tells you about what items to address in your presentation, you may need to add slides covering other topics or delete coverage of some of the above suggested topics. Bottom of Form Zumbi and Palmares Importance of Slavery and Sugar Portuguese innovated the use of plantations for the cultivation of sugar on the Atlantic islands of Madeira and São Tomé off the coast of Africa Chattel Slavery: Plantation labor based on chattel slavery, a hereditary system that reduced humans to property with few rights By the 1550s – Brazil began to dominate the global supply of sugar for about one hundred years Introduction of sugar led to introduction of sizeable black population through the transatlantic slave trade in Brazil and other countries (about 4-5 million enslaved Africans were sent to Brazil); slave trade ended in 1850 and slavery abolished in 1888 Formation of quilombos (maroon societies of those who fled slavery) was just one form of resistance to the brutality of slavery
- 18. Brazil had the most maroon societies in the Americas Relationship between the Portuguese and the Dutch Portuguese and Dutch had a long history of commercial relations Dutch were important shippers of Brazilian products Amsterdam had long been a major market for sugar Iberian Union 1580 – King Sebastião I of Portugal dies (24 years old) Sebastião leaves behind no immediate heirs, resulting in a dynastic crisis Portuguese nobility and wealthy elite proclaim Phillip II of Spain as king of Portugal, leading to the Iberian Union (union of Portugal and Spain under the Spanish monarchy King Sebastião I Benefits of Iberian Union to Portuguese included: Greater access to Spanish markets in America for Portuguese merchants i.e., Portuguese slave traders received contracts to provide enslaved blacks to Spanish America Allowed Portuguese in Brazil to cross into points further west
- 19. Negative Impact of Iberian Union for Portuguese included: Spain had been in conflict with the Netherlands, and the difficulties between them intensified As the tensions between the Spanish and the Dutch increased, the Portuguese were forced to sever ties with the Dutch This escalated to open confrontation that, in the Americas, centered around control of the sugar business and the slave trade Dutch Attacks on Brazil Begin: Salvador Dutch invasions of Brazil marked the greatest political and military conflict of colonial Brazil 1604 – Dutch raided Salvador, then capital of Brazil 1609-1621 - Twelve Years’ Truce between Spain and the Low Countries 1621 - End of truce and creation of Dutch West India Company marked the beginning of concerted effort to occupy Portuguese America’s sugar regions and to control the slave supply Recapture of Bahia Dutch Attacks on Brazil Begin: Salvador, cont’d 1624 – Dutch invaders occupy Salvador and take the city in just over 24 hours; Dutch did not get past Salvador’s city limits 1625 – A coalition drove out the Dutch after a year of
- 20. occupation Recapture of Bahia Dutch Attacks on Brazil Continue: Pernambuco 1630 – Dutch attack Pernambuco, Brazil’s most productive sugar captaincy Eventually, Dutch conquered all of northeastern Brazil from south of the São Francisco River to São Luis in Maranhão (see map) Dutch also seized African slaving ports, realizing that a constant supply of enslaved blacks was essential for success Dutch maintain hold on northeast from until 1654 (1630-1654) The struggle with Palmares was a: (Cheney, p. 48) Class conflict: poor vs. wealthy Racial conflict: mostly black vs. white (interests) Cultural conflict: Two sets of irreconcilable values Social conflict: Two ways of organizing community Economic conflict: A collective economy vs. a monocultural cash-crop under oligarchic domination Political conflict: Portuguese subjects obedient to a king vs. former Portuguese subjects doing fine without the king “Palmares proved liberty possible, slavery unnecessary.” Palmares Timeline
- 21. 1597 First report of mocambos (maroon societies/quilombos) in hills of Pernambuco/ first accounts of attacks by quilombolas (those who live in quilombos) in Brazil 1602 First order to attack and eliminate Palmares 1630 Dutch invade the captaincy (Portuguese royal land grant territory) of Pernambuco 1644 First Dutch incursions into Palmares 1654 Dutch surrender Pernambuco
- 22. 1655 Portuguese attack Palmares twice 1661 and 1663 More forces are sent to attack Palmares 1677 First major victory against Palmares, led by Captain Fernão Carrilho Palmares Timeline, cont’d 1678 Palmares leader Ganga-Zumba and colonial leaders negotiate a peace treaty; Ganga-Zumba and followers relocate to Cucaú
- 23. 1679 Zumbi and the other mocambos in Palmares refuse to accept the treaty and remain in Palmares 1680 Ganga-Zumba killed (likely assassinated) and Cucaú is eliminated 1681 Zumbi is considered the main leader in Palmares 1683 Second incursion by Captain Carrilho, which is a major defeat 1684 Zumbi engages in offensive guerrilla warfare, attacking a settlement and raiding a fort 1685
- 24. King Pedro II of Portugal sends a letter to Zumbi requesting negotiation Palmares Timeline, cont’d 1687 Troops from São Paulo participate in attacks against Palmares 1687 Enslaved people in Pernambuco plot an armed revolt with the help of Palmaristas; authorities discover the plan and execute leaders 1692-1694 Main war between Palmaristas and troops from São Paulo; After much destruction, injury and death, many Palmaristas manage to escape, including Zumbi
- 25. 1695 Zumbi is caught and assassinated Zumbi in Brazilian Memory Upholds myth of racial democracy? OR Undermines myth of racial democracy? Bronze head of Zumbi in federal capital, Brasília “To remember the resistance of blacks in order to advance the struggle for a free society free of all forms of oppression”