
Recommended
More Related Content
Similar to 0-introduction-131107061553-phpapp01.pdf
Similar to 0-introduction-131107061553-phpapp01.pdf (20)
More from BagalanaSteven
More from BagalanaSteven (20)
Recently uploaded
Recently uploaded (20)
0-introduction-131107061553-phpapp01.pdf
- 1. BIOLOGY
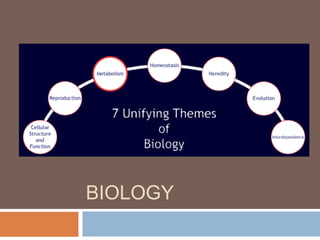
- 2. Themes of biology 1. Levels of organization 2. The cellular basis of life 3. Genetics 4. The correlation between structure and function 5. The interaction of organisms with their environment 6. Homeostasis 7. Evolution, unity, and diversity
- 3. 1. Levels of organization
- 4. 1. Levels of organization
- 5. 1. Levels of organization Emergent properties Characteristics not present at simpler levels of organization Holism An organism is more than the sum of their parts Reductionism By studying an organisms parts, you can understand it
- 6. 2. Cellular basis of life Cell theory All cells come from other cells All living things made of cells Classification of organisms Size – single or multicellular Complexity – eukaryotic or prokaryotic Energy use – autotroph and heterotroph
- 7. 3. Genetics Organisms pass on genetic information to their offspring via DNA Four different letters in DNA make organisms what they are Billions of these letters code for an organism
- 8. 4. Structure and function The structure of things are related to their function – form fits function Anatomy and physiology
- 9. 5. Ecology Organisms always interact with their environment Nutrient cycling Energy flow Human impact on the environment
- 10. 6. Homeostasis The ability of an organism to maintain its internal conditions Feedback mechanisms Positive feedback Negative feedback
- 11. 7. Evolution, unity, and diversity Evolution Change in frequency of alleles in a population over time Organisms share common ancestors Natural selection, “survival of the fittest,” drives evolution
- 12. 7. Evolution, unity, and diversity Diversity is enormous Taxonomy – scientific classification Kingdom-phylum- class-order-family- genus-species All organisms exhibit similarities in genetic code, cell structure, and metabolic
- 13. 8. Science as a process Inductive reasoning Use specifics to make general conclusion Deductive reasoning Use general idea to learn specifics
- 14. 8. Science as a process Testing hypotheses is the basis of science Propose an idea to a problem or question Scientific method A flexible outline to answer questions or solve problems Requires evidence The effect of gestational age on birth weight
- 15. 8. Science as a process Science continually incorporates new data to gain a better understanding of the world
- 16. Science as a process and technology Technology improves the ability to learn about many aspects of biology
- 18. Independent and dependent variables Independent variable What the scientist intentionally changes Dependent variable What is measured, or what changes in response to the independent
- 19. Control and experimental groups Both relate to the independent variable Control group What all other groups are compared to Usually the lowest, highest, or “normal” value Experimental groups All of the other values of the independent variable compared
- 20. Scientific title Should be descriptive enough to indicate what is going on in the experiment “The Effect of (IV) on (DV)”
- 21. Hypothesis Must be falsifiable More than an educated guess Can’t be “proven,” only rejected “If…then…”
- 22. Constants Factors that remain consistent throughout the experiment There should only be one independent variable in an experiment
- 23. GRAPHING
- 24. Graphs The purpose of a graph is to help visually depict data and trends in data There are many requirements to graph data properly
- 25. Requirements for graphing Scientific title Axis labels Regular intervals Variables on correct axes Choosing the right type of graph The effect of work experience on income
- 26. Requirements for graphing Variables on correct axes Independent variable on x axis Dependent variable on y axis
- 27. Choosing the right type of graph Pie chart Typically shows part, or percentage, of a whole
- 28. Choosing the right type of graph Scatter plot and line graphs Used to look at the relationship of one variable on another Usually requires an independent variable that is a number Can use a line of best fit
- 29. Choosing the right type of graph Bar graph Typically used when the independen t variable is not a number
- 30. Choosing the right type of graph Box and whisker graph Similar to a scatter plot or bar graph, but shows much more detail
- 31. Choosing the right type of graph
- 32. WRITING A LAB REPORT Using experimental design
- 33. Pre-lab
- 34. Overview
- 35. Introduction
- 36. Materials
- 37. Procedure
- 38. Data
- 39. Conclusion
- 40. Trials The more data you can collect, the better At a minimum, 30 trials per experimental group
- 42. Forming a null hypothesis Used because you don’t “prove” a hypothesis, but can reject one If you accept your null hypothesis, you would reject your original hypothesis
- 43. An overview of Chi-squared You try to evaluate how likely your results could be due to chance Requires two variables: O – observed data E – expected data
- 44. Levels of significance How sure you want to be that your results are not due to random chance
- 45. Degrees of freedom The number of possible outcomes or selections, minus 1
- 46. Example problem If you rolled 120 six- sided dice and you ended up with: 27 1’s 23 2’s 11 3’s 19 4’s 18 5’s 20 6’s And you want 95% confidence… would you reject or accept your null hypothesis?
- 47. Example problem If you rolled 120 six- sided dice and you ended up with: 27 1’s 25 2’s 11 3’s 19 4’s 18 5’s 20 6’s And you want 95% confidence… would you reject or accept your null hypothesis? Observed values – 27, 25, 11, 19, 18, 20
- 48. Example problem If you rolled 120 six- sided dice and you ended up with: 27 1’s 25 2’s 11 3’s 19 4’s 18 5’s 20 6’s And you want 95% confidence… would you reject or accept your null hypothesis? Expected values – 120/6 = 20
- 49. Example problem Observed values – 27, 25, 11, 19, 18, 20 Expected values – 120/6 = 20 (27-20)2+ 20 (25-20)2+ 20 (11-20)2+ 20 (19-20)2+ 20 (18-20)2+ 20 (20-20)2 20
- 50. Example problem Observed values – 27, 25, 11, 19, 18, 20 Expected values – 120/6 = 20 49+ 20 25+ 20 81+ 20 1 + 20 4 + 20 0 20 = 160 20 = 8
- 51. Example problem If you rolled 118 six- sided dice and you ended up with: 27 1’s 23 2’s 11 3’s 19 4’s 18 5’s 20 6’s And you want 95% confidence… would you reject or accept your null hypothesis? = 8