SlideShare a Scribd company logo
1 of 10
Download to read offline
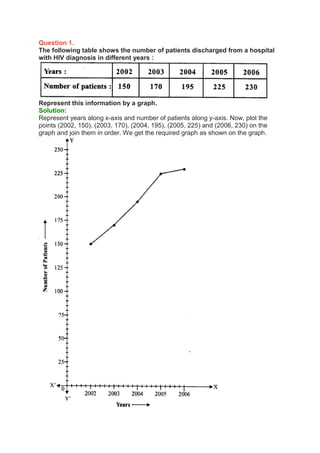
Question 1.
The following table shows the number of patients discharged from a hospital
with HIV diagnosis in different years :
Represent this information by a graph.
Solution:
Represent years along x-axis and number of patients along y-axis. Now, plot the
points (2002, 150), (2003, 170), (2004, 195), (2005, 225) and (2006, 230) on the
graph and join them in order. We get the required graph as shown on the graph.
Question 2.
The following table shows the amount of rice grown by a farmer in different
years :
Plot a graph to illustrate this information.
Solution:
We represent years along x-axis and rice (in quintals) along y-axis. Now we plot the
points (2000,200), (2001, 180), (2002,240), (2003,260), (2004,250), (2005,200) and
(2006,270) on the graph and join them in order as shown on the graph.
Question 3.
The following table gives the information regarding the number of persons
employed to a piece of work and time taken to complete the work:
Plot a graph of this information.
Solution:
We represent number of person along x-axis and time taken in day along y-axis.
Now plot the points (2,12), (4,6), (6,4) and (8, 3) on the graph and join them in order
as shown on the graph.
Question 4.
The following table gives the information regarding length of a side of a square
and its area :
Draw a graph to illustrate this information.
Solution:
We represent length of a side (in cm) along x-axis and Area of square (in cm2) along
the y-axis. Now plot the points (1,1), (2, 4), (3, 9), (4, 16) and (5, 25) on the graph
and join them in order. We get the required graph as shown on the graph.
Question 5.
The following table shows the sales of a commodity during the years 2000 to
2006.
Draw a graph of this information.
Solution:
We represent years on x-axis and sales (in lakh rupees) along y-axis. Now plot the
points
(2000, 1.5), (2001, 1.8), (2002, 2.4), (2003, 3.2), (2004, 5.4), (2005, 7.8) and (2006,
8.6) on the graph and join them in order we get the required graph as shown.
Question 6.
Draw the temperature-time graph in each of the following cases :
Solution:
(i) We represent time along x-axis and temperature (in °F) alongy-axis. Now plot the
points (7:00, 100), (9:00, 101), (11:00, 104), (13:00, 102), (15:00, 100), (17:00, 99),
(19:00, 100) and (21:00, 98) on the graph and join them in order to get the required
graph as shown on the graph.
(ii) We represent time along x-axis and temperature (in °F) along j-axis. Now plot the
points (8:00, 100), (i0:00, 101), (12:00, 104), (14:00, 103), (16:00, 99), (18:00,98),
(20:00,100) on the graph and join them in order to get the required graph as shown
on the graph.
Question 7.
Draw the velocity-time graph from the following data :
Solution:
We represent time (in hours) along x- axis and speed (in km/hr) along y-axis. Now
plot the points (7:00,30), (8:00,45), (9:00,60), (10:00, 50), (11:00, 70), (12:00, 50),
(13:00, 40) and (14:00,45) on the graph and join them in order to get the required
graph as shown.
Question 8.
The runs scored by a cricket team in first 15 overs are given below :
Draw the graph representing the above data in two different ways as a graph
and as a bar chart.
Solution:
We represent overs along.t-axis and runs along v-axis. Now plot the points (1,2), (II,
1), (III, 4), (IV, 2), (V, 6), (VI, 8), (VII, 10), (VIII, 21), (IX, 5), (X, 8), (XI, 3), (XII, 2),
(XIII, 6), (XIV, 8), (XV, 12) on the graph and join them to get the graph, as shown bar
graph of the given data is given below:
Question 9.
The runs scored by two teams A and B in first 10 overs are given below :
Draw a graph depicting the data, making the graphs on the same axes in each
case in two different ways as a graph and as a bar chart.
Solution:
We represent overs along x-axis and runs scored by team A and team B with
different types of lines along y-axis.
Plot the points for team A : (I, 2), (II, 1), (III,8), (IV, 9), (V, 4), (VI, 5), (VII, 6), (VIII,
10), (IX, 6) and (X, 2)
and for team B, the points will be : (I, 5), (II, 6), (III, 2), (IV, 10), (V, 5), (VI, 6), (VII, 3),
(VIII, 4), (IX, 8), (X, 10).
Then join them in order to get the required graph for team A and team B as shown.
Note : For team A ………
for team B …………

More Related Content

What's hot

The least square method
The least square methodThe least square method
The least square methodkevinlefol
 
0580 s08 qp_4
0580 s08 qp_40580 s08 qp_4
0580 s08 qp_4King Ali
 
Third level block 1 formal homework
Third level block 1 formal homeworkThird level block 1 formal homework
Third level block 1 formal homeworksjamaths
 
0580 w08 qp_04
0580 w08 qp_040580 w08 qp_04
0580 w08 qp_04King Ali
 
Final exam review sheet # 3 2015
Final exam review sheet # 3 2015Final exam review sheet # 3 2015
Final exam review sheet # 3 2015mlabuski
 
Mid module review
Mid module reviewMid module review
Mid module reviewmlabuski
 
Review guide end of mod 5
Review guide end of mod 5Review guide end of mod 5
Review guide end of mod 5Erik Tjersland
 
Final exam review sheet # 2 2015
Final exam review sheet # 2 2015Final exam review sheet # 2 2015
Final exam review sheet # 2 2015mlabuski
 
20 statistics(p1).
20   statistics(p1).20   statistics(p1).
20 statistics(p1).Shasha Wini
 
Mock cat solutions paper no 1
Mock cat solutions paper no 1Mock cat solutions paper no 1
Mock cat solutions paper no 1Vandan Kashyap
 
36252644 teknik-menjawab-percubaan-pmr-melaka-2010
36252644 teknik-menjawab-percubaan-pmr-melaka-201036252644 teknik-menjawab-percubaan-pmr-melaka-2010
36252644 teknik-menjawab-percubaan-pmr-melaka-2010nadarajan04
 
Final exam review sheet # 1 2015
Final exam review sheet # 1 2015Final exam review sheet # 1 2015
Final exam review sheet # 1 2015mlabuski
 
Mock cat questions paper no 1
Mock cat questions paper no 1Mock cat questions paper no 1
Mock cat questions paper no 1Vandan Kashyap
 
Maths: Order of Operations
Maths: Order of OperationsMaths: Order of Operations
Maths: Order of Operationsemmeline4
 
End of module 3 review
End of module 3 reviewEnd of module 3 review
End of module 3 reviewmlabuski
 
Collins international primary maths workbook 4
Collins international primary maths workbook 4Collins international primary maths workbook 4
Collins international primary maths workbook 4ssuser1e528d
 

What's hot (20)

The least square method
The least square methodThe least square method
The least square method
 
0580 s08 qp_4
0580 s08 qp_40580 s08 qp_4
0580 s08 qp_4
 
Third level block 1 formal homework
Third level block 1 formal homeworkThird level block 1 formal homework
Third level block 1 formal homework
 
0580 s12 qp_41
0580 s12 qp_410580 s12 qp_41
0580 s12 qp_41
 
E mec1101sem20405
E mec1101sem20405E mec1101sem20405
E mec1101sem20405
 
012 lesson 4
012 lesson 4012 lesson 4
012 lesson 4
 
0580 w08 qp_04
0580 w08 qp_040580 w08 qp_04
0580 w08 qp_04
 
Final exam review sheet # 3 2015
Final exam review sheet # 3 2015Final exam review sheet # 3 2015
Final exam review sheet # 3 2015
 
Mid module review
Mid module reviewMid module review
Mid module review
 
Review guide end of mod 5
Review guide end of mod 5Review guide end of mod 5
Review guide end of mod 5
 
Final exam review sheet # 2 2015
Final exam review sheet # 2 2015Final exam review sheet # 2 2015
Final exam review sheet # 2 2015
 
20 statistics(p1).
20   statistics(p1).20   statistics(p1).
20 statistics(p1).
 
Mock cat solutions paper no 1
Mock cat solutions paper no 1Mock cat solutions paper no 1
Mock cat solutions paper no 1
 
36252644 teknik-menjawab-percubaan-pmr-melaka-2010
36252644 teknik-menjawab-percubaan-pmr-melaka-201036252644 teknik-menjawab-percubaan-pmr-melaka-2010
36252644 teknik-menjawab-percubaan-pmr-melaka-2010
 
Final exam review sheet # 1 2015
Final exam review sheet # 1 2015Final exam review sheet # 1 2015
Final exam review sheet # 1 2015
 
Mock cat questions paper no 1
Mock cat questions paper no 1Mock cat questions paper no 1
Mock cat questions paper no 1
 
Maths: Order of Operations
Maths: Order of OperationsMaths: Order of Operations
Maths: Order of Operations
 
End of module 3 review
End of module 3 reviewEnd of module 3 review
End of module 3 review
 
Collins international primary maths workbook 4
Collins international primary maths workbook 4Collins international primary maths workbook 4
Collins international primary maths workbook 4
 
Ch 1 Review
Ch 1 ReviewCh 1 Review
Ch 1 Review
 

Similar to C27.2

Eb7 final exam 2014
Eb7 final exam  2014Eb7 final exam  2014
Eb7 final exam 2014zeinabze
 
Csec maths paper2_2010-2016
Csec maths paper2_2010-2016Csec maths paper2_2010-2016
Csec maths paper2_2010-2016Carl Davis
 
CSEC Mathematics January 2012 Past Paper
CSEC Mathematics January 2012 Past PaperCSEC Mathematics January 2012 Past Paper
CSEC Mathematics January 2012 Past PaperNicole Blackman
 
2010 assessment review_homework_1-4-done
2010 assessment review_homework_1-4-done2010 assessment review_homework_1-4-done
2010 assessment review_homework_1-4-donejendailey
 
Examen du premier trimester g7 2015
Examen du premier trimester g7 2015Examen du premier trimester g7 2015
Examen du premier trimester g7 2015zeinabze
 
Exam of first semster g9 2015
Exam of first semster   g9 2015Exam of first semster   g9 2015
Exam of first semster g9 2015zeinabze
 
Tracking a Ball
Tracking a BallTracking a Ball
Tracking a Ballkellykoch
 
Final exam g7 2015
Final exam  g7 2015Final exam  g7 2015
Final exam g7 2015zeinabze
 
15.) Line L in the figure below is parallel to the line y=.docx
15.) Line L in the figure below is parallel to the line y=.docx15.) Line L in the figure below is parallel to the line y=.docx
15.) Line L in the figure below is parallel to the line y=.docxherminaprocter
 
Final exam g8 2015
Final exam g8 2015Final exam g8 2015
Final exam g8 2015zeinabze
 
0580_s08_qp_4
0580_s08_qp_40580_s08_qp_4
0580_s08_qp_4King Ali
 
Geothermal-Energy Science 9 - Junior Hihg School
Geothermal-Energy Science 9 - Junior Hihg SchoolGeothermal-Energy Science 9 - Junior Hihg School
Geothermal-Energy Science 9 - Junior Hihg SchoolHenryViernes
 
357402584 242463893-pt3-trial-mathematics-pdf
357402584 242463893-pt3-trial-mathematics-pdf357402584 242463893-pt3-trial-mathematics-pdf
357402584 242463893-pt3-trial-mathematics-pdfSyahidaZamri1
 
Introductory Algebra Lesson 11 – Linear Functions, Part 2 .docx
Introductory Algebra   Lesson 11 – Linear Functions, Part 2 .docxIntroductory Algebra   Lesson 11 – Linear Functions, Part 2 .docx
Introductory Algebra Lesson 11 – Linear Functions, Part 2 .docxmariuse18nolet
 
icse-10-march13-maths-question-paper-with-solution-2023.pdf
icse-10-march13-maths-question-paper-with-solution-2023.pdficse-10-march13-maths-question-paper-with-solution-2023.pdf
icse-10-march13-maths-question-paper-with-solution-2023.pdfvani311954
 

Similar to C27.2 (20)

Eb7 final exam 2014
Eb7 final exam  2014Eb7 final exam  2014
Eb7 final exam 2014
 
Csec maths paper2_2010-2016
Csec maths paper2_2010-2016Csec maths paper2_2010-2016
Csec maths paper2_2010-2016
 
CSEC Mathematics January 2012 Past Paper
CSEC Mathematics January 2012 Past PaperCSEC Mathematics January 2012 Past Paper
CSEC Mathematics January 2012 Past Paper
 
Coordinate geometry
Coordinate geometryCoordinate geometry
Coordinate geometry
 
2010 assessment review_homework_1-4-done
2010 assessment review_homework_1-4-done2010 assessment review_homework_1-4-done
2010 assessment review_homework_1-4-done
 
Examen du premier trimester g7 2015
Examen du premier trimester g7 2015Examen du premier trimester g7 2015
Examen du premier trimester g7 2015
 
Exam of first semster g9 2015
Exam of first semster   g9 2015Exam of first semster   g9 2015
Exam of first semster g9 2015
 
0580 s08 qp_4
0580 s08 qp_40580 s08 qp_4
0580 s08 qp_4
 
Tracking a Ball
Tracking a BallTracking a Ball
Tracking a Ball
 
Final exam g7 2015
Final exam  g7 2015Final exam  g7 2015
Final exam g7 2015
 
15.) Line L in the figure below is parallel to the line y=.docx
15.) Line L in the figure below is parallel to the line y=.docx15.) Line L in the figure below is parallel to the line y=.docx
15.) Line L in the figure below is parallel to the line y=.docx
 
Final exam g8 2015
Final exam g8 2015Final exam g8 2015
Final exam g8 2015
 
0580_s08_qp_4
0580_s08_qp_40580_s08_qp_4
0580_s08_qp_4
 
Geothermal-Energy Science 9 - Junior Hihg School
Geothermal-Energy Science 9 - Junior Hihg SchoolGeothermal-Energy Science 9 - Junior Hihg School
Geothermal-Energy Science 9 - Junior Hihg School
 
357402584 242463893-pt3-trial-mathematics-pdf
357402584 242463893-pt3-trial-mathematics-pdf357402584 242463893-pt3-trial-mathematics-pdf
357402584 242463893-pt3-trial-mathematics-pdf
 
Set1
Set1Set1
Set1
 
space-time diagram(final)
space-time diagram(final)space-time diagram(final)
space-time diagram(final)
 
Module 2
Module 2Module 2
Module 2
 
Introductory Algebra Lesson 11 – Linear Functions, Part 2 .docx
Introductory Algebra   Lesson 11 – Linear Functions, Part 2 .docxIntroductory Algebra   Lesson 11 – Linear Functions, Part 2 .docx
Introductory Algebra Lesson 11 – Linear Functions, Part 2 .docx
 
icse-10-march13-maths-question-paper-with-solution-2023.pdf
icse-10-march13-maths-question-paper-with-solution-2023.pdficse-10-march13-maths-question-paper-with-solution-2023.pdf
icse-10-march13-maths-question-paper-with-solution-2023.pdf
 

More from BGEsp1

C13 13.3
C13 13.3C13 13.3
C13 13.3BGEsp1
 
C14 14.4
C14 14.4C14 14.4
C14 14.4BGEsp1
 
C21 21.3
C21 21.3C21 21.3
C21 21.3BGEsp1
 
C17 17.3
C17 17.3C17 17.3
C17 17.3BGEsp1
 
C18 18.1
C18 18.1C18 18.1
C18 18.1BGEsp1
 
C21 21.2
C21 21.2C21 21.2
C21 21.2BGEsp1
 
C17 17.1
C17 17.1C17 17.1
C17 17.1BGEsp1
 
C19 19.1
C19 19.1C19 19.1
C19 19.1BGEsp1
 
C14 14.3
C14 14.3C14 14.3
C14 14.3BGEsp1
 
C22 22.2
C22 22.2C22 22.2
C22 22.2BGEsp1
 
C17 17.2
C17 17.2C17 17.2
C17 17.2BGEsp1
 
C20 20.1
C20 20.1C20 20.1
C20 20.1BGEsp1
 
C21 21.1
C21 21.1C21 21.1
C21 21.1BGEsp1
 
C12 12.2
C12 12.2C12 12.2
C12 12.2BGEsp1
 
C18 18.3
C18 18.3C18 18.3
C18 18.3BGEsp1
 
C20 20.2
C20 20.2C20 20.2
C20 20.2BGEsp1
 

More from BGEsp1 (20)

C13 13.3
C13 13.3C13 13.3
C13 13.3
 
C14 14.4
C14 14.4C14 14.4
C14 14.4
 
C26
C26C26
C26
 
C21 21.3
C21 21.3C21 21.3
C21 21.3
 
C17 17.3
C17 17.3C17 17.3
C17 17.3
 
C18 18.1
C18 18.1C18 18.1
C18 18.1
 
C21 21.2
C21 21.2C21 21.2
C21 21.2
 
C17 17.1
C17 17.1C17 17.1
C17 17.1
 
C16
C16C16
C16
 
C15
C15C15
C15
 
C19 19.1
C19 19.1C19 19.1
C19 19.1
 
C14 14.3
C14 14.3C14 14.3
C14 14.3
 
C22 22.2
C22 22.2C22 22.2
C22 22.2
 
C17 17.2
C17 17.2C17 17.2
C17 17.2
 
C20 20.1
C20 20.1C20 20.1
C20 20.1
 
C21 21.1
C21 21.1C21 21.1
C21 21.1
 
C23.1
C23.1C23.1
C23.1
 
C12 12.2
C12 12.2C12 12.2
C12 12.2
 
C18 18.3
C18 18.3C18 18.3
C18 18.3
 
C20 20.2
C20 20.2C20 20.2
C20 20.2
 

Recently uploaded

Unit-IV; Professional Sales Representative (PSR).pptx
Unit-IV; Professional Sales Representative (PSR).pptxUnit-IV; Professional Sales Representative (PSR).pptx
Unit-IV; Professional Sales Representative (PSR).pptxVishalSingh1417
 
Measures of Dispersion and Variability: Range, QD, AD and SD
Measures of Dispersion and Variability: Range, QD, AD and SDMeasures of Dispersion and Variability: Range, QD, AD and SD
Measures of Dispersion and Variability: Range, QD, AD and SDThiyagu K
 
Measures of Central Tendency: Mean, Median and Mode
Measures of Central Tendency: Mean, Median and ModeMeasures of Central Tendency: Mean, Median and Mode
Measures of Central Tendency: Mean, Median and ModeThiyagu K
 
Presentation by Andreas Schleicher Tackling the School Absenteeism Crisis 30 ...
Presentation by Andreas Schleicher Tackling the School Absenteeism Crisis 30 ...Presentation by Andreas Schleicher Tackling the School Absenteeism Crisis 30 ...
Presentation by Andreas Schleicher Tackling the School Absenteeism Crisis 30 ...EduSkills OECD
 
Application orientated numerical on hev.ppt
Application orientated numerical on hev.pptApplication orientated numerical on hev.ppt
Application orientated numerical on hev.pptRamjanShidvankar
 
How to Give a Domain for a Field in Odoo 17
How to Give a Domain for a Field in Odoo 17How to Give a Domain for a Field in Odoo 17
How to Give a Domain for a Field in Odoo 17Celine George
 
Sports & Fitness Value Added Course FY..
Sports & Fitness Value Added Course FY..Sports & Fitness Value Added Course FY..
Sports & Fitness Value Added Course FY..Disha Kariya
 
Class 11th Physics NEET formula sheet pdf
Class 11th Physics NEET formula sheet pdfClass 11th Physics NEET formula sheet pdf
Class 11th Physics NEET formula sheet pdfAyushMahapatra5
 
PROCESS RECORDING FORMAT.docx
PROCESS      RECORDING        FORMAT.docxPROCESS      RECORDING        FORMAT.docx
PROCESS RECORDING FORMAT.docxPoojaSen20
 
microwave assisted reaction. General introduction
microwave assisted reaction. General introductionmicrowave assisted reaction. General introduction
microwave assisted reaction. General introductionMaksud Ahmed
 
Accessible design: Minimum effort, maximum impact
Accessible design: Minimum effort, maximum impactAccessible design: Minimum effort, maximum impact
Accessible design: Minimum effort, maximum impactdawncurless
 
psychiatric nursing HISTORY COLLECTION .docx
psychiatric  nursing HISTORY  COLLECTION  .docxpsychiatric  nursing HISTORY  COLLECTION  .docx
psychiatric nursing HISTORY COLLECTION .docxPoojaSen20
 
Key note speaker Neum_Admir Softic_ENG.pdf
Key note speaker Neum_Admir Softic_ENG.pdfKey note speaker Neum_Admir Softic_ENG.pdf
Key note speaker Neum_Admir Softic_ENG.pdfAdmir Softic
 
Nutritional Needs Presentation - HLTH 104
Nutritional Needs Presentation - HLTH 104Nutritional Needs Presentation - HLTH 104
Nutritional Needs Presentation - HLTH 104misteraugie
 
This PowerPoint helps students to consider the concept of infinity.
This PowerPoint helps students to consider the concept of infinity.This PowerPoint helps students to consider the concept of infinity.
This PowerPoint helps students to consider the concept of infinity.christianmathematics
 

Recently uploaded (20)

Mehran University Newsletter Vol-X, Issue-I, 2024
Mehran University Newsletter Vol-X, Issue-I, 2024Mehran University Newsletter Vol-X, Issue-I, 2024
Mehran University Newsletter Vol-X, Issue-I, 2024
 
Unit-IV; Professional Sales Representative (PSR).pptx
Unit-IV; Professional Sales Representative (PSR).pptxUnit-IV; Professional Sales Representative (PSR).pptx
Unit-IV; Professional Sales Representative (PSR).pptx
 
Measures of Dispersion and Variability: Range, QD, AD and SD
Measures of Dispersion and Variability: Range, QD, AD and SDMeasures of Dispersion and Variability: Range, QD, AD and SD
Measures of Dispersion and Variability: Range, QD, AD and SD
 
Measures of Central Tendency: Mean, Median and Mode
Measures of Central Tendency: Mean, Median and ModeMeasures of Central Tendency: Mean, Median and Mode
Measures of Central Tendency: Mean, Median and Mode
 
Presentation by Andreas Schleicher Tackling the School Absenteeism Crisis 30 ...
Presentation by Andreas Schleicher Tackling the School Absenteeism Crisis 30 ...Presentation by Andreas Schleicher Tackling the School Absenteeism Crisis 30 ...
Presentation by Andreas Schleicher Tackling the School Absenteeism Crisis 30 ...
 
Advance Mobile Application Development class 07
Advance Mobile Application Development class 07Advance Mobile Application Development class 07
Advance Mobile Application Development class 07
 
Application orientated numerical on hev.ppt
Application orientated numerical on hev.pptApplication orientated numerical on hev.ppt
Application orientated numerical on hev.ppt
 
How to Give a Domain for a Field in Odoo 17
How to Give a Domain for a Field in Odoo 17How to Give a Domain for a Field in Odoo 17
How to Give a Domain for a Field in Odoo 17
 
Sports & Fitness Value Added Course FY..
Sports & Fitness Value Added Course FY..Sports & Fitness Value Added Course FY..
Sports & Fitness Value Added Course FY..
 
Código Creativo y Arte de Software | Unidad 1
Código Creativo y Arte de Software | Unidad 1Código Creativo y Arte de Software | Unidad 1
Código Creativo y Arte de Software | Unidad 1
 
Class 11th Physics NEET formula sheet pdf
Class 11th Physics NEET formula sheet pdfClass 11th Physics NEET formula sheet pdf
Class 11th Physics NEET formula sheet pdf
 
PROCESS RECORDING FORMAT.docx
PROCESS      RECORDING        FORMAT.docxPROCESS      RECORDING        FORMAT.docx
PROCESS RECORDING FORMAT.docx
 
microwave assisted reaction. General introduction
microwave assisted reaction. General introductionmicrowave assisted reaction. General introduction
microwave assisted reaction. General introduction
 
Mattingly "AI & Prompt Design: The Basics of Prompt Design"
Mattingly "AI & Prompt Design: The Basics of Prompt Design"Mattingly "AI & Prompt Design: The Basics of Prompt Design"
Mattingly "AI & Prompt Design: The Basics of Prompt Design"
 
Accessible design: Minimum effort, maximum impact
Accessible design: Minimum effort, maximum impactAccessible design: Minimum effort, maximum impact
Accessible design: Minimum effort, maximum impact
 
psychiatric nursing HISTORY COLLECTION .docx
psychiatric  nursing HISTORY  COLLECTION  .docxpsychiatric  nursing HISTORY  COLLECTION  .docx
psychiatric nursing HISTORY COLLECTION .docx
 
INDIA QUIZ 2024 RLAC DELHI UNIVERSITY.pptx
INDIA QUIZ 2024 RLAC DELHI UNIVERSITY.pptxINDIA QUIZ 2024 RLAC DELHI UNIVERSITY.pptx
INDIA QUIZ 2024 RLAC DELHI UNIVERSITY.pptx
 
Key note speaker Neum_Admir Softic_ENG.pdf
Key note speaker Neum_Admir Softic_ENG.pdfKey note speaker Neum_Admir Softic_ENG.pdf
Key note speaker Neum_Admir Softic_ENG.pdf
 
Nutritional Needs Presentation - HLTH 104
Nutritional Needs Presentation - HLTH 104Nutritional Needs Presentation - HLTH 104
Nutritional Needs Presentation - HLTH 104
 
This PowerPoint helps students to consider the concept of infinity.
This PowerPoint helps students to consider the concept of infinity.This PowerPoint helps students to consider the concept of infinity.
This PowerPoint helps students to consider the concept of infinity.
 

C27.2

  • 1. Question 1. The following table shows the number of patients discharged from a hospital with HIV diagnosis in different years : Represent this information by a graph. Solution: Represent years along x-axis and number of patients along y-axis. Now, plot the points (2002, 150), (2003, 170), (2004, 195), (2005, 225) and (2006, 230) on the graph and join them in order. We get the required graph as shown on the graph.
  • 2. Question 2. The following table shows the amount of rice grown by a farmer in different years : Plot a graph to illustrate this information. Solution: We represent years along x-axis and rice (in quintals) along y-axis. Now we plot the points (2000,200), (2001, 180), (2002,240), (2003,260), (2004,250), (2005,200) and (2006,270) on the graph and join them in order as shown on the graph. Question 3. The following table gives the information regarding the number of persons employed to a piece of work and time taken to complete the work:
  • 3. Plot a graph of this information. Solution: We represent number of person along x-axis and time taken in day along y-axis. Now plot the points (2,12), (4,6), (6,4) and (8, 3) on the graph and join them in order as shown on the graph. Question 4. The following table gives the information regarding length of a side of a square and its area : Draw a graph to illustrate this information. Solution: We represent length of a side (in cm) along x-axis and Area of square (in cm2) along the y-axis. Now plot the points (1,1), (2, 4), (3, 9), (4, 16) and (5, 25) on the graph
  • 4. and join them in order. We get the required graph as shown on the graph. Question 5. The following table shows the sales of a commodity during the years 2000 to 2006. Draw a graph of this information. Solution: We represent years on x-axis and sales (in lakh rupees) along y-axis. Now plot the points (2000, 1.5), (2001, 1.8), (2002, 2.4), (2003, 3.2), (2004, 5.4), (2005, 7.8) and (2006,
  • 5. 8.6) on the graph and join them in order we get the required graph as shown. Question 6. Draw the temperature-time graph in each of the following cases : Solution: (i) We represent time along x-axis and temperature (in °F) alongy-axis. Now plot the points (7:00, 100), (9:00, 101), (11:00, 104), (13:00, 102), (15:00, 100), (17:00, 99), (19:00, 100) and (21:00, 98) on the graph and join them in order to get the required graph as shown on the graph.
  • 6. (ii) We represent time along x-axis and temperature (in °F) along j-axis. Now plot the points (8:00, 100), (i0:00, 101), (12:00, 104), (14:00, 103), (16:00, 99), (18:00,98), (20:00,100) on the graph and join them in order to get the required graph as shown
  • 7. on the graph. Question 7. Draw the velocity-time graph from the following data : Solution: We represent time (in hours) along x- axis and speed (in km/hr) along y-axis. Now plot the points (7:00,30), (8:00,45), (9:00,60), (10:00, 50), (11:00, 70), (12:00, 50), (13:00, 40) and (14:00,45) on the graph and join them in order to get the required
  • 8. graph as shown. Question 8. The runs scored by a cricket team in first 15 overs are given below : Draw the graph representing the above data in two different ways as a graph and as a bar chart. Solution: We represent overs along.t-axis and runs along v-axis. Now plot the points (1,2), (II, 1), (III, 4), (IV, 2), (V, 6), (VI, 8), (VII, 10), (VIII, 21), (IX, 5), (X, 8), (XI, 3), (XII, 2), (XIII, 6), (XIV, 8), (XV, 12) on the graph and join them to get the graph, as shown bar graph of the given data is given below:
  • 9. Question 9. The runs scored by two teams A and B in first 10 overs are given below : Draw a graph depicting the data, making the graphs on the same axes in each case in two different ways as a graph and as a bar chart. Solution: We represent overs along x-axis and runs scored by team A and team B with different types of lines along y-axis. Plot the points for team A : (I, 2), (II, 1), (III,8), (IV, 9), (V, 4), (VI, 5), (VII, 6), (VIII, 10), (IX, 6) and (X, 2) and for team B, the points will be : (I, 5), (II, 6), (III, 2), (IV, 10), (V, 5), (VI, 6), (VII, 3), (VIII, 4), (IX, 8), (X, 10). Then join them in order to get the required graph for team A and team B as shown. Note : For team A ………
  • 10. for team B …………