1. 20. Statistics
PAPER 1
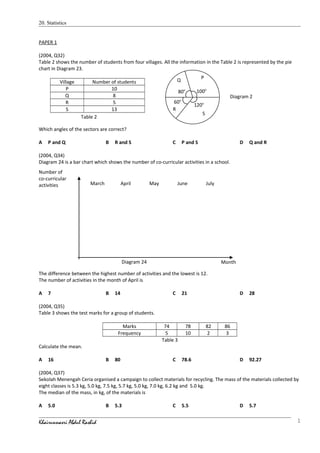
(2004, Q32)
Table 2 shows the number of students from four villages. All the information in the Table 2 is represented by the pie
chart in Diagram 23.
Village Number of students
P 10
Q 8
R 5
S 13
Which angles of the sectors are correct?
A P and Q B R and S C P and S D Q and R
(2004, Q34)
Diagram 24 is a bar chart which shows the number of co-curricular activities in a school.
The difference between the highest number of activities and the lowest is 12.
The number of activities in the month of April is
A 7 B 14 C 21 D 28
(2004, Q35)
Table 3 shows the test marks for a group of students.
Marks 74 78 82 86
Frequency 5 10 2 3
Table 3
Calculate the mean.
A 16 B 80 C 78.6 D 92.27
(2004, Q37)
Sekolah Menengah Ceria organised a campaign to collect materials for recycling. The mass of the materials collected by
eight classes is 5.3 kg, 5.0 kg, 7.5 kg, 5.7 kg, 5.0 kg, 7.0 kg, 6.2 kg and 5.0 kg.
The median of the mass, in kg, of the materials is
A 5.0 B 5.3 C 5.5 D 5.7
Khairunnasri Abdul Rashid 1
R
S
Q P
60o
80o
100o
120o
Diagram 2
Table 2
Number of
co-curricular
activities March April May June July
MonthDiagram 24
2. 20. Statistics
(2005, Q26)
Table 1 shows the number of tins collected by a group of students in a recycle campaign.
Number of tins 10 15 20 25 30
Frequency 3 6 5 4 2
Table 1
Calculate the mean number of tins collected by a student.
A 15 B 16 C 19 D 24
(2005, Q32)
Table 2 shows the number of goals scored by a football team in a league competition.
Number of goals 0 1 2 3 4 5
Frequency 1 3 7 x 5 4
Table 2
The mode of the number of goals scored by the team is 2.
Find a possible value of x.
A 6 B 7 C 8 D 9
(2005, Q34)
Table 3 shows the number of books read by a group of pupils in a week.
Number of books 1 2 3 4 5
Number of pupils 3 0 1 5 6
Table 3
The median for the data is
A 1 B 3 C 4 D 5
(2005, Q36)
Diagram 23 is a bar chart which shows the number of pupils in SMK Baginda who scored
grade A in all the subjects taken in the PMR examinations for three consecutive years.
0
2
4
6
8
1 0
1 2
1 4
1 6
1 8
2 0 0 1 2 0 0 2 2 0 0 3
G i r l s
B o y s
N u m b e r o f p u p i l s
Y e a r
Khairunnasri Abdul Rashid 2
Diagram 23
Calculate the difference between the
total number of boys and the total
number of girls over
the three years.
A 2
B 4
C 6
D 10
3. 20. Statistics
(2006, Q32)
Table 2 shows the scores for a group of pupils in a game.
score 1 2 3 4 5
Number of pupils 4 11 5 3 2
Table 2
Calculate the percentage number of pupils who obtain scores more than the mode score.
A 40 B 60 C 80 D 84
(2006, Q33)
Table 3 shows the number of book marks made by a group of pupils.
Number of book marks 10 11 12 13 14
Number of pupils 7 5 2 3 3
Table 3
Calculate the mean number of book marks made by a pupil.
A 10 B 10.5 C 11 D 11.5
(2006, Q34)
Diagram 22 is a pictograph showing the number of cakes sold in three months.
January
February
March
April
Diagram 22
The price of one cake is RM18. The total sale for those four months is RM2 250.
Calculate the number of cakes sold in April
A 25 B 35 C 115 D 125
(2006, Q35)
Diagram 23 is a pie chart showing the favourite colours of 162 pupils.
Khairunnasri Abdul Rashid 3
Represents 10 cakes
1200
800
1000
White
Black
Blue
Red
Diagram 23
Calculate the difference between the number of
pupils whose favourite colour is blue and the
number of pupils whose favourite colour is red.
A 9
B 18
C 27
D 63
4. 20. Statistics
(2007, Q35)
Diagram 23 is a pie chart showing the number of members in three clubs.
(2007, Q36)
Table 3 is a frequency table showing the match statistics for Pantai Rangers football team.
The team receives 3 points for a win, 1 point for a draw and 0 point for a loss.
Result Frequency
Win 16
Draw 14
Loss 10
Which of the following statements is true about the match statistics?
A
5
2
of the matches end with a win
B 40% of the matches end with a loss
C The total points obtained by Pantai Rangers team is 72
D The ratio of wins to draws is 7 : 8
(2007, Q37)
Diagram 24 shows the distribution of a student’s quiz marks.
5 3 2 4 3 2 p 3 5 4
Diagram 24
The mode is 3.
Find a possible value of p.
A 2 B 4 C 5 D 6
(2007, Q38)
Table 4 shows the student’s scores in a game.
Score 0 1 2 3 4 5
Frequency 3 6 4 1 3 2
The median score is
A 4 B 3 C 2 D 1
Khairunnasri Abdul Rashid 4
▪ Diagram 23
yo
2yo
150o
Judo
Karate
Taekwando
Table 4
Table 3
The Karate club has 300 members.
How many members are in the Taekwando club?
A 70
B 140
C 210
D 280
5. 20. Statistics
(2008, Q33)
Diagram 21 is a bar chart showing the number of new vehicles registered over four days.
Numberofvehicles
Monday Tuesday Wednesday Thursday Day
Diagram 21
The total number of new vehicles registered on Wednesday and Thursday is 56.
Calculate the total number of new vehicles registered on Monday and Tuesday.
A 52 B 60 C 64 D 68
(2008, Q34)
Table 2 shows the number of books read by a group of students from May to August.
Month May June July August
Number of books resd 1350 1600 1550 1500
Table 2
Based on the data in Table 2, which of the following statements is not true?
A. The difference between the highest and the lowest number of books read in a month is 150.
B. The mean number of books read for a month over this four month period is 1500.
C. The total number of books read after June is 3 050.
D. The number of books read in August is equivalent to 25% of the total number of books read over
the four month period.
(2008, Q35)
Diagram 22 is a pie chart showing how 72 students travel to school.
Khairunnasri Abdul Rashid 5
•
40
o
200
000
0o
Diagram 22
Walking
Bicycle
Car
Bus
Calculate the difference between the number of students who
walk and the number of students who go by bus.
A 24
B 32
C 34
D 46
6. 20. Statistics
(2008, Q36)
Diagram 23 is a pictogram showing the number of students with birthdays from July until December.
July
August
September
October
November
December
Diagram 23
The total number of students is 120. Calculate the number of students with birthdays after September.
A 20 B 55 C 65 D 85
(2008, Q37)
The mean mass of 25 boxing club members is 60 kg. A member with a mass of 84 kg leaves the club.
Calculate the mean mass, in kg, of the remaining members.
A 56.64 B 59.00 C 60.96 D 72.00
(2009, Q33)
(2009, Q34)
Bedroom
Bilik tidur
Reading room
Bilik bacaan
Kitchen
Dapur
Bathroom
Bilik air
Khairunnasri Abdul Rashid 6
Others
30
20
10
0
40
Indian
Chinese
Malay
Race
Numberofprefects
•
•
•
•
Diagram is a line graph showing the number of prefects in a school
according to race.
It is given that 22 of the prefect are girls. What is the fraction of boy
prefects in the group?
A.
20
9
B.
20
11
C.
40
11
D.
40
29
D
Represent 50 tiles
Diagram is a pictogram showing the number of tiles use in a
house. The number of tiles for the kitchen is not shown.
A total of 850 tiles are used for the four rooms.
Calculate the difference between the number of tiles used in the
bedroom and in the kitchen.
A 150
B 200
C 250
D 300
7. 20. Statistics
(2009, Q35)
Table shows the pocket money of a group of students.
Pocket money (RM) 1.00 2.00 3.00 4.00 5.00
Frequency 7 4 6 2 1
Find the median.
A RM1.00 B RM2.00 C RM2.30 D RM3.00
(2009, Q36)
Numberofstudent
(2009, Q37)
The mean age of Encik Ahmad, Puan Fatimah and their three children is 31 years. The mean age of their three children
is 19 years. Calculate the mean age of Encik Ahmad and Puan Fatimah.
A 44 years B 49 years C 50 years D 68 years
(2009, Q38)
Plants Number
of plants
Chrysanthemum
Kekwa
14
Orchid
Orkid
18
Rose
Mawar
16
Cactus
Kaktus
12
(2010, Q35)
Table shows the number of goals scored by a football team in a series of matches.
Jadual menunjukkan bilangan jaringan gol bagi sebuah pasukan bola sepak dalam satu siri perlawanan.
Number of goals scored
Bilangan jaringan gol
0 1 2 3 4
Frequency
Kekerapan
4 4 5 x 3
The mode of the number of goals scored is 3. Find a possible value of x.
Mod bagi bilangan jaringan gol itu ialah 3. Cari satu nilai yang mungkin bagi x.
Khairunnasri Abdul Rashid 7
Sports houses
LekiuLekirJebatTuah
Girls
Boys
Diagram is a bar chart showing the number of boys and girls
in four sports houses in a school. Which statement is correct
based on this bar chart?
A – The total number of girls is more than the total
number of boys.
B – Two sports houses have more girls than boys.
C – Three sports houses have more boys than girls.
D – Only one sport house has an equal number of boys
and girls.
•Cactus
Rose
Orchid
Chrysanthemum
yo
Table shows the number of plants thet Mastura planted
in her garden.
All the information in the table is represented by the pie
chart.
Calculate the value of y.
A 48
B 80
C 96
D 108
8. 20. Statistics
A 3 B 4 C 5 D 6
(2010, Q36)
Diagram is a bar chart which shows the number of students from five schools P, Q, R, S and T attending a motivation
course.
Rajah ialah carta palang yang menunjukkan bilangan murid daripada lima buah sekolah P, Q, R, S dan T yang telah
menghadiri suatu kursus motivasi.
P Q R S T
The total number of boys attending the course is 100. Calculate the total number of girls attending the course.
Jumlah bilangan murid lelaki yang menghadiri kursus itu ialah 100 orang. Hitung jumlah bilangan murid perempuan
yang menghadiri kursus itu.
A 25 B 45 C 125 D 225
(2010, Q37)
Diagram is a line graph which shows the number of cars sold for the first five months in a particular year.
Rajah ialah graf garis yang menunjukkan bilangan kereta yang dijual bagi lima bulan pertama dalam suatu tahun
tertentu.
Find the mean number of cars sold in a month over the five months.
Cari min bilangan kereta yang dijual dalam sebulan dalam tempoh lima bulan tersebut.
A 8 B 10 C 14 D 20
Khairunnasri Abdul Rashid 8
Number of students
Bilangan murid
School
Sekolah
Girls
Perempuan
Boys
Lelaki
Month
Bulan
16
14
12
10
8
6
4
2
0
May
Mei
April
April
March
Mac
February
Februari
January
Januari
•
•
•
•
•
9. 20. Statistics
(2010, Q38)
Diagram is a pie chart which shows the proportion of money allocated to five schools.
Rajah ialah carta pai yang menunjukkan kadar peruntukan wang untuk lima buah sekolah.
Khairunnasri Abdul Rashid 9
65o
85o
SMK
Putri
SMK
Johan
SMK
Kota
SMK
Bahagia
SMK Damai
The total amount of money allocated to SMK Bahagia and SMK Putri is RM1800.
Calculate the total amount of money allocated to the five schools.
Jumlah wang yang diperuntukkan kepada SMK Bahagia dan SMK Putri ialah RM1800.
Hitung jumlah wang yang diperuntukkan kepada lima buah sekolah tersebut.
A RM 2700
B RM 3600
C RM 5400
D RM 9000
10. 20. Statistics
(2010, Q38)
Diagram is a pie chart which shows the proportion of money allocated to five schools.
Rajah ialah carta pai yang menunjukkan kadar peruntukan wang untuk lima buah sekolah.
Khairunnasri Abdul Rashid 9
65o
85o
SMK
Putri
SMK
Johan
SMK
Kota
SMK
Bahagia
SMK Damai
The total amount of money allocated to SMK Bahagia and SMK Putri is RM1800.
Calculate the total amount of money allocated to the five schools.
Jumlah wang yang diperuntukkan kepada SMK Bahagia dan SMK Putri ialah RM1800.
Hitung jumlah wang yang diperuntukkan kepada lima buah sekolah tersebut.
A RM 2700
B RM 3600
C RM 5400
D RM 9000