
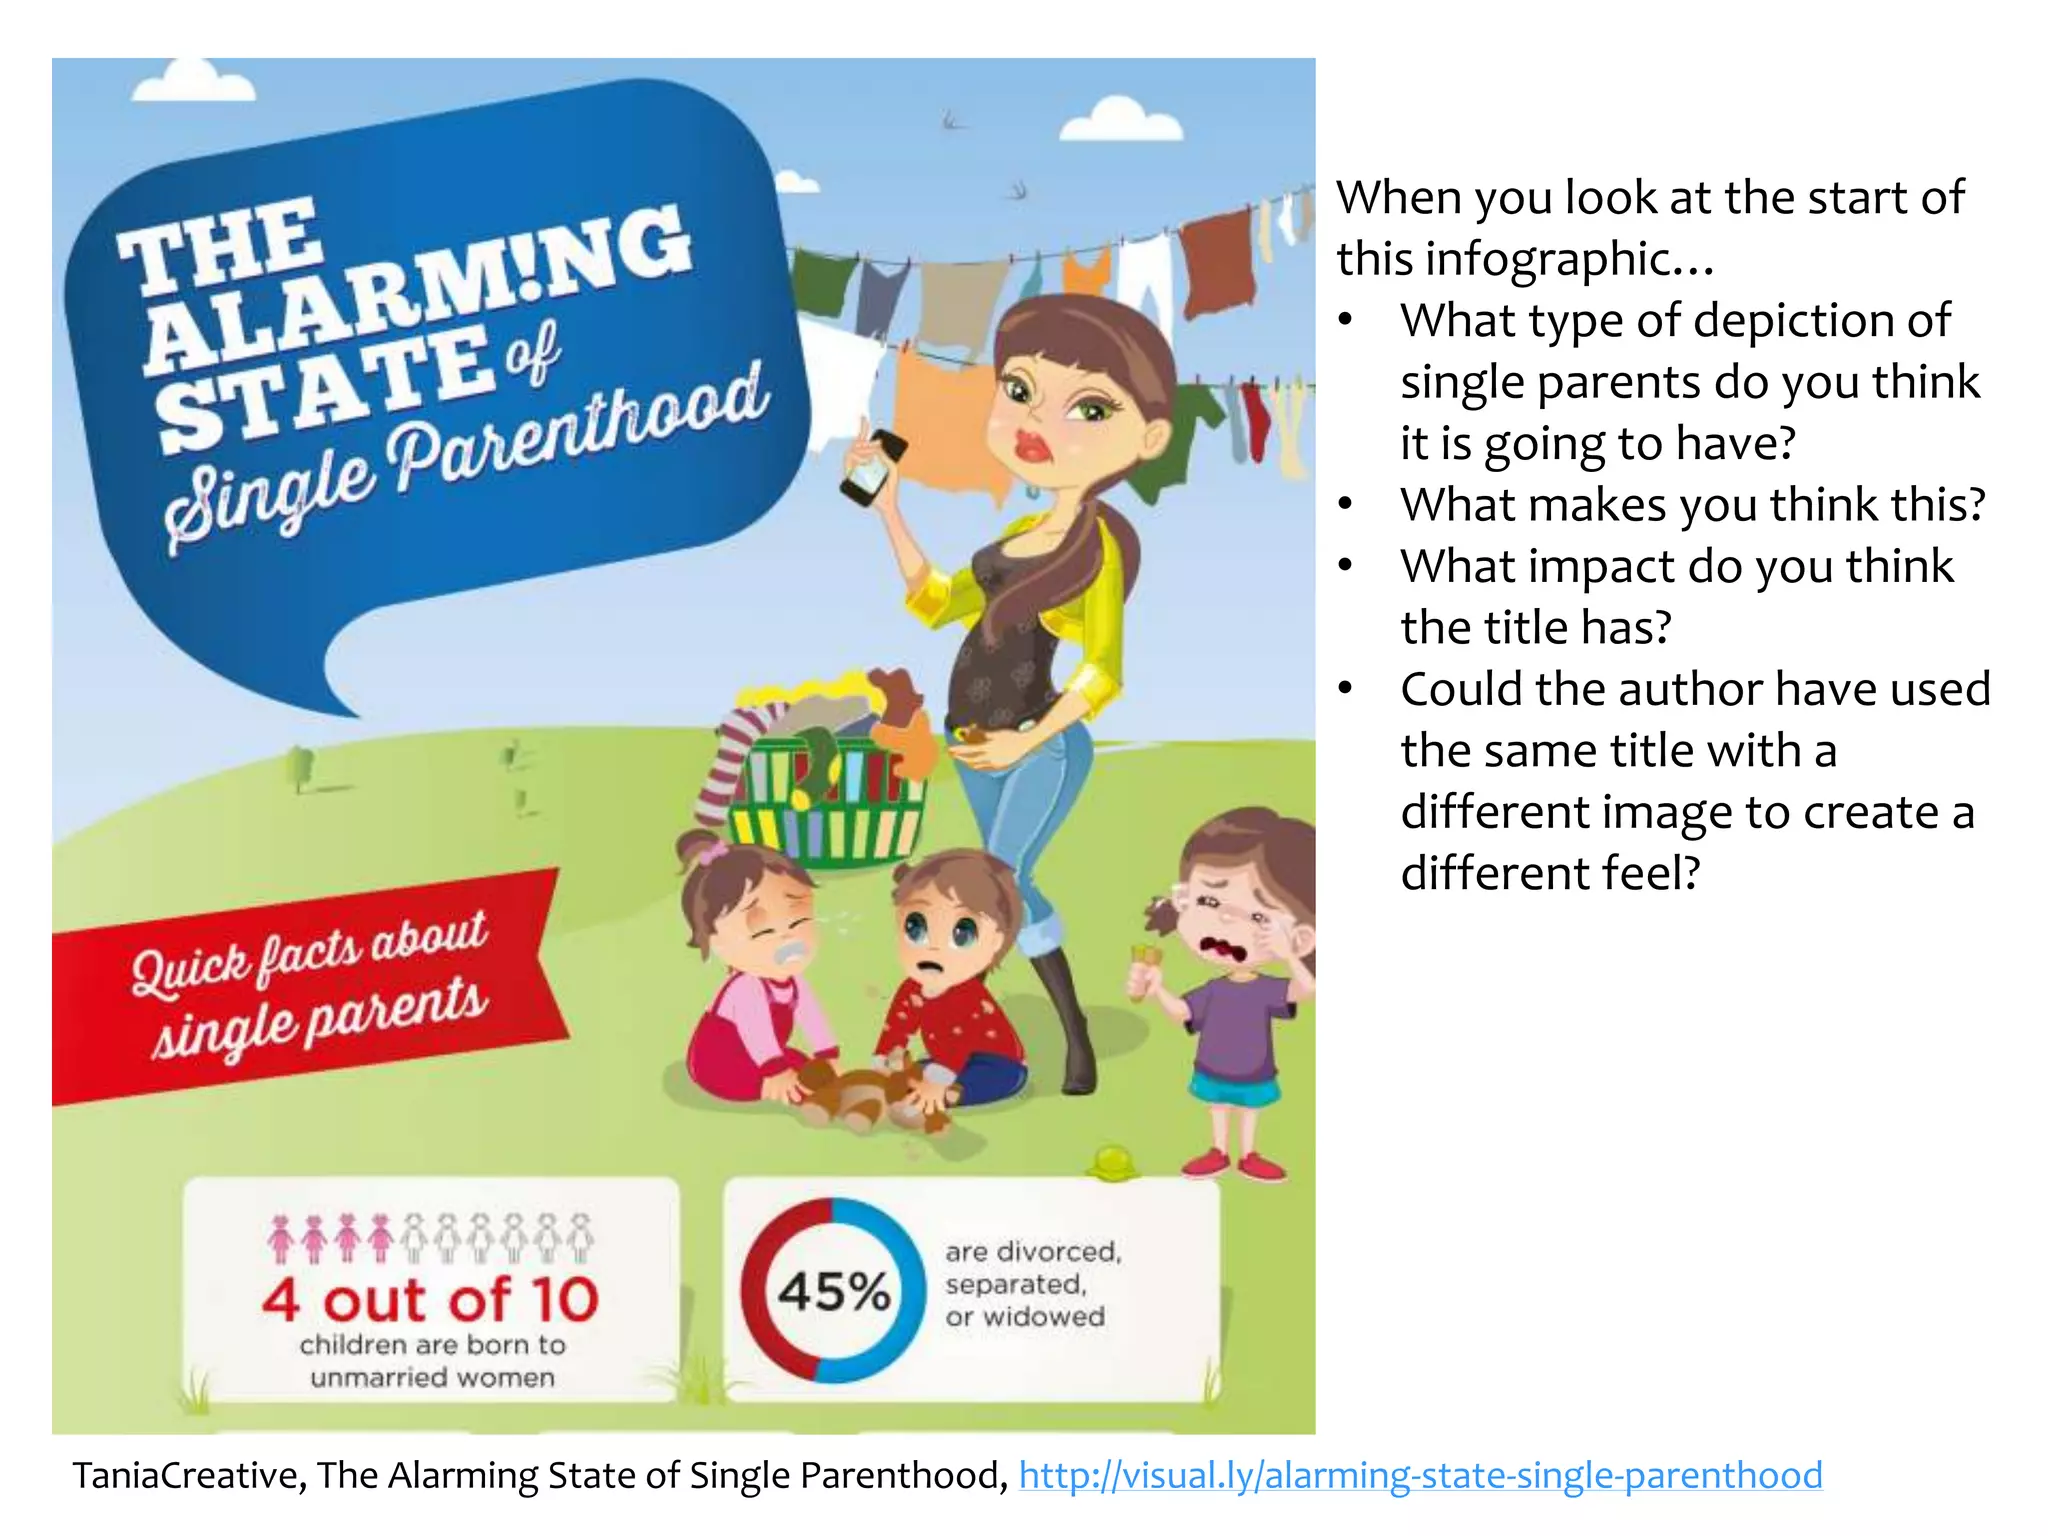

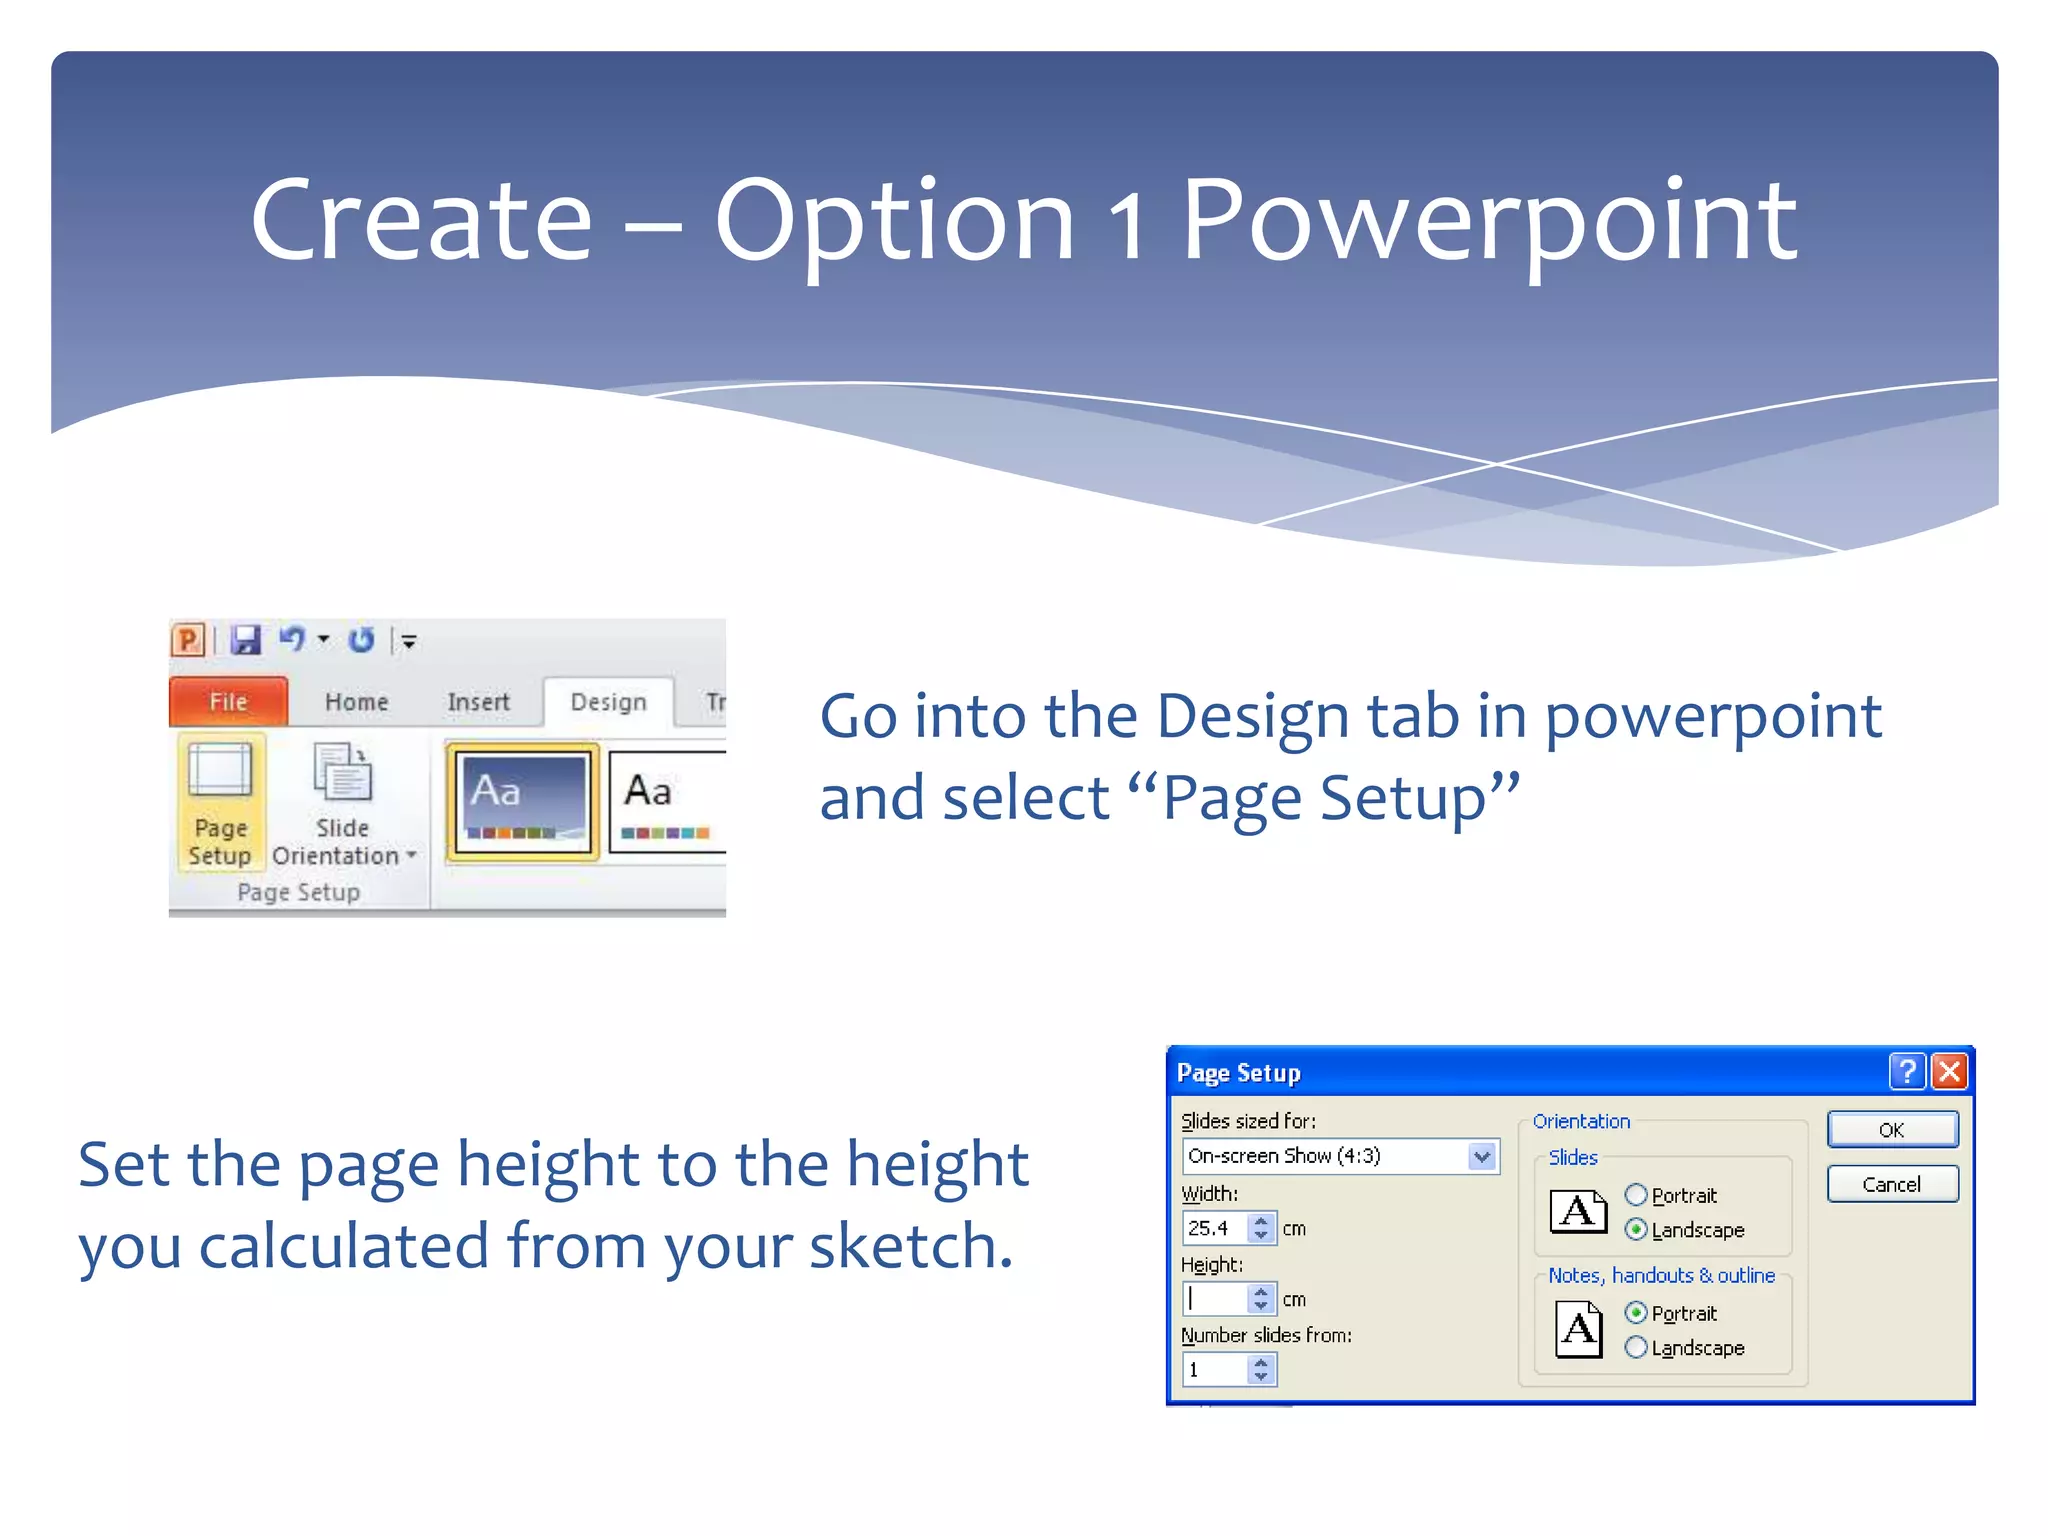
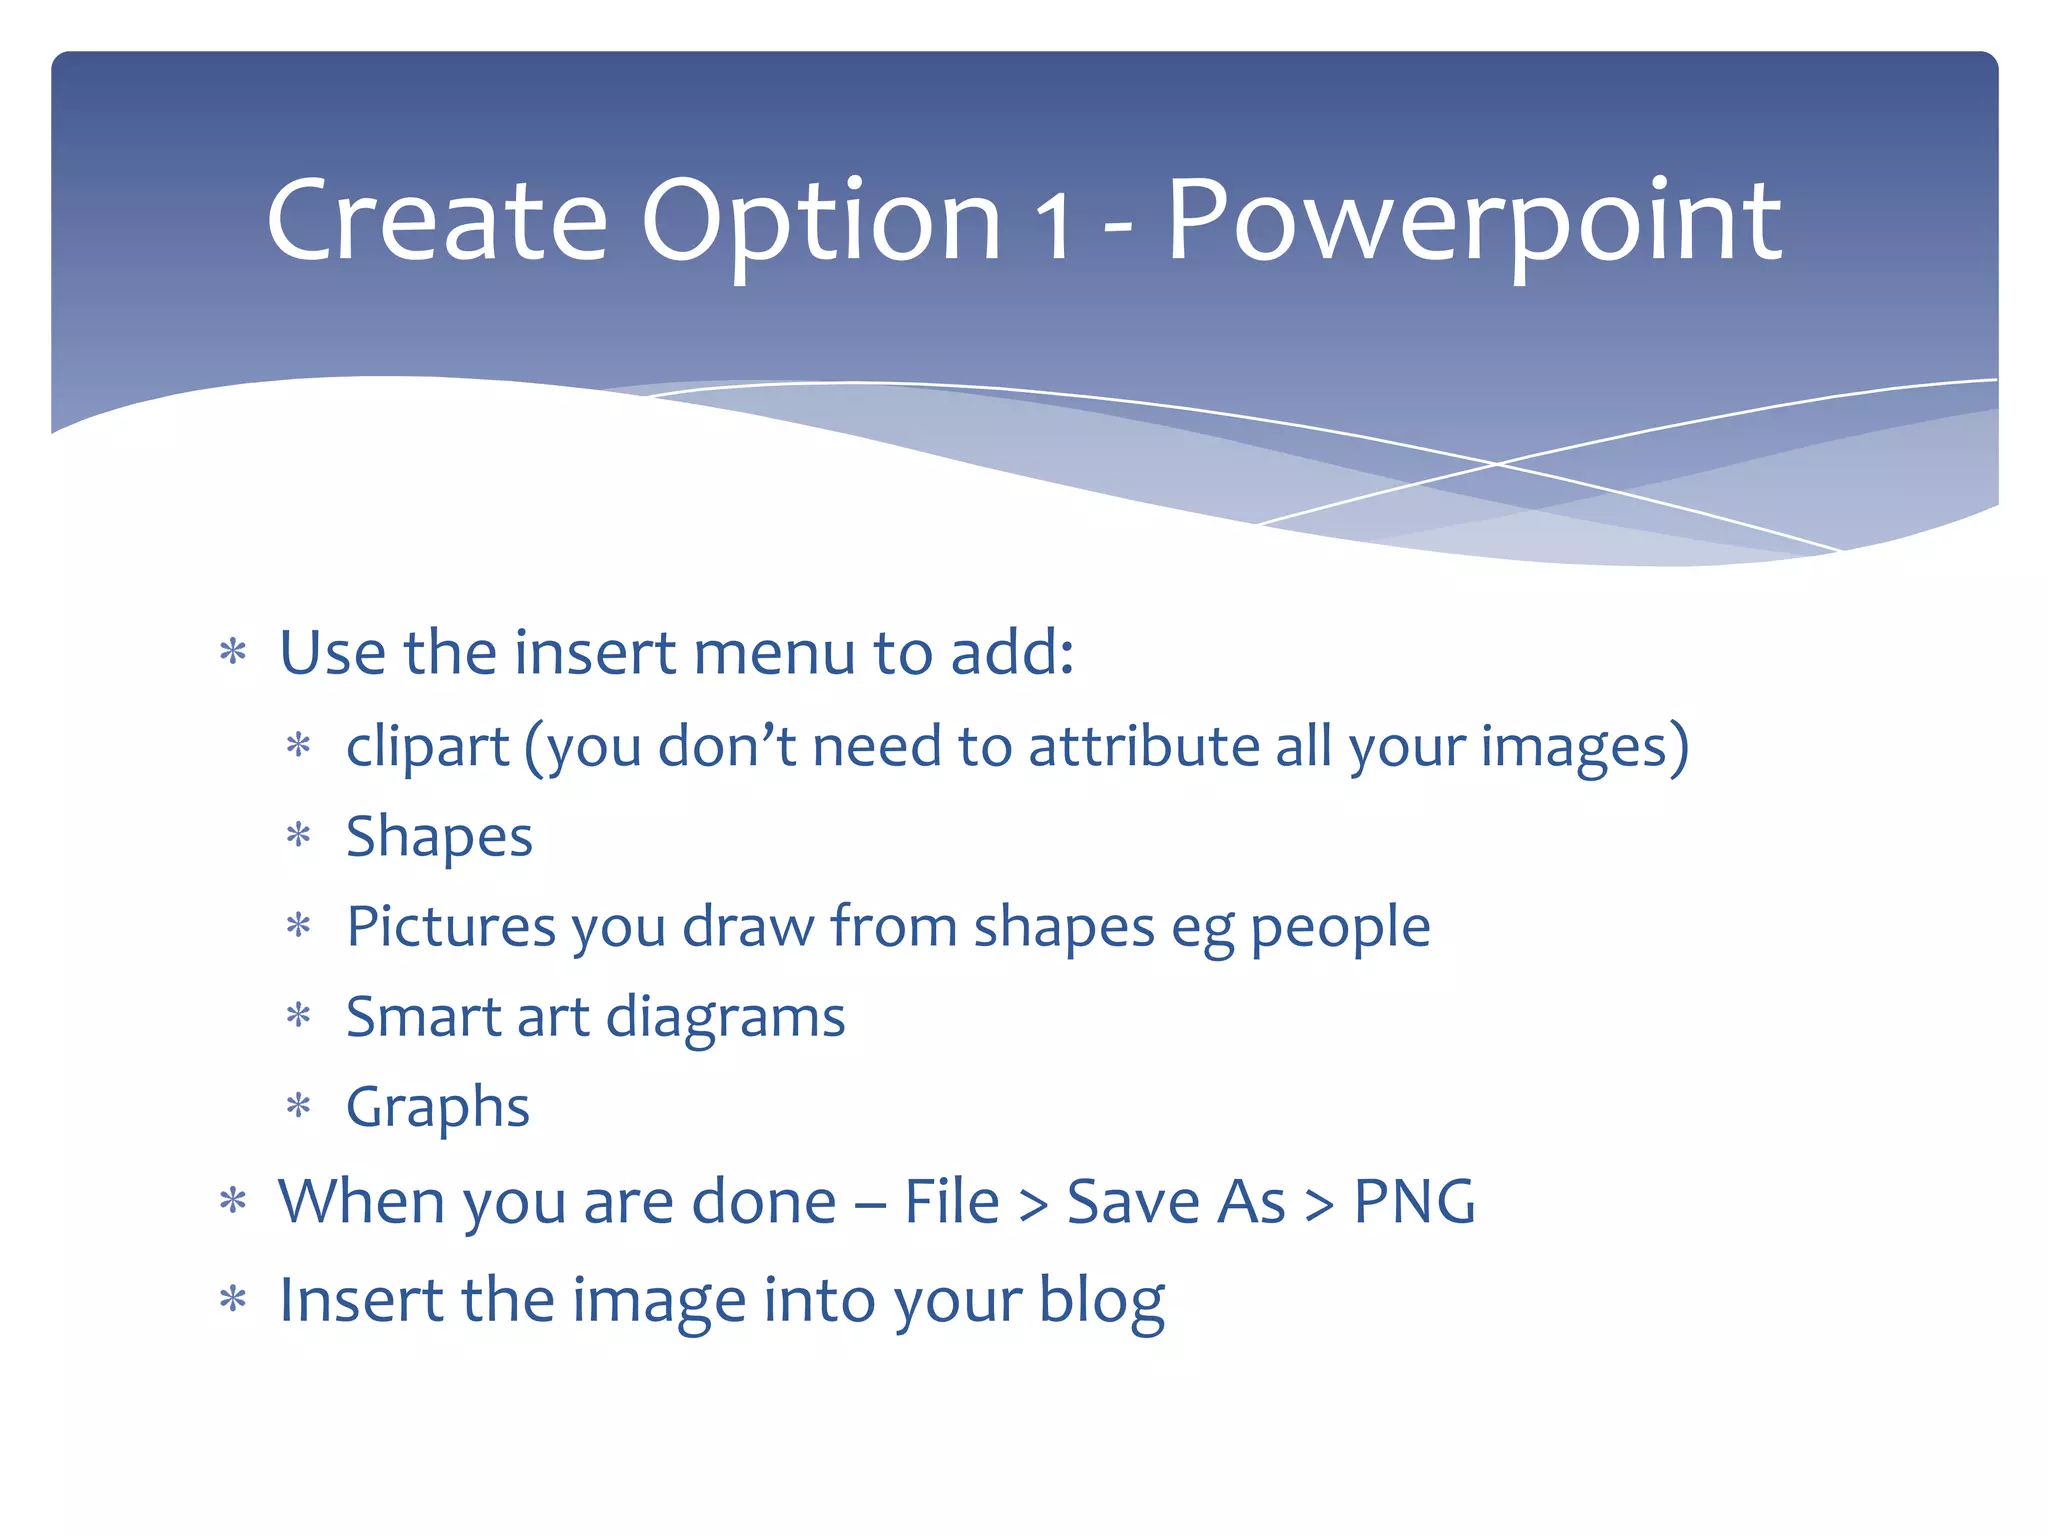
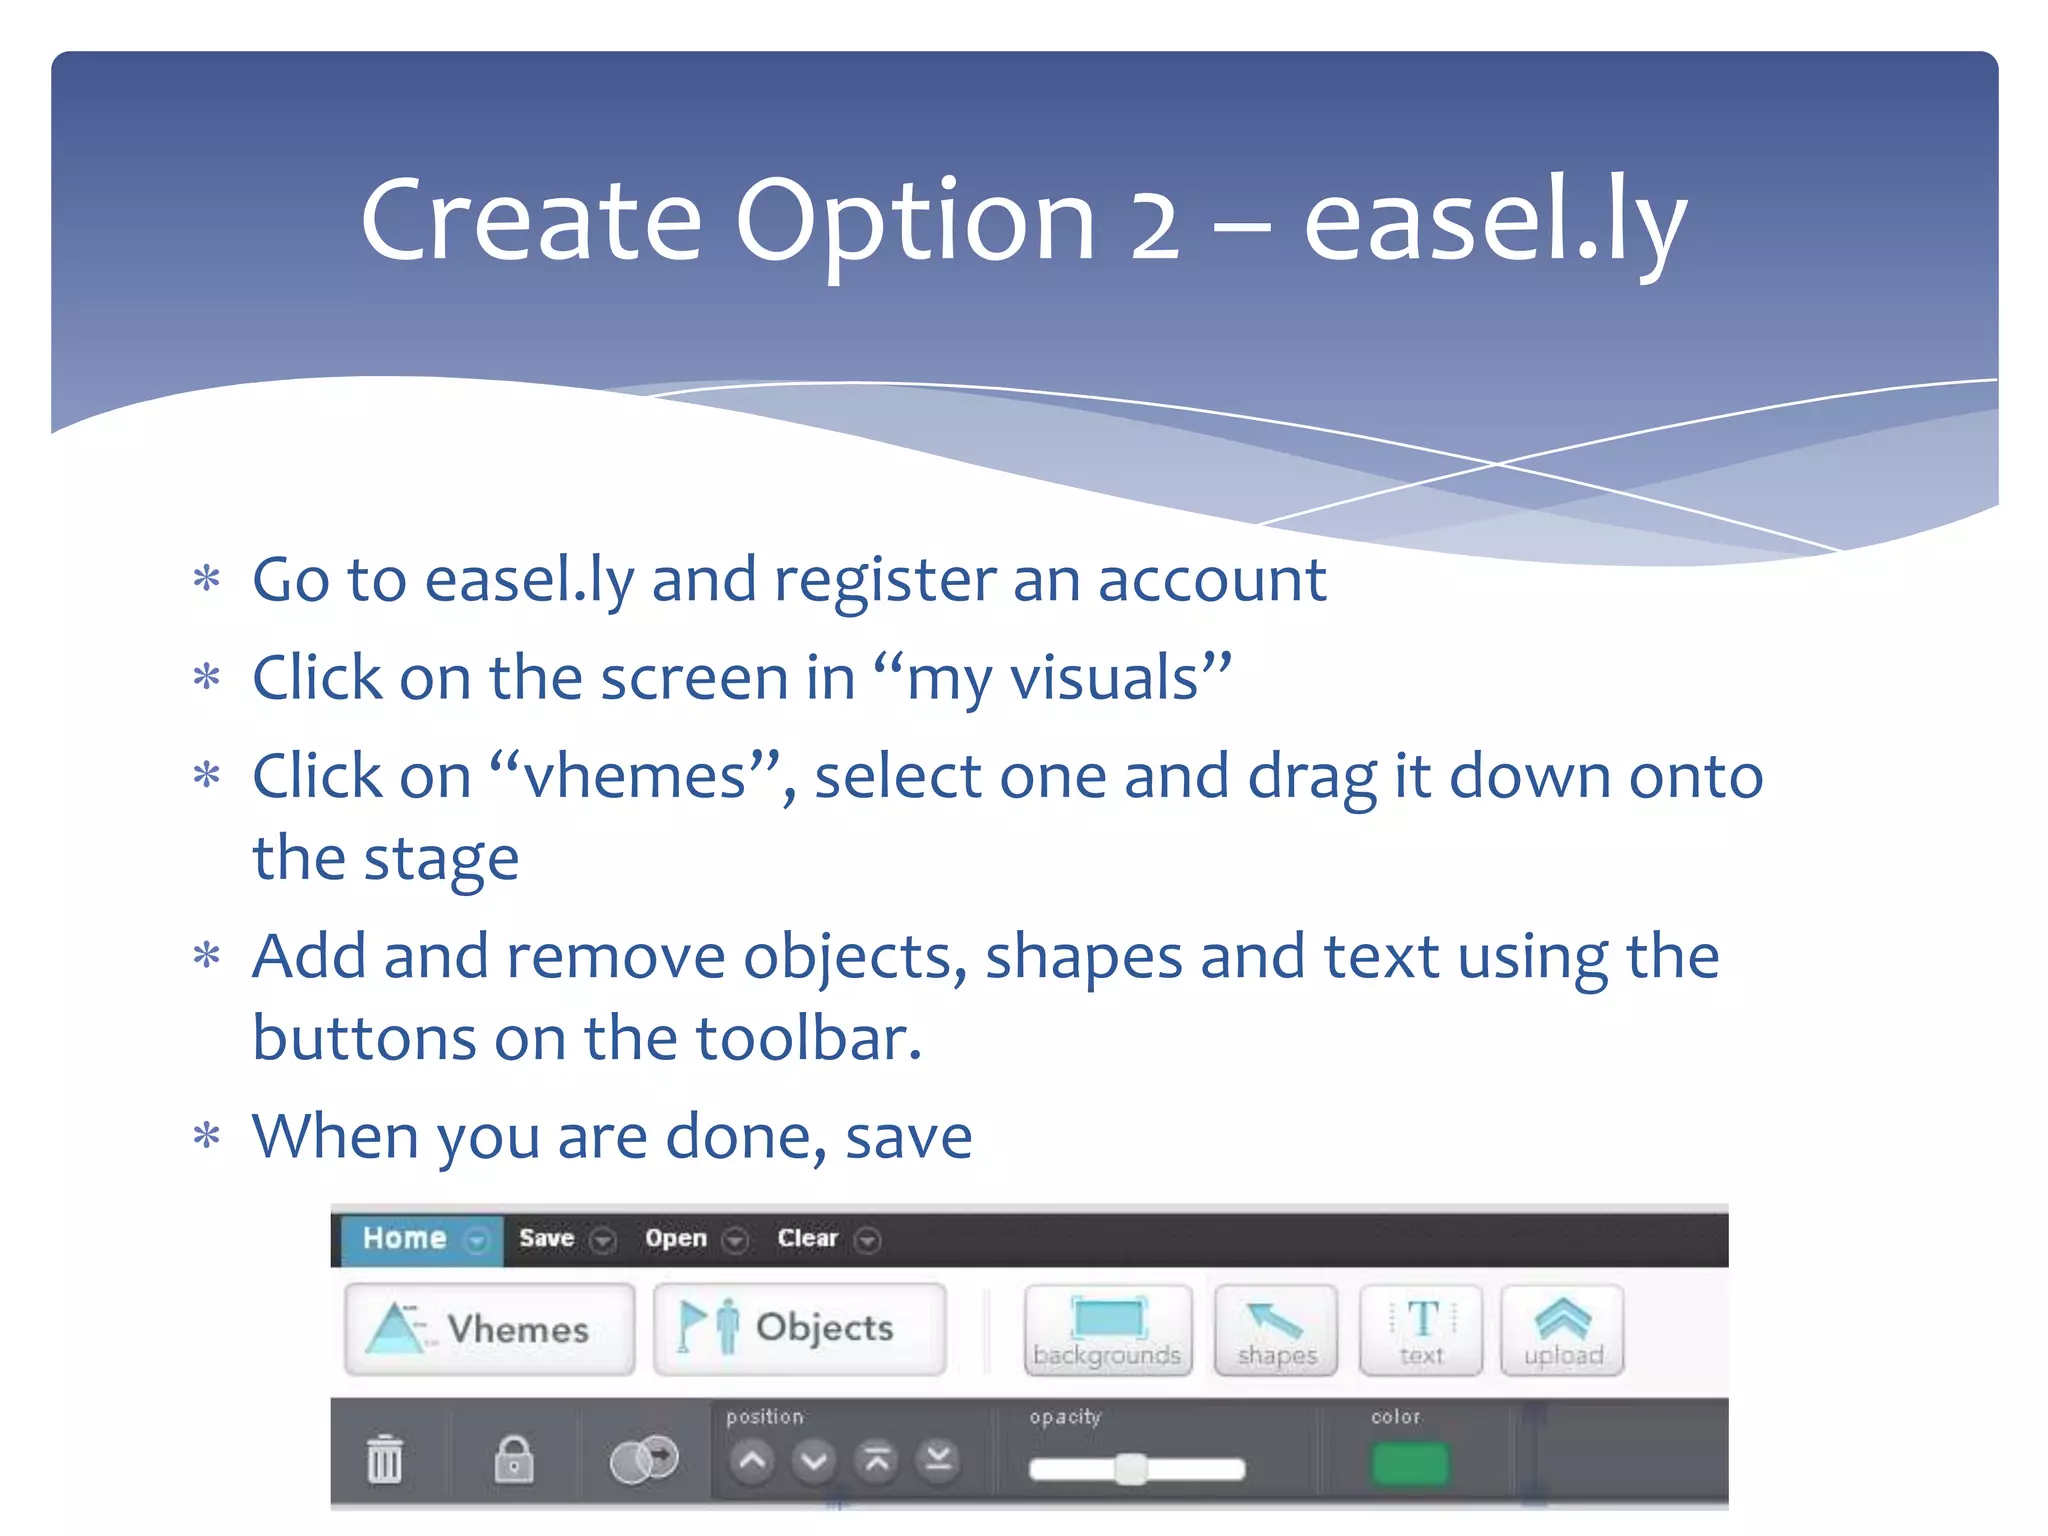
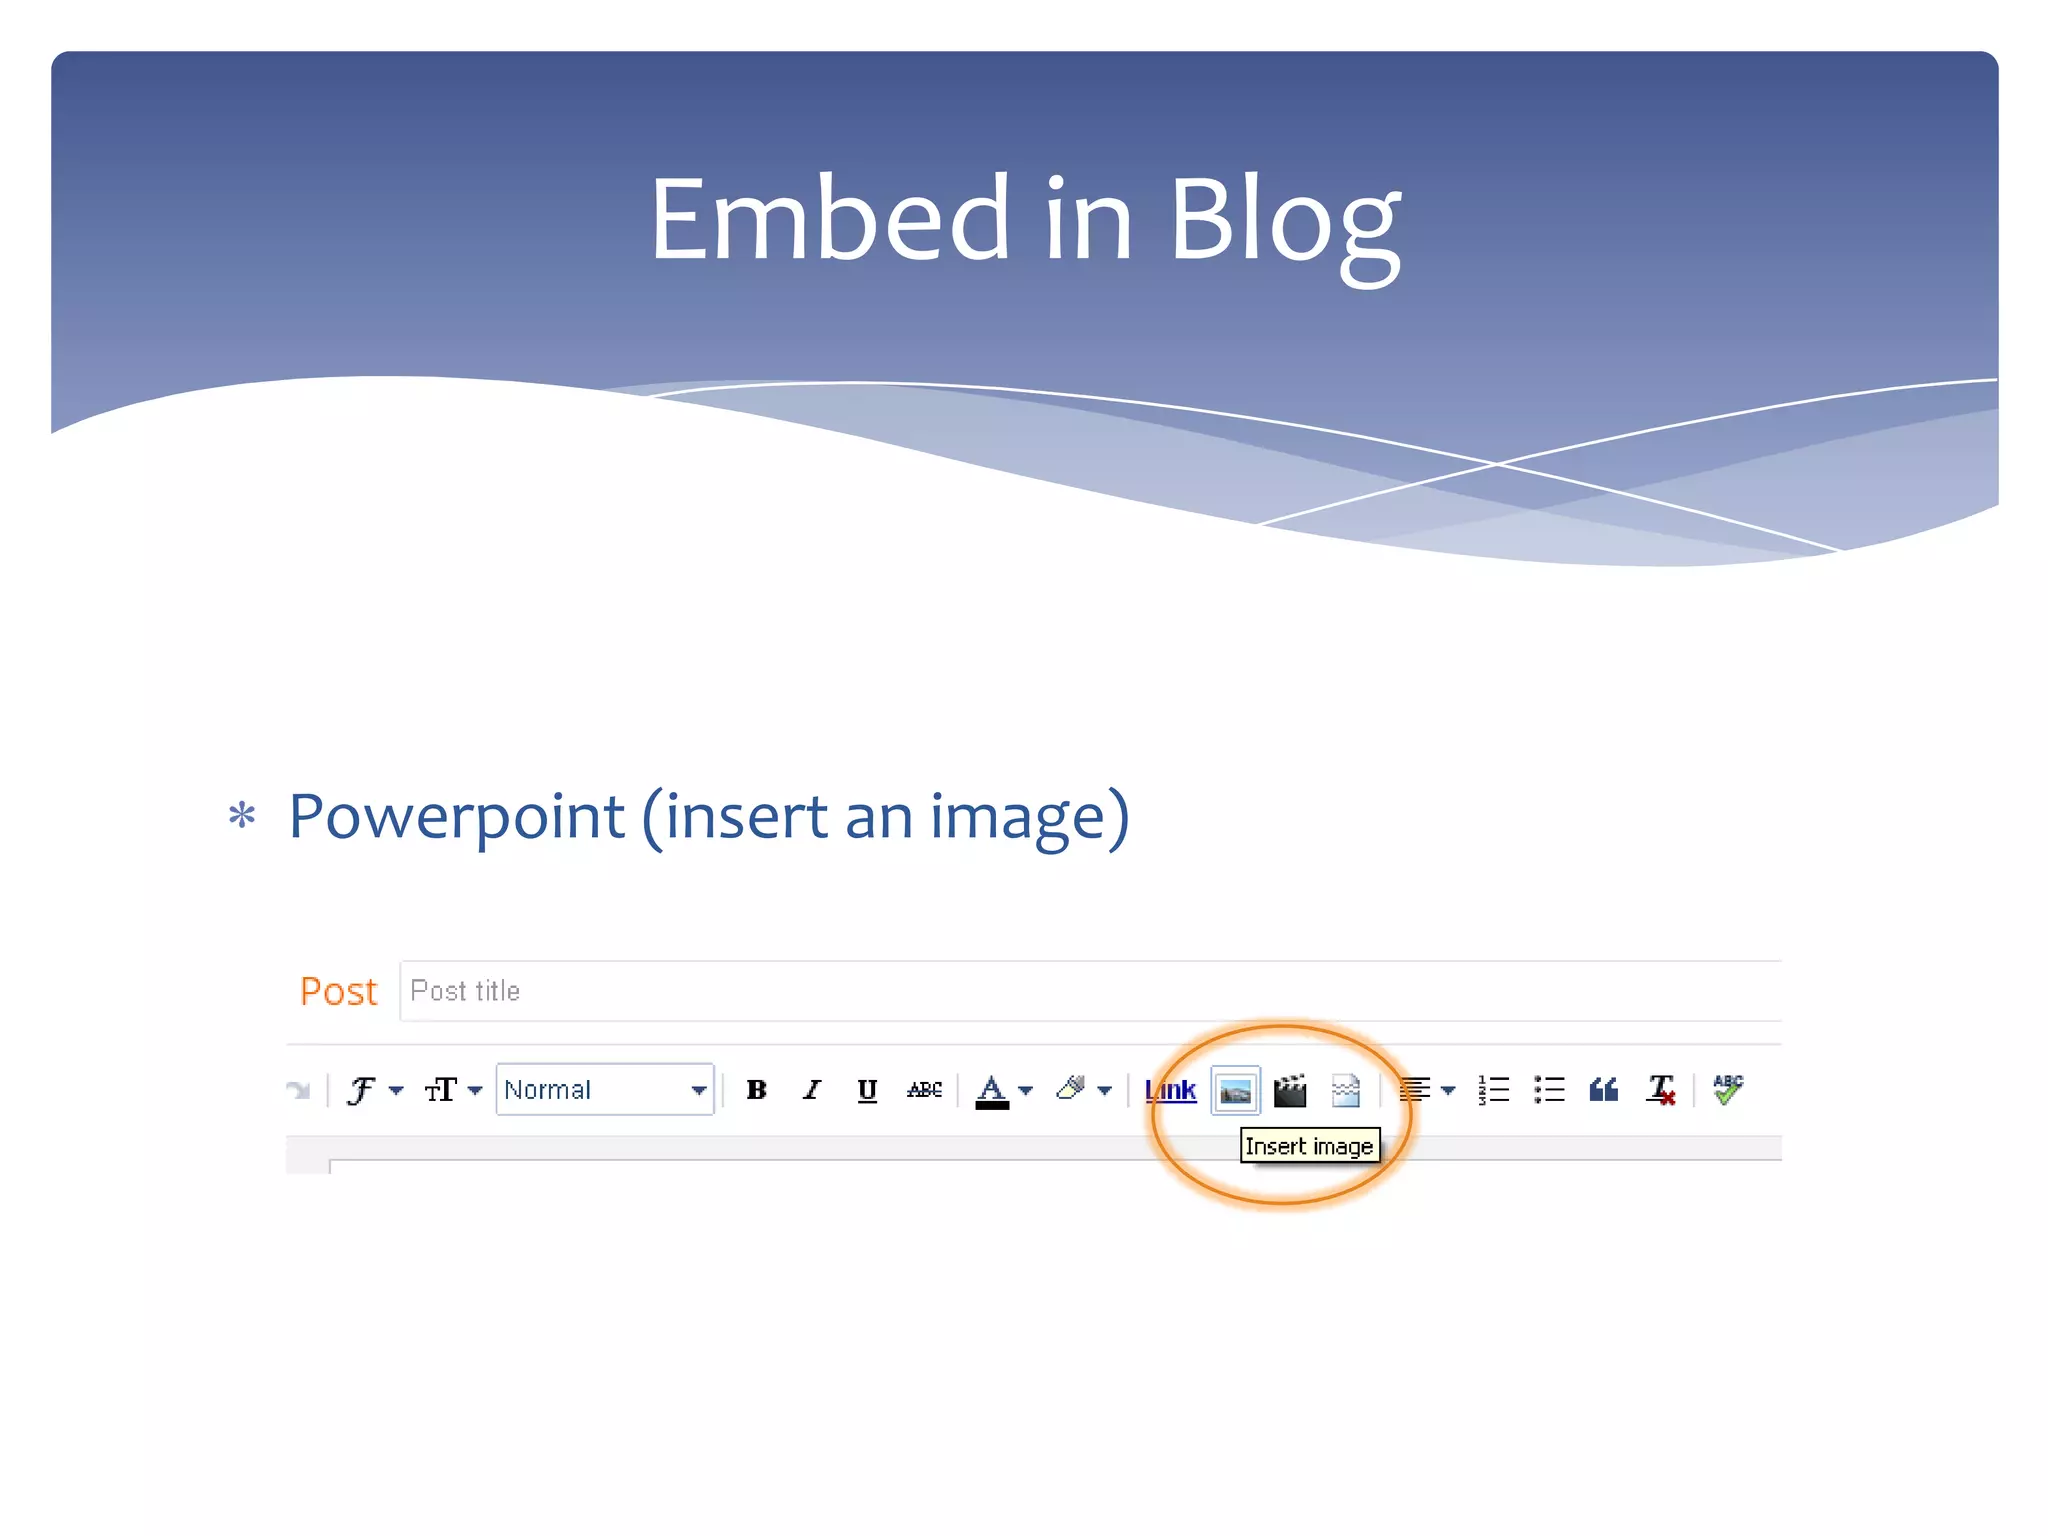

This document provides instructions for creating an infographic. It begins by defining an infographic and discussing the power of visuals in learning. It notes that 65% of people are visual learners. It then asks the reader to look at the start of an example infographic and think about what type of depiction of single parents it will have based on the title. The document continues by providing tips on choosing a topic, doing research, sketching out a design, and using tools like PowerPoint or Easelly to create the infographic. It emphasizes the importance of colors, fonts, and layout. The goal is to inform, persuade, or call to action the intended audience.


