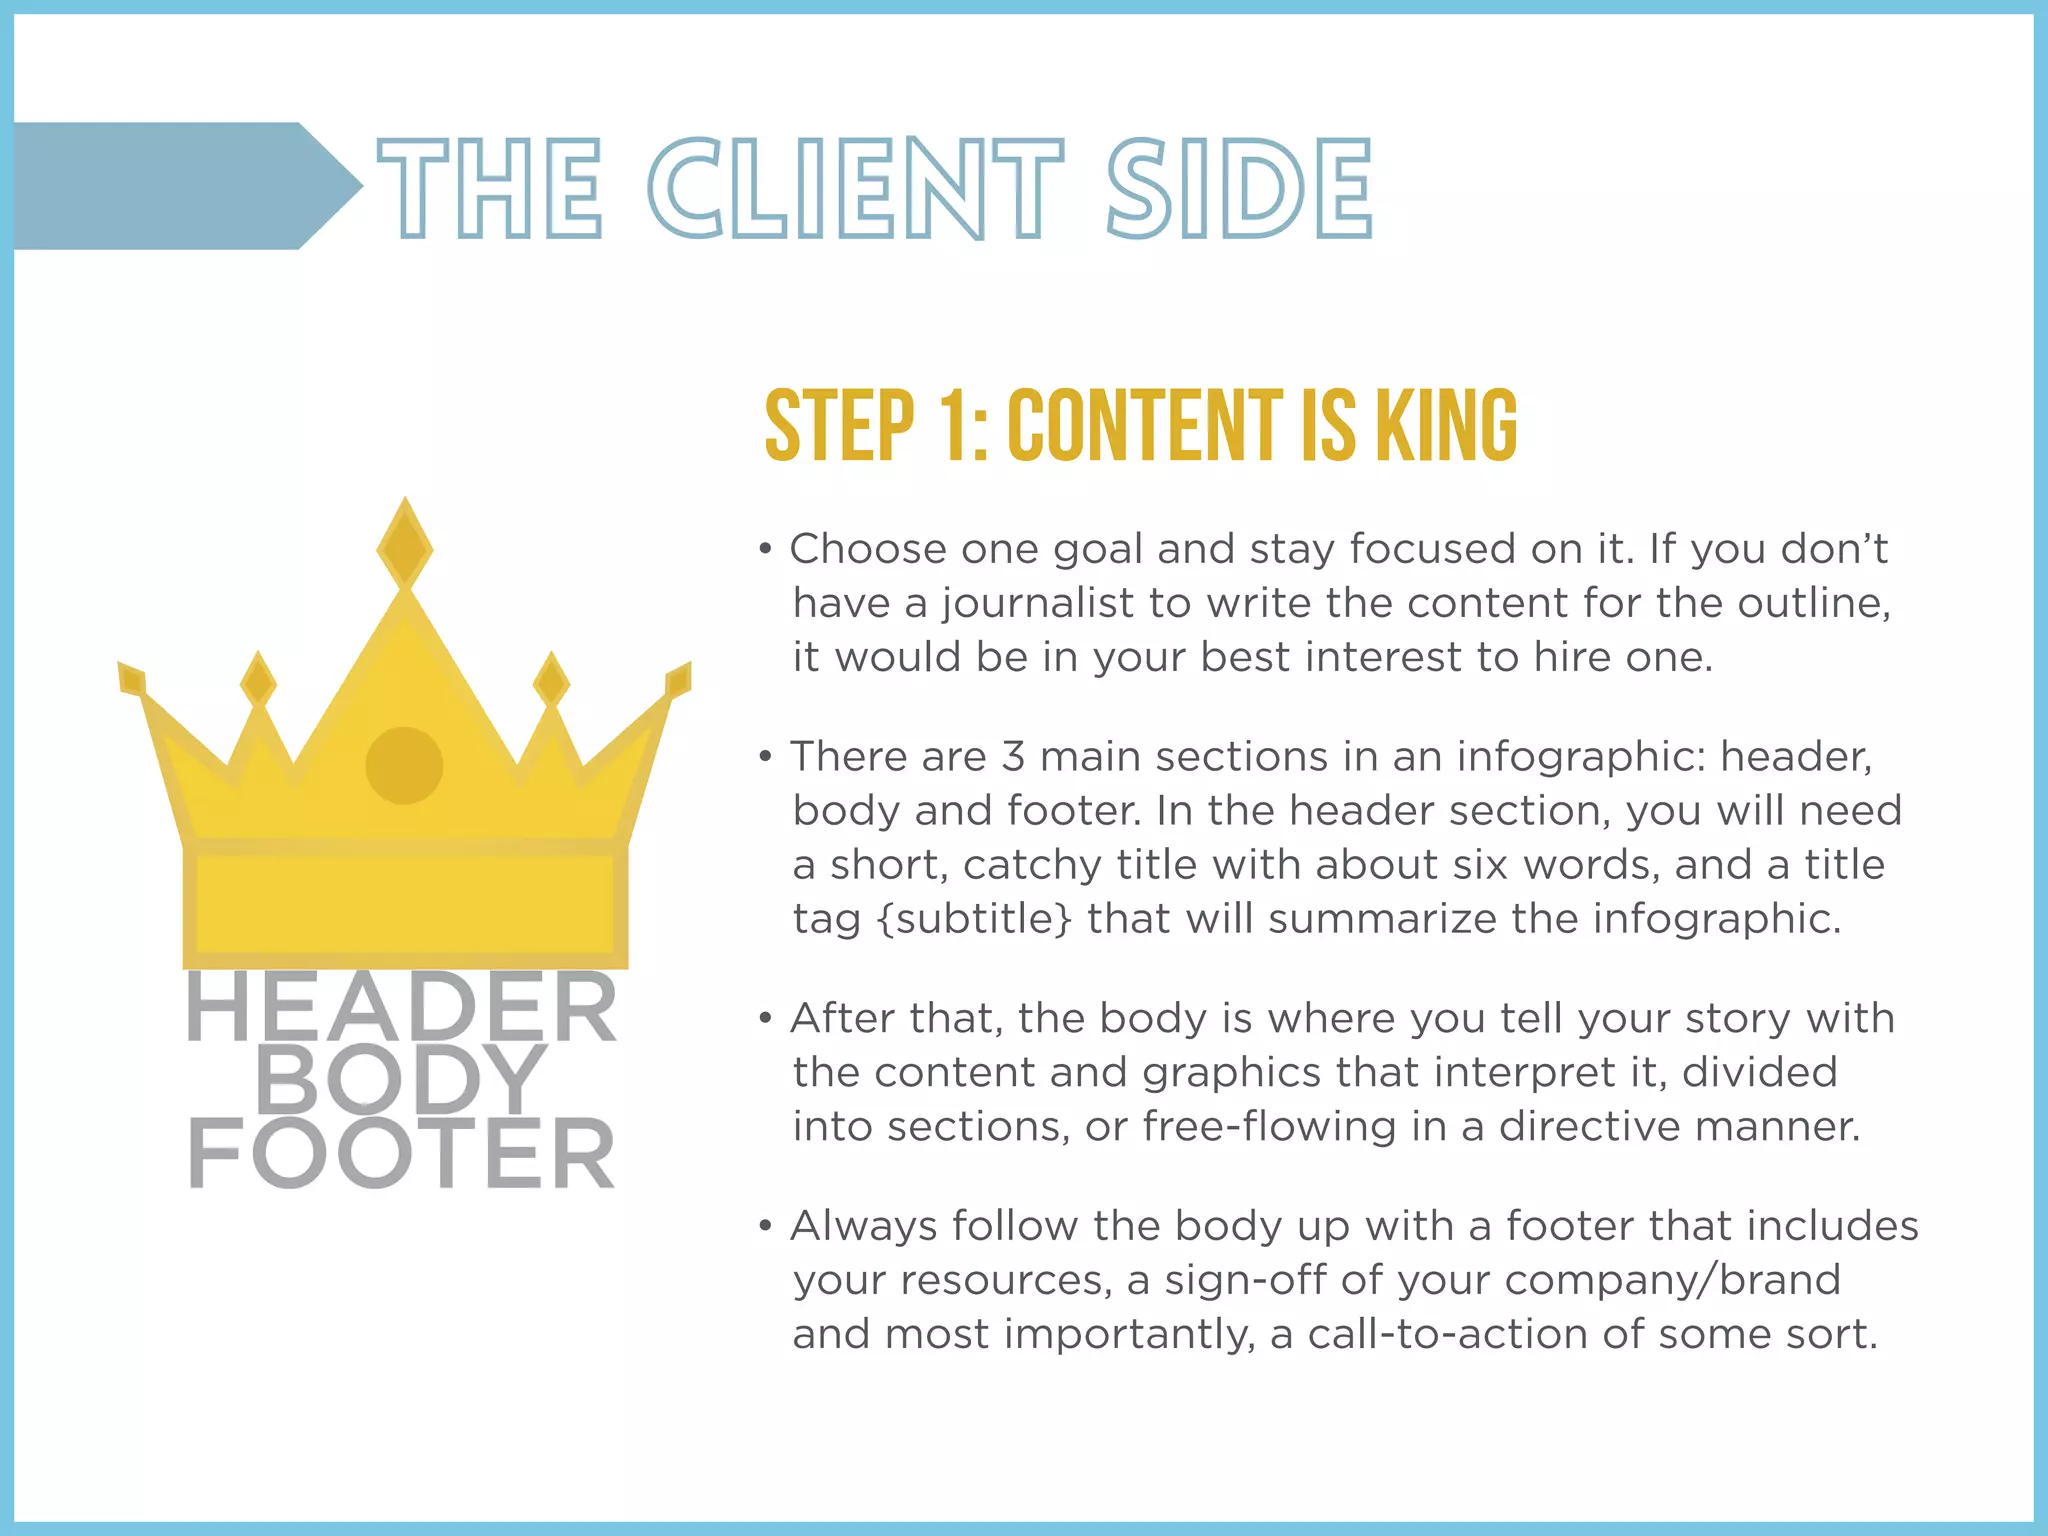
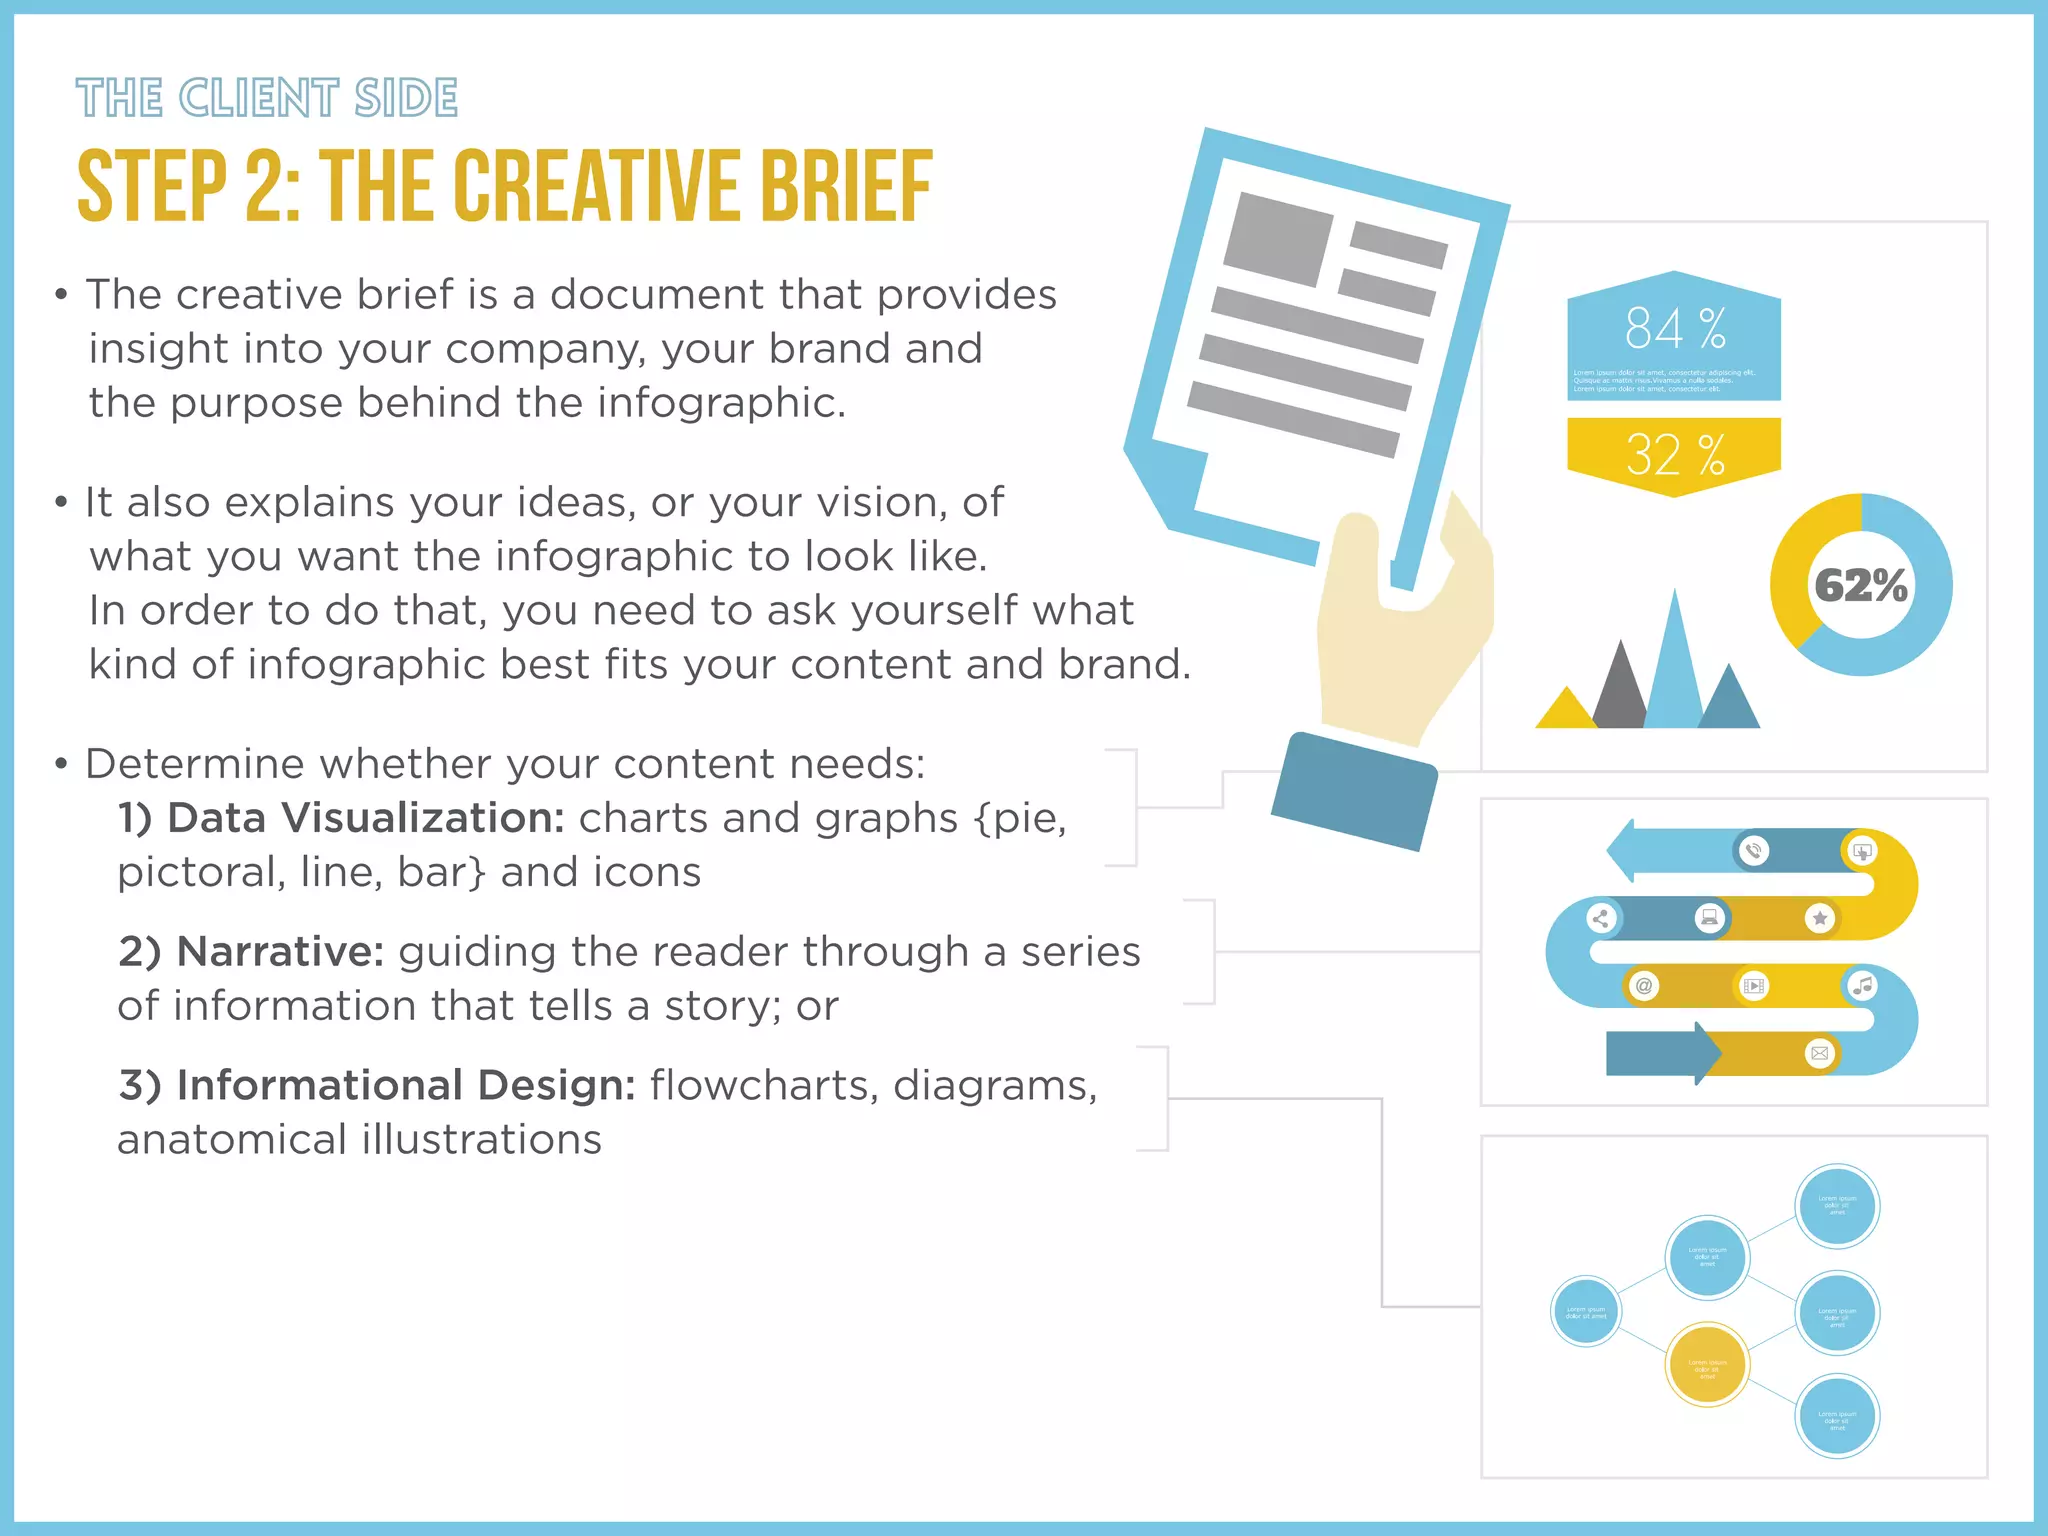
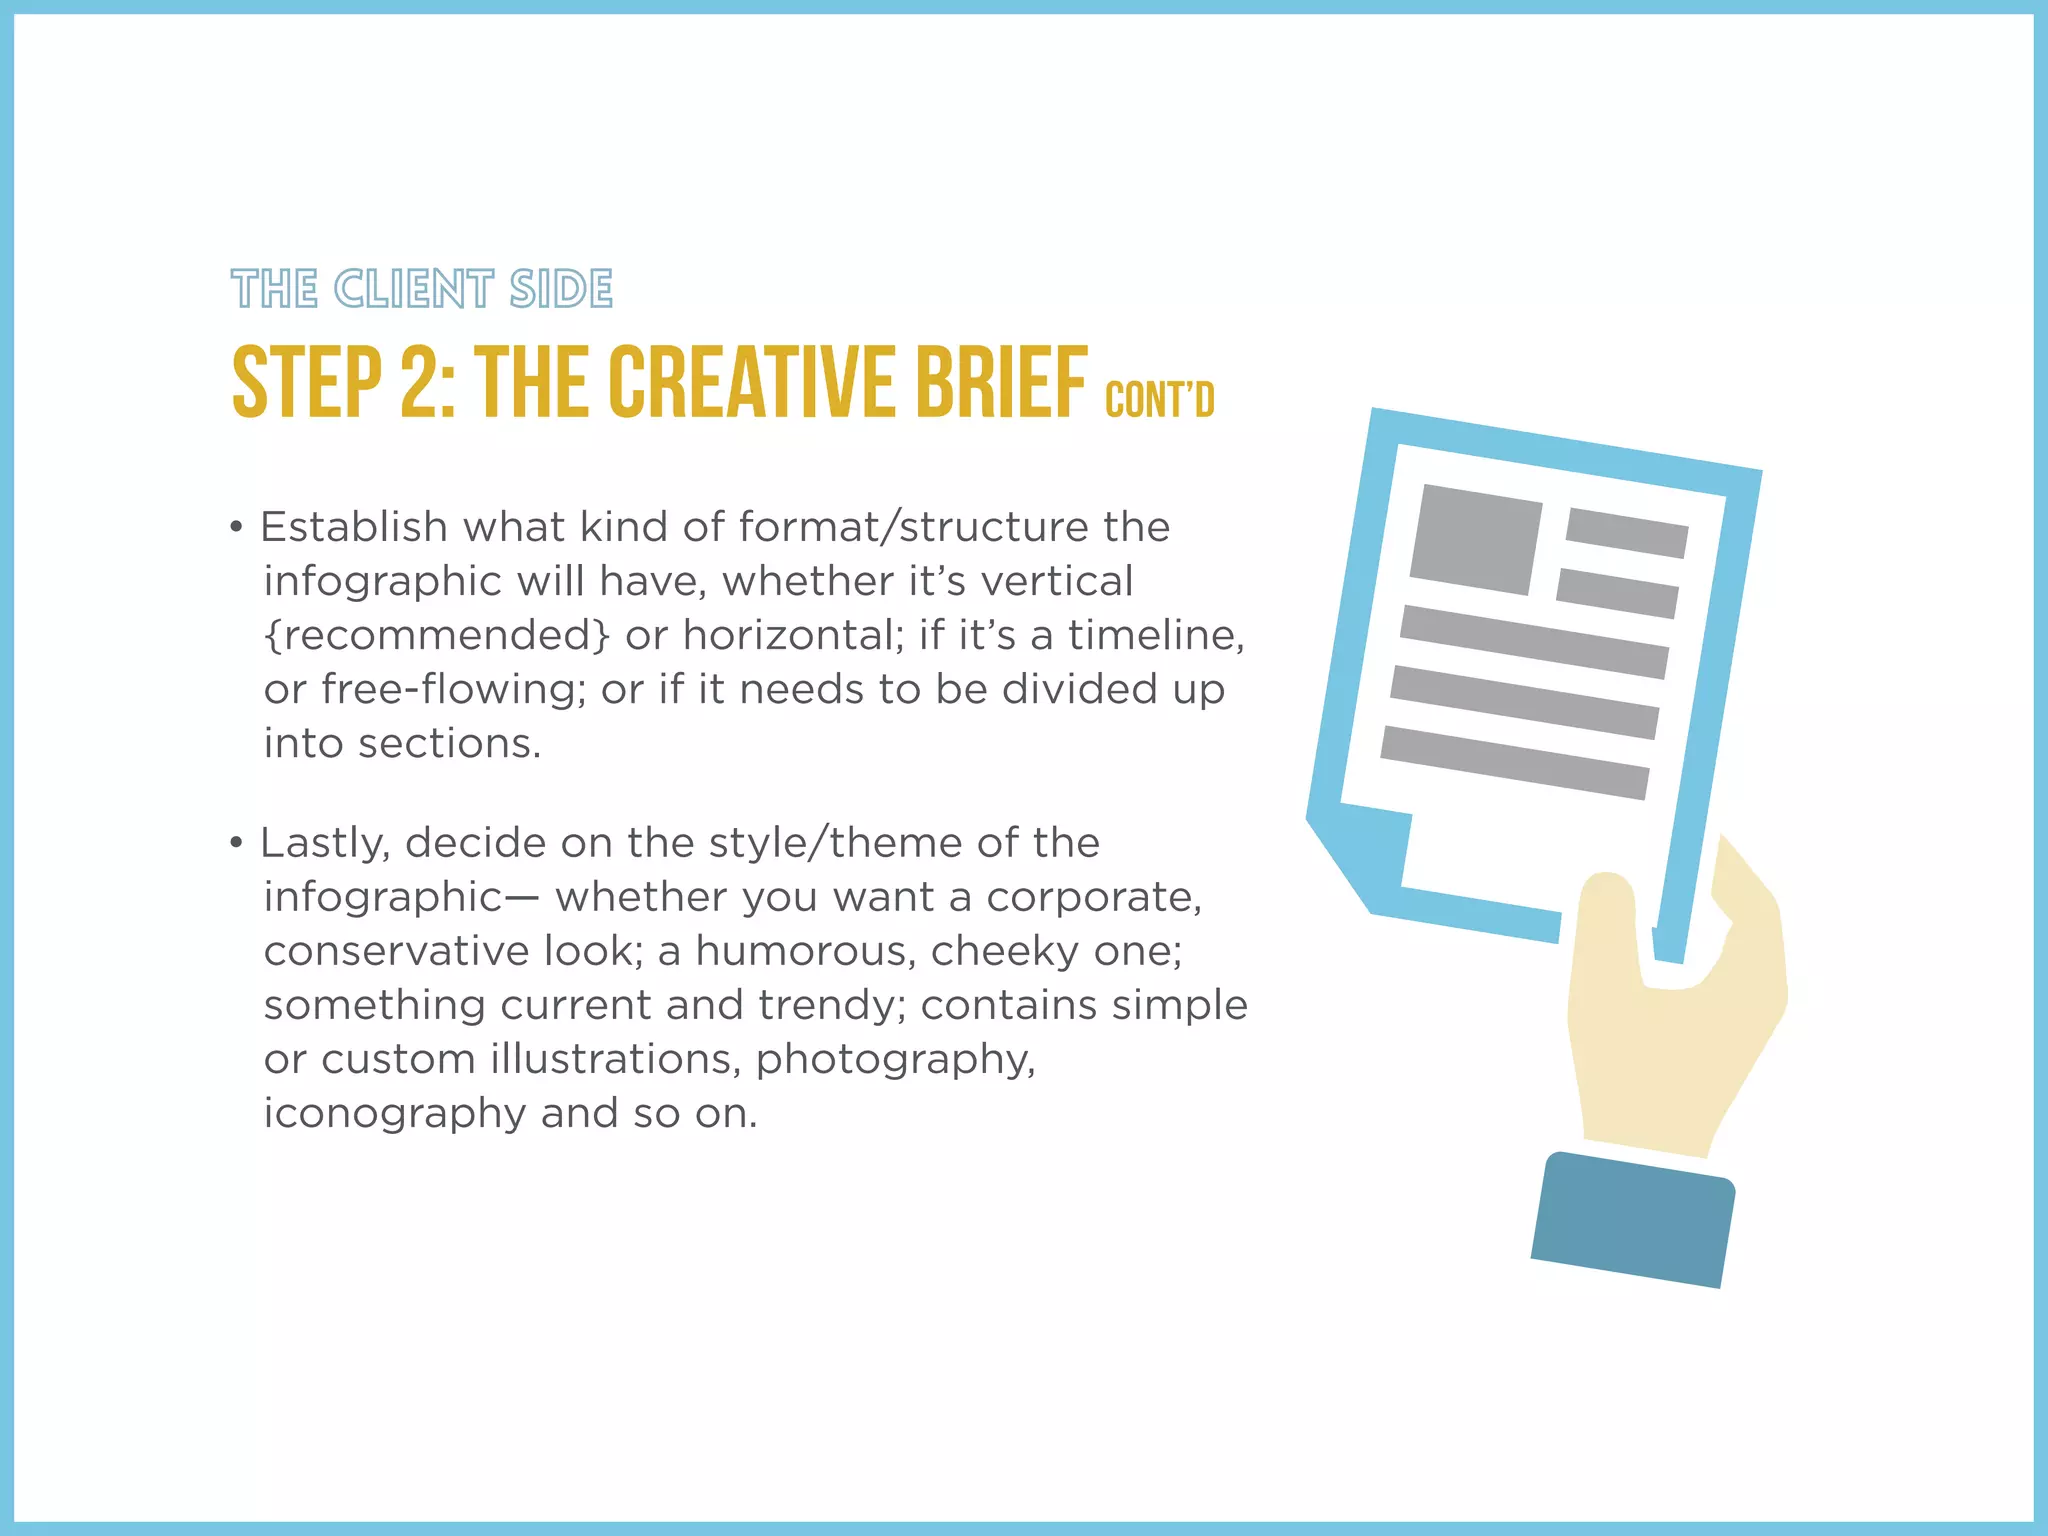
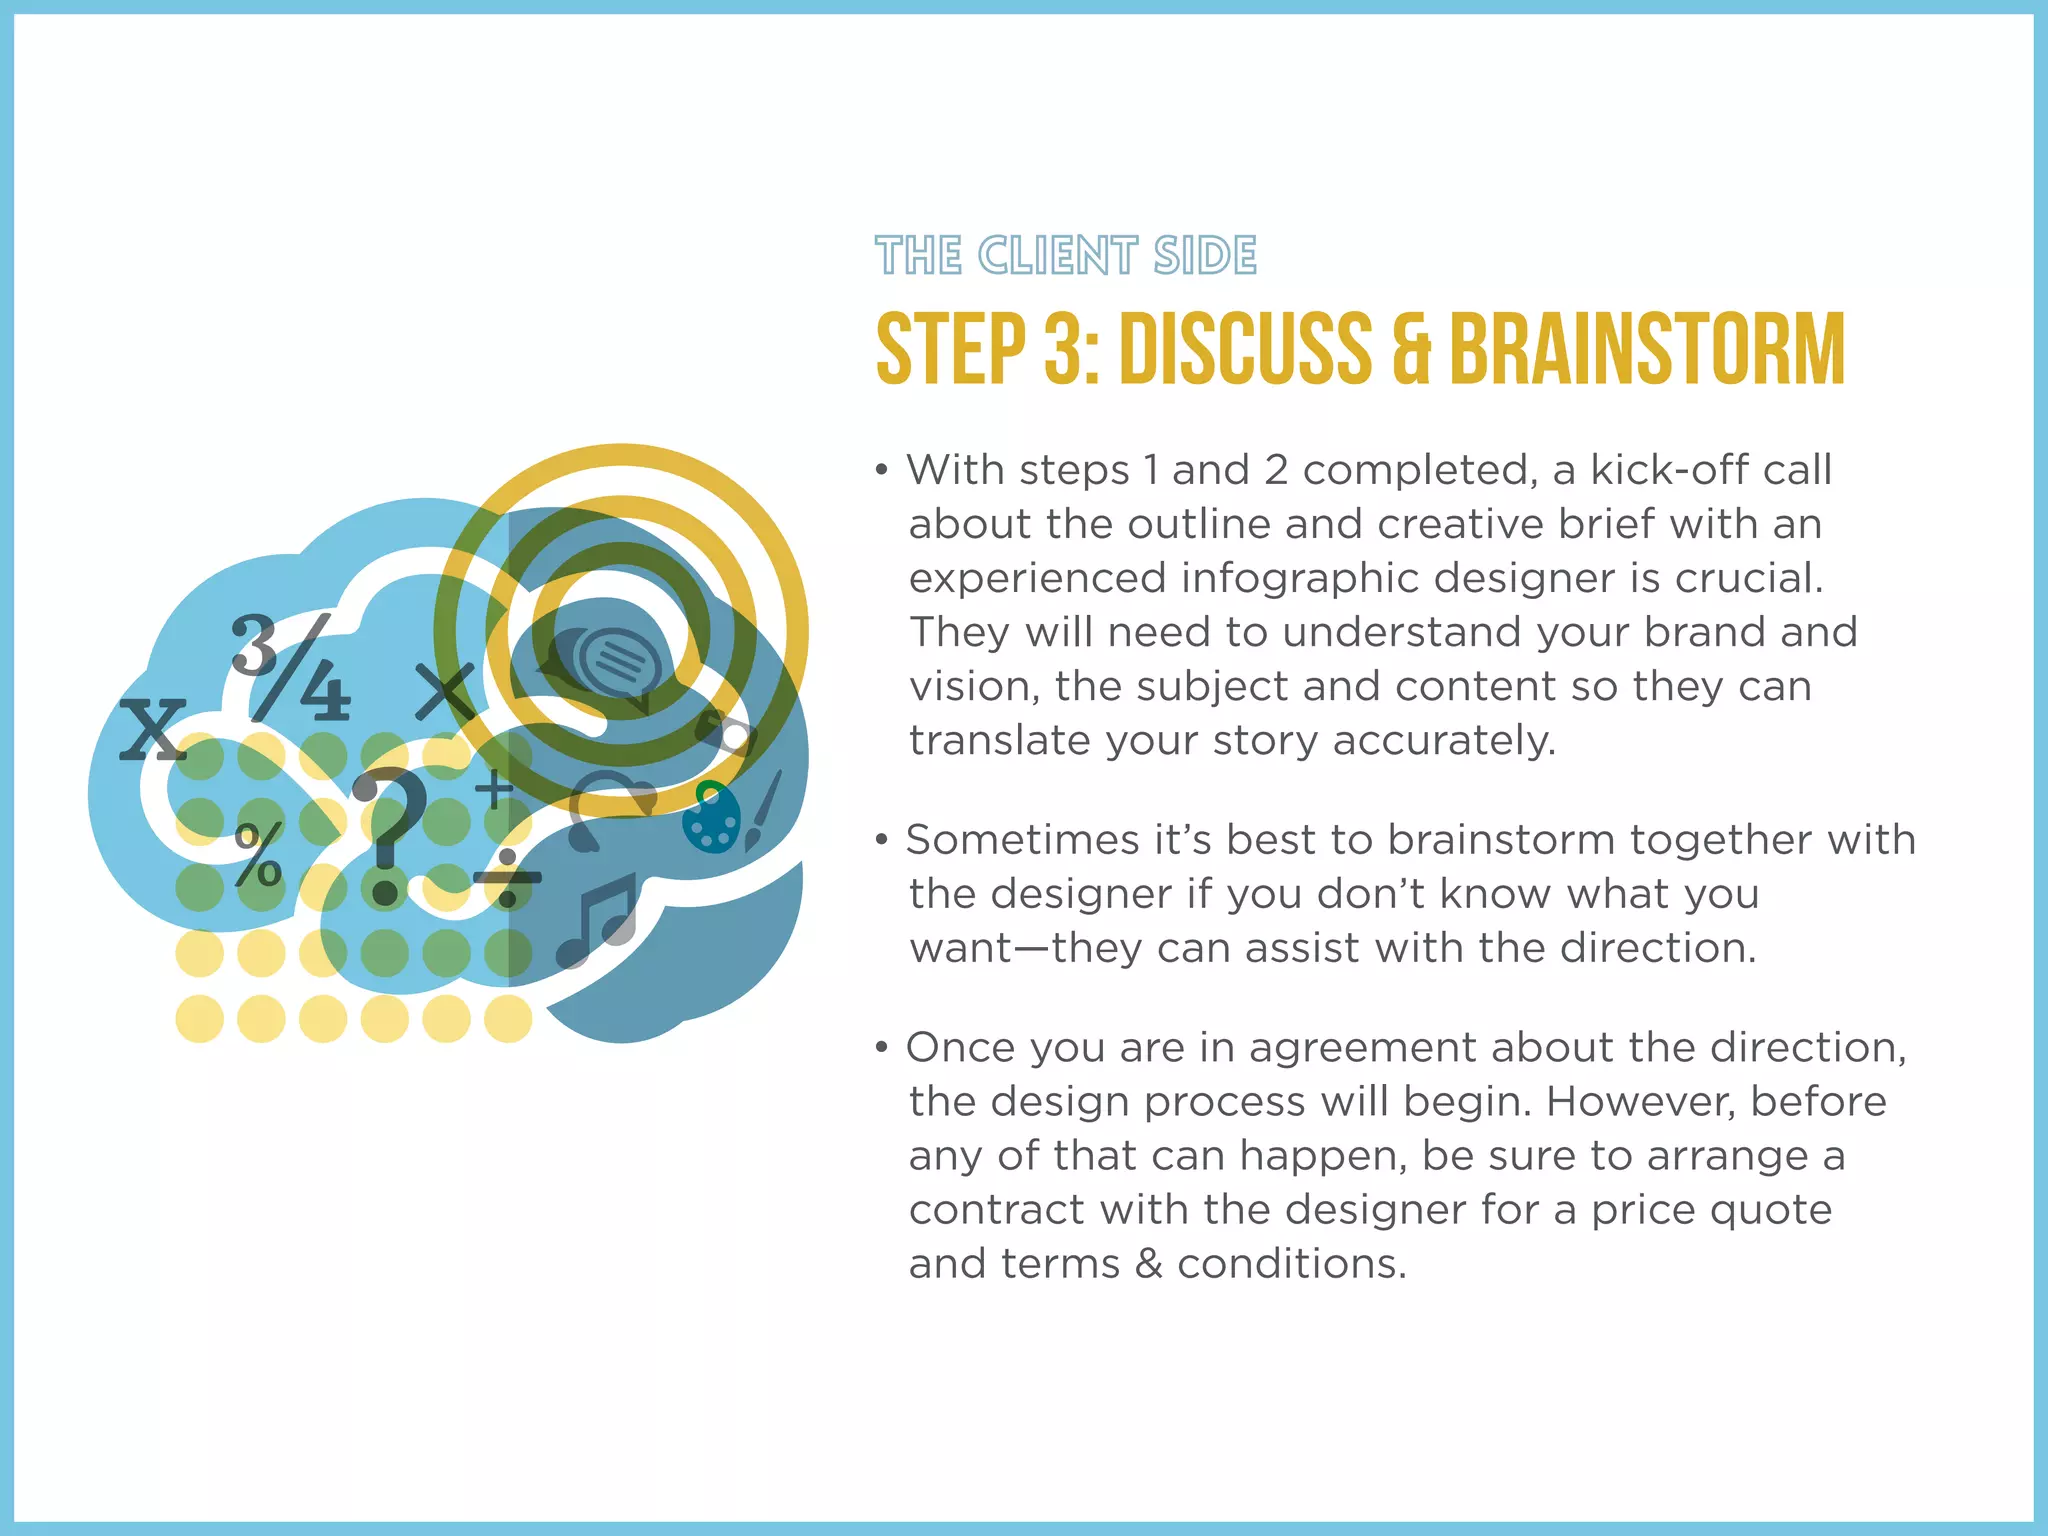
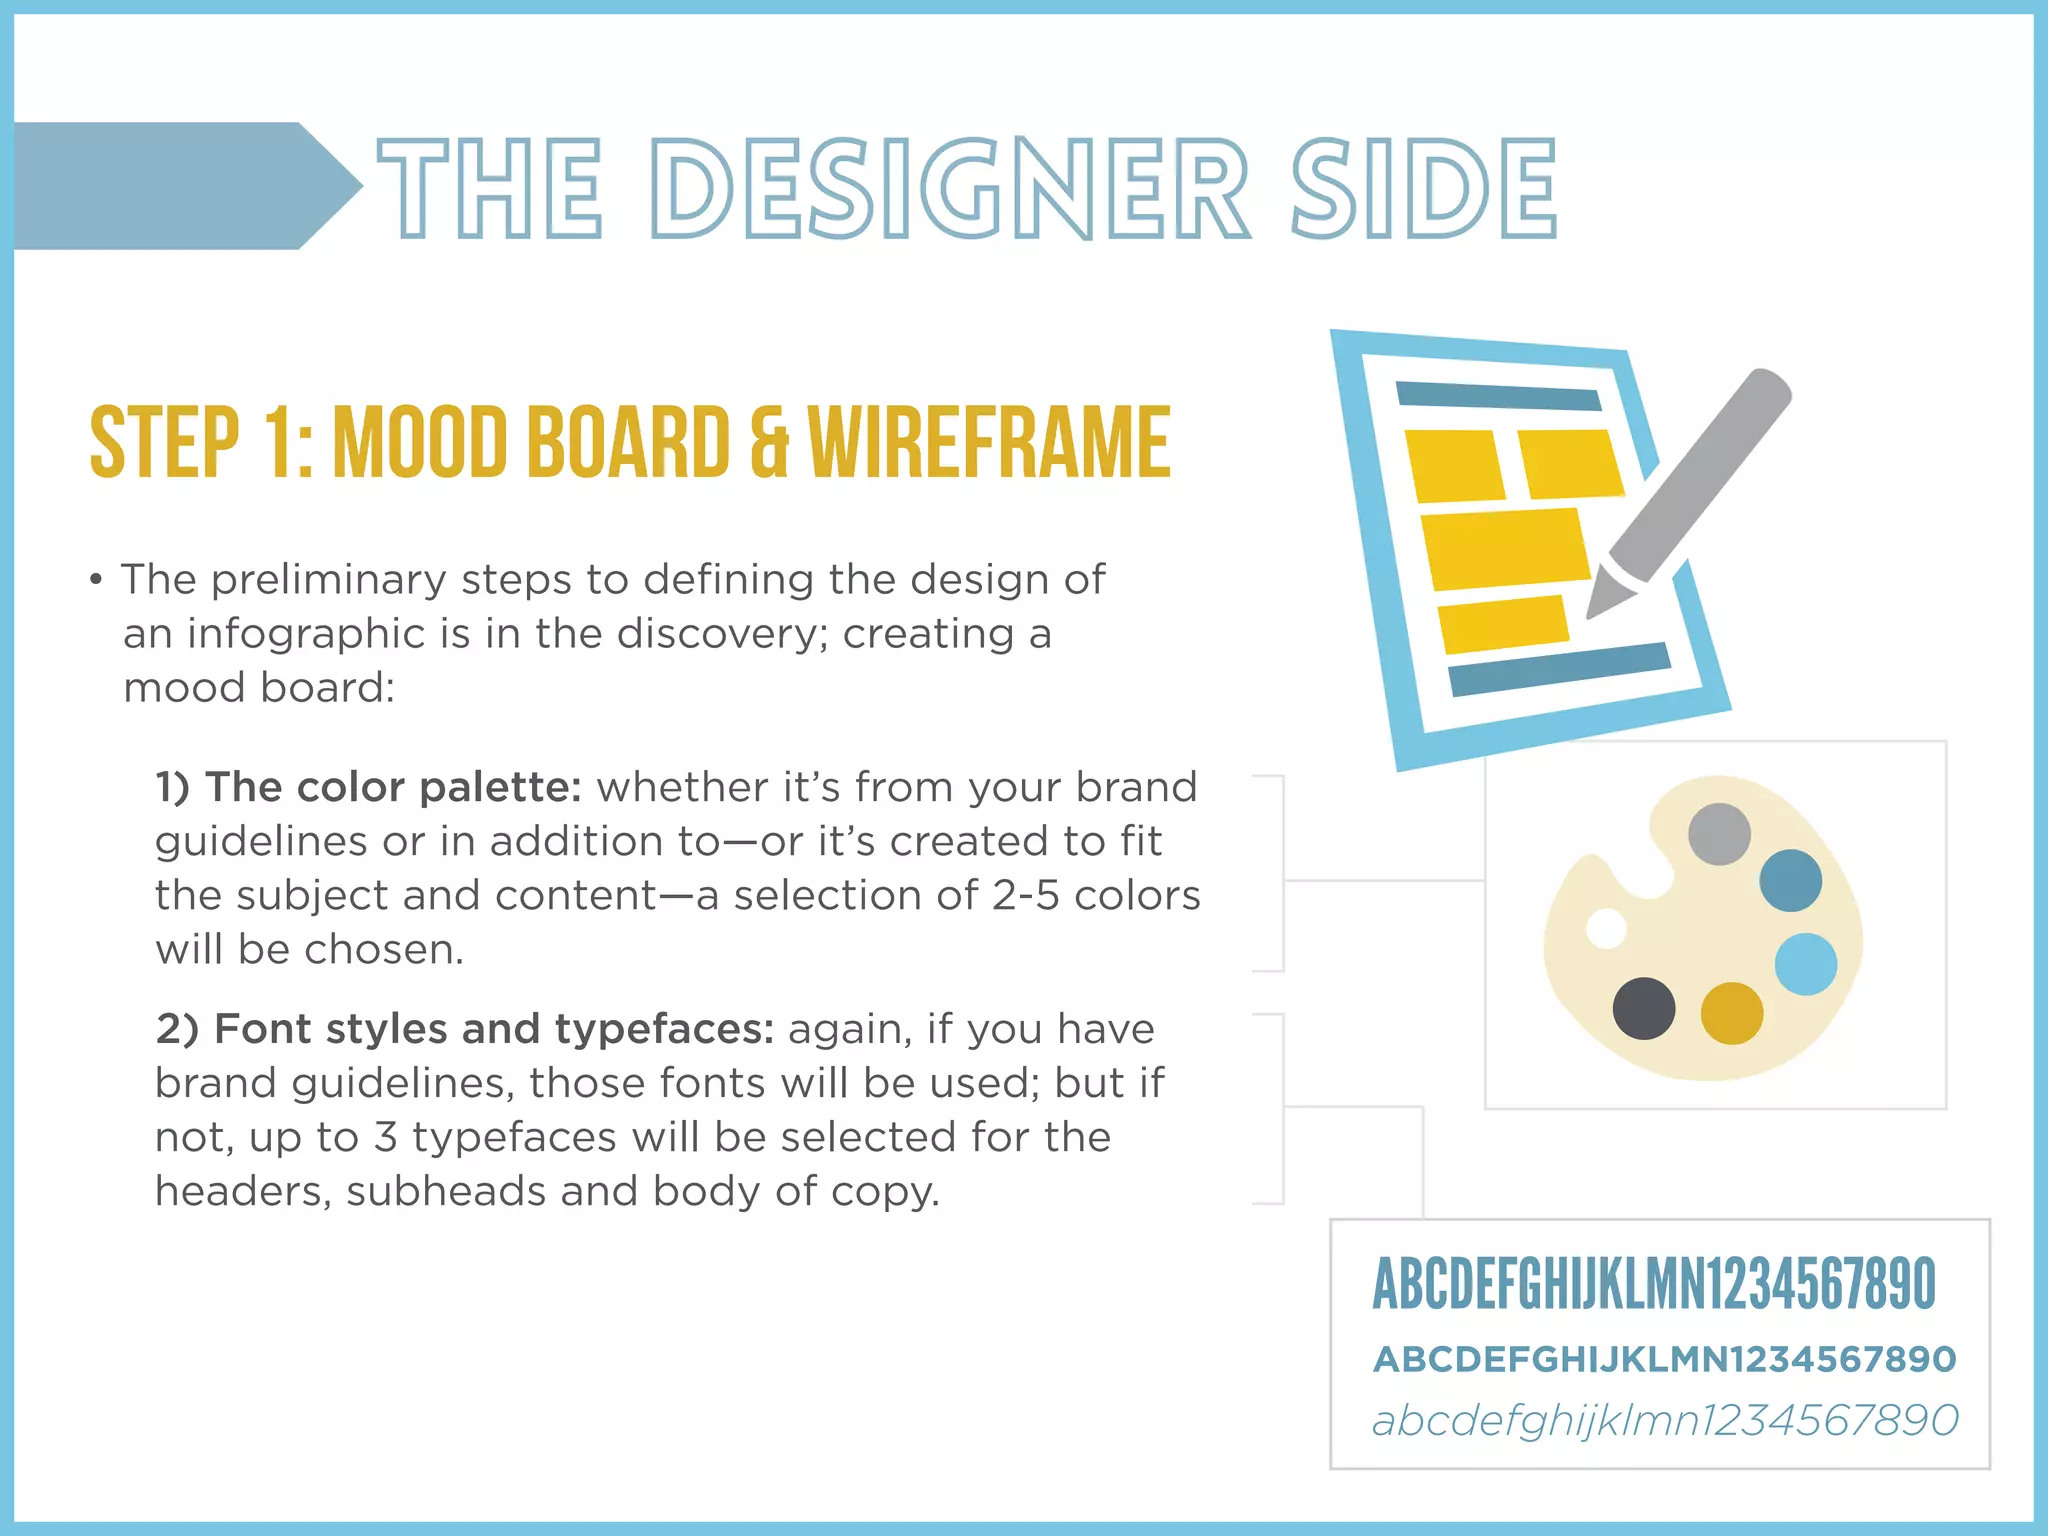
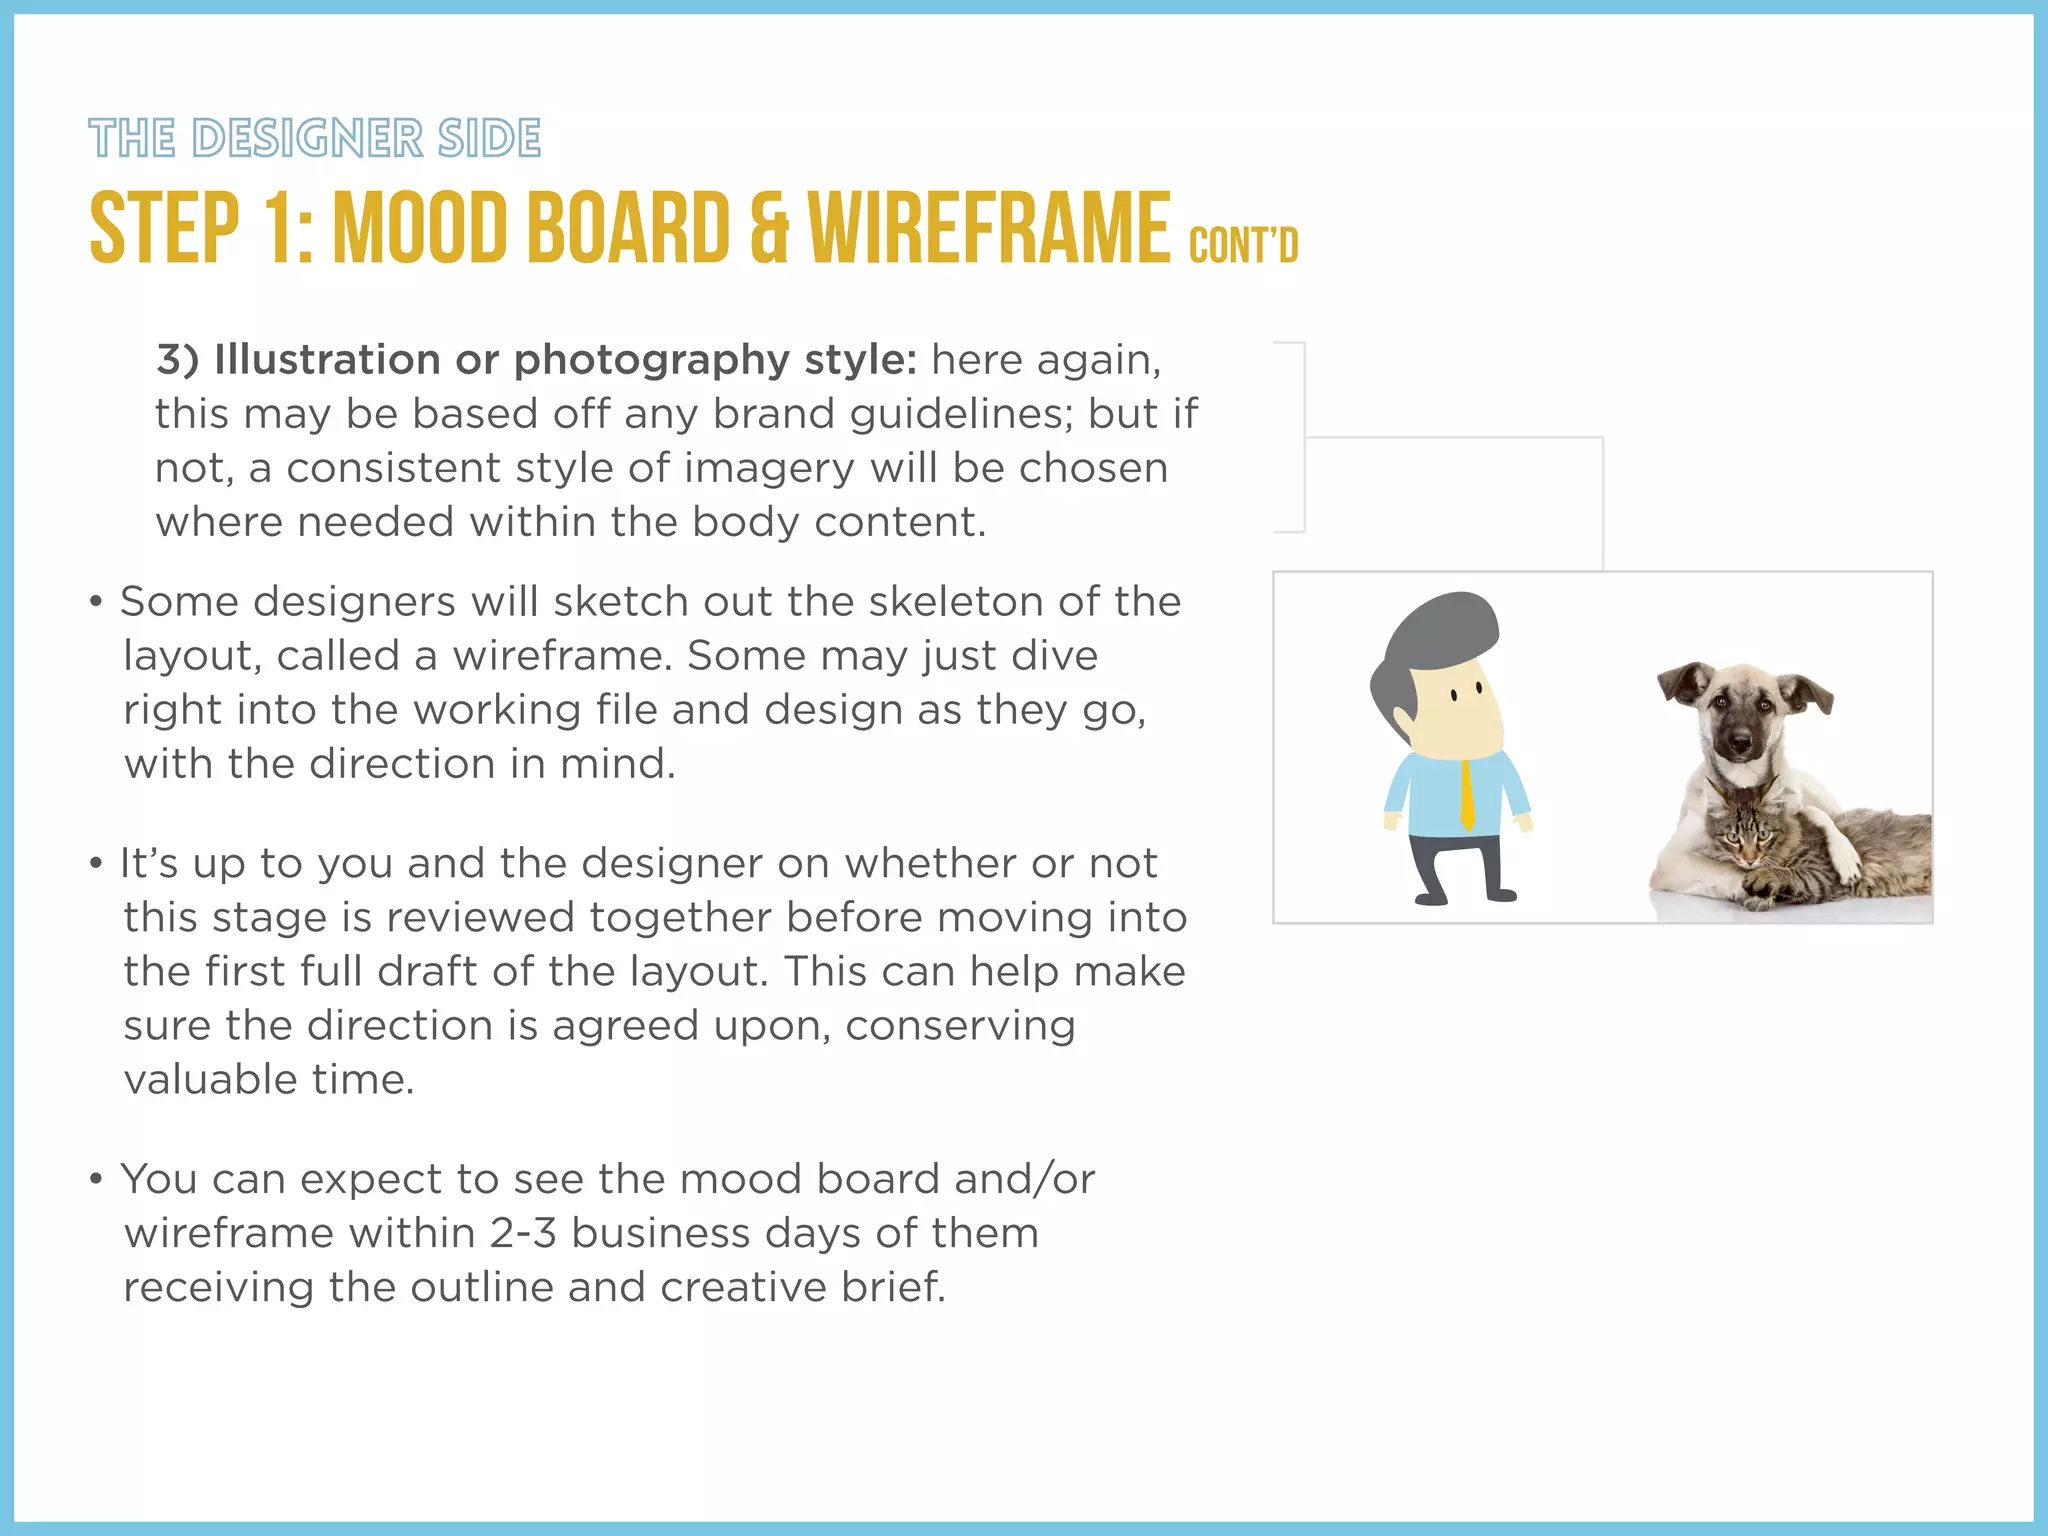
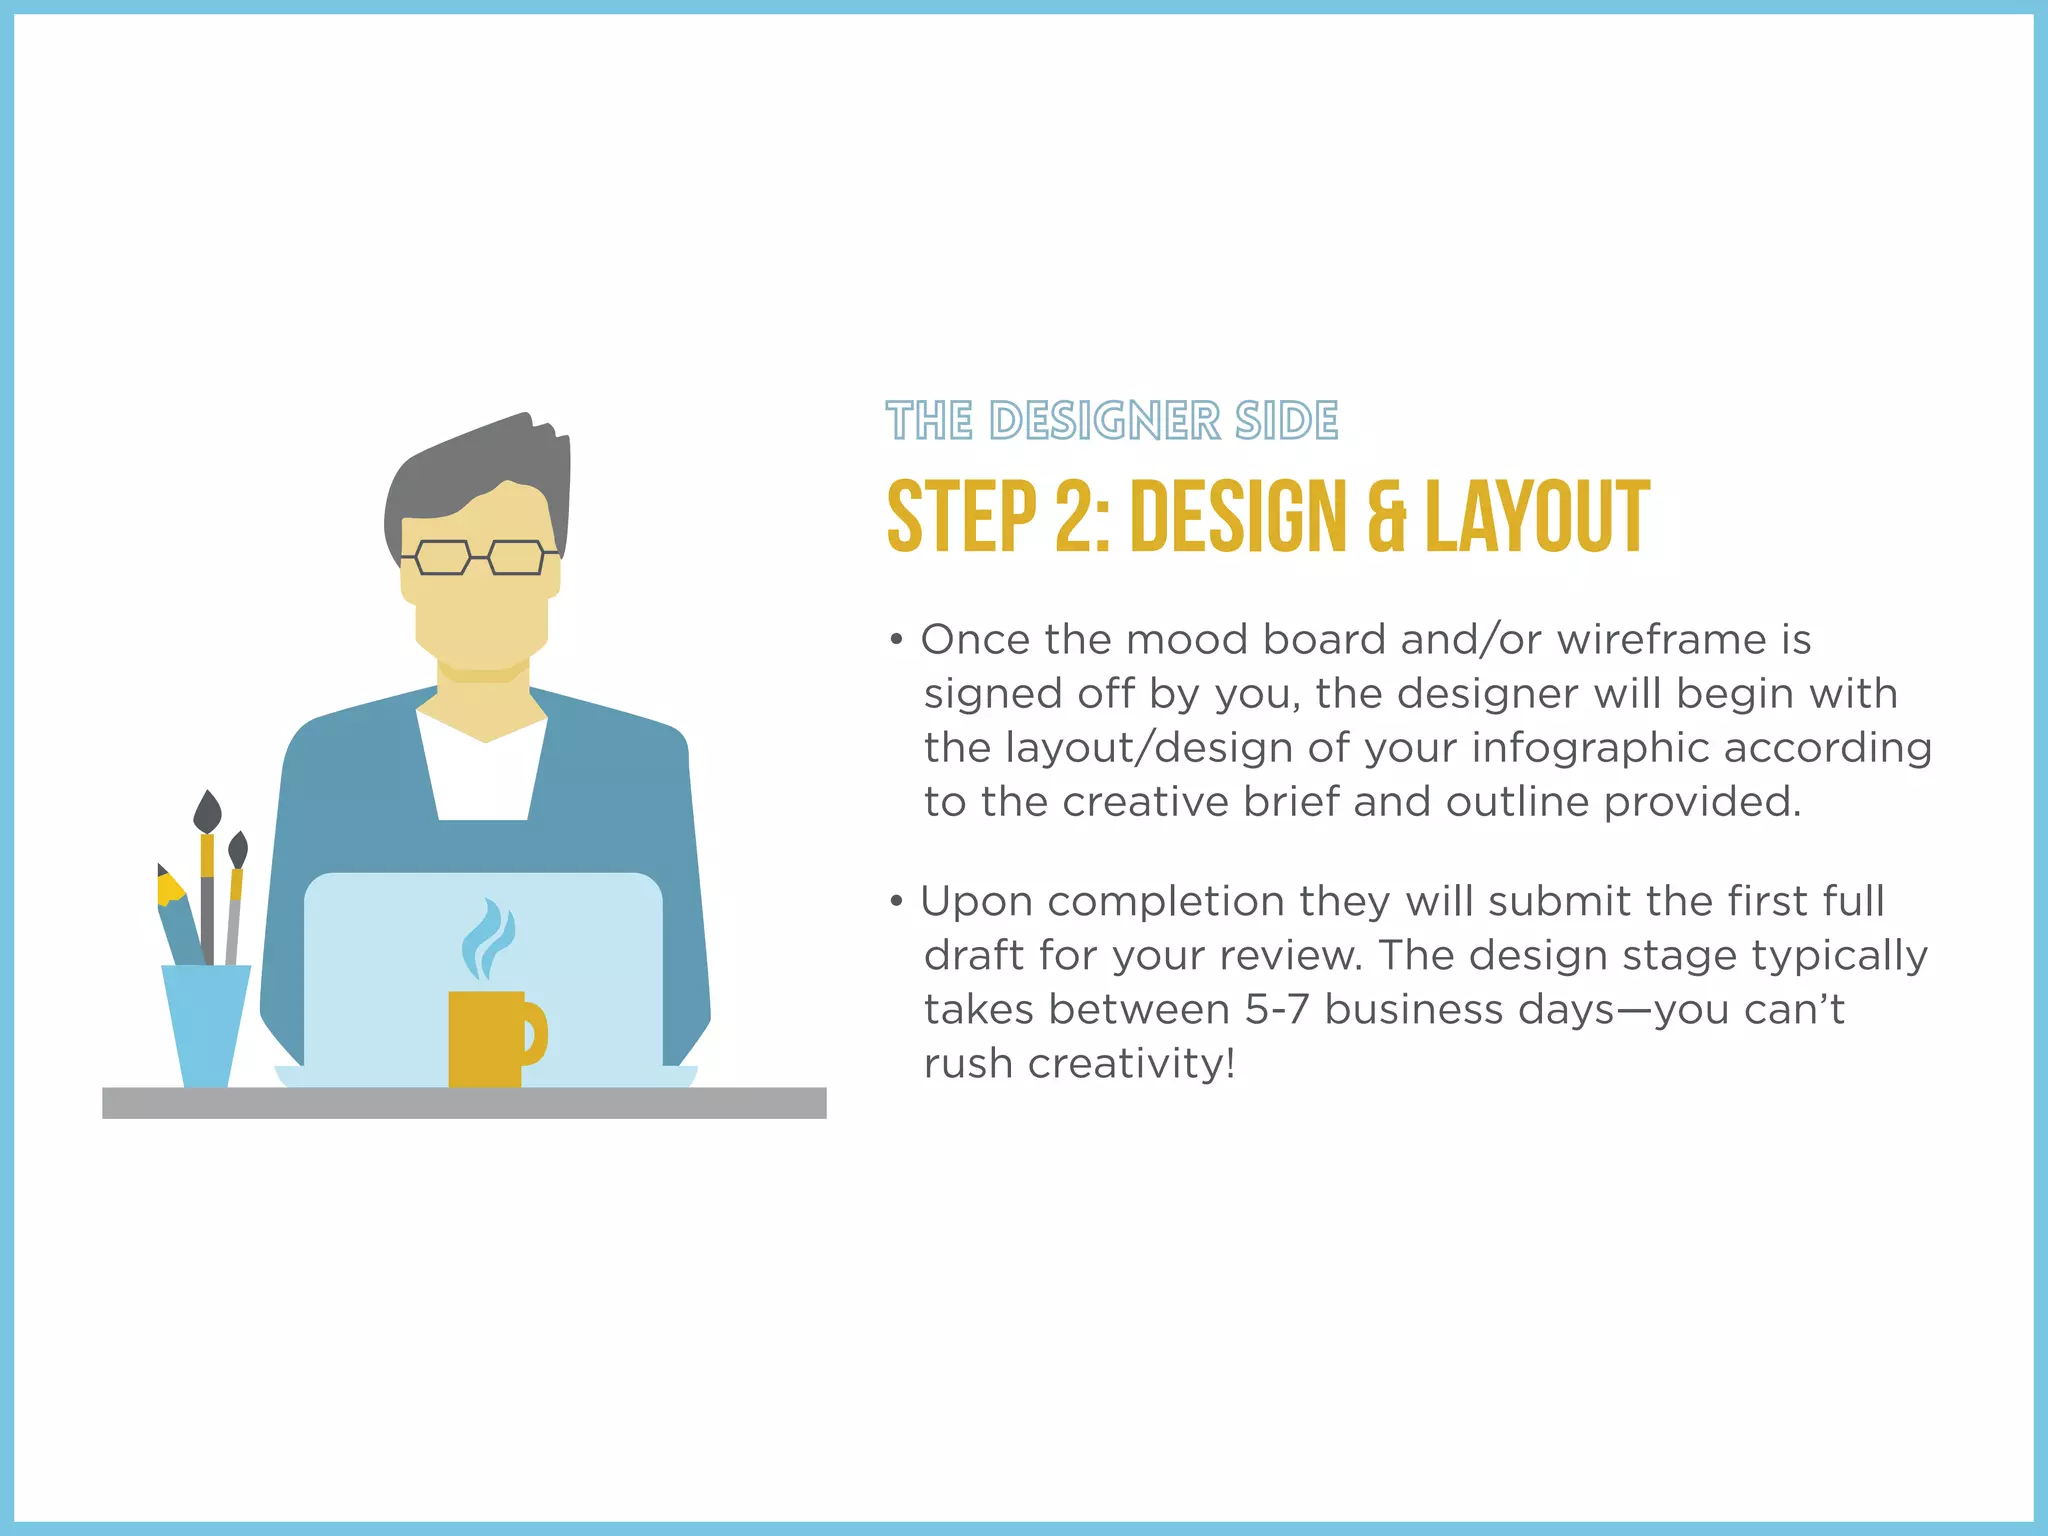
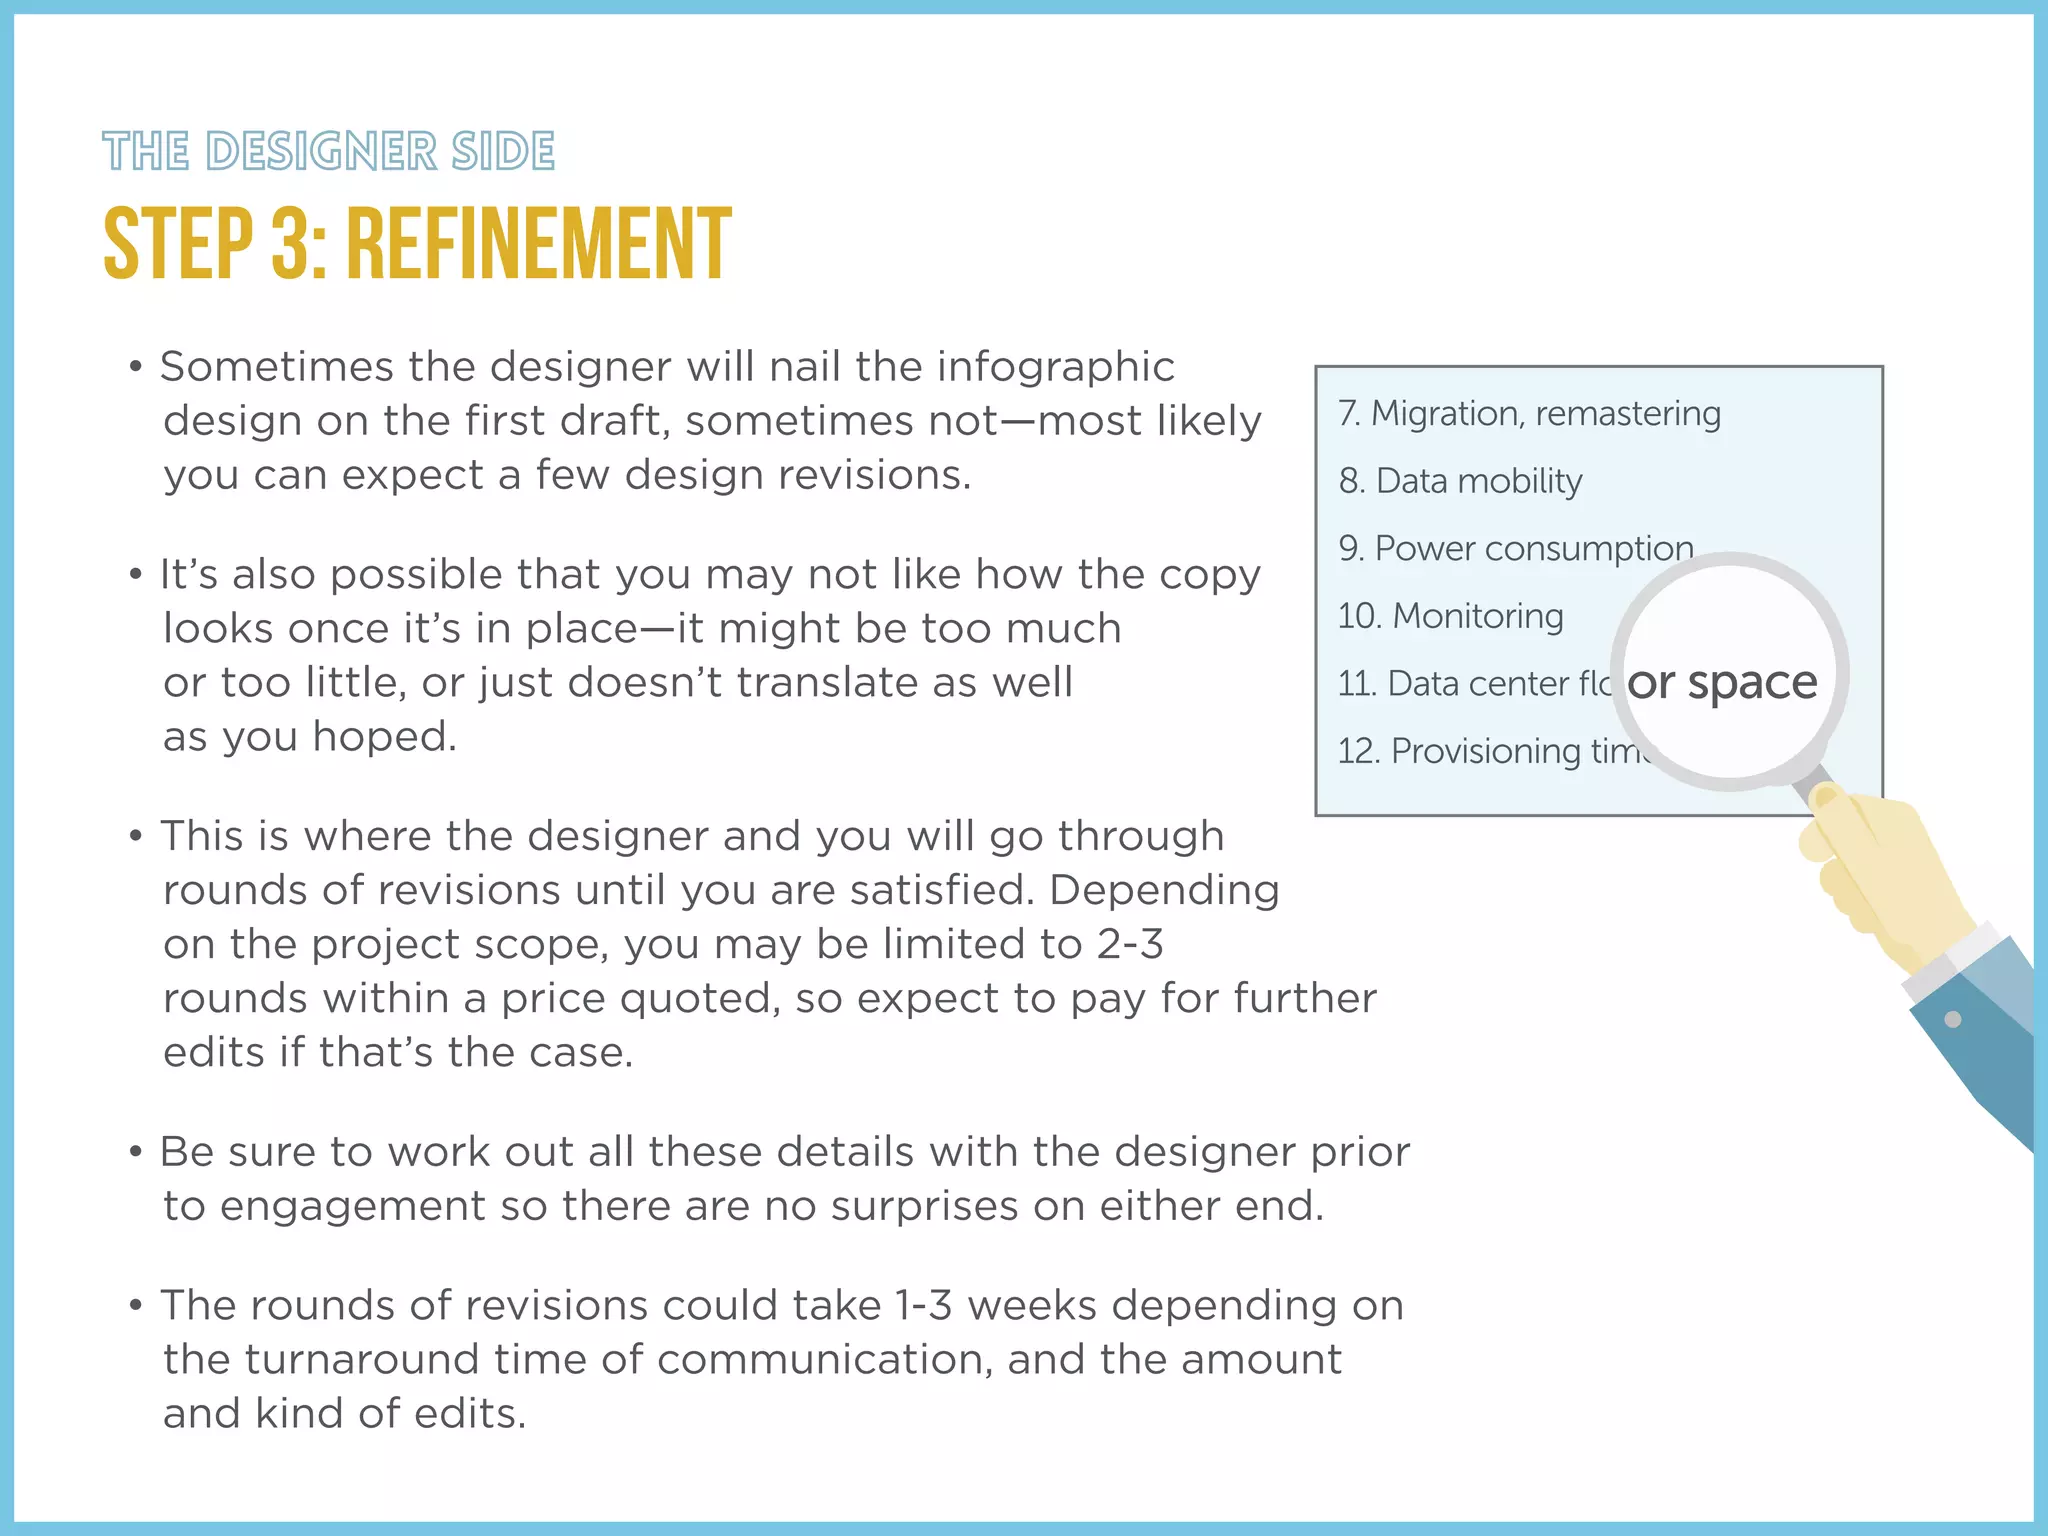
The document provides a step-by-step guide to creating an infographic. It discusses choosing a goal, creating header/body/footer sections, developing a creative brief with the purpose and vision, determining data visualization or narrative styles, designing layouts, revising designs, and sharing the infographic through social media to promote it.
2. • Choose one goal and stay focused on it. If you don’t
have a journalist to write the content for the outline,
it would be in your best interest to hire one.
• There are 3 main sections in an infographic: header,
body and footer. In the header section, you will need
a short, catchy title with about six words, and a title
tag {subtitle} that will summarize the infographic.
• After that, the body is where you tell your story with
the content and graphics that interpret it, divided
into sections, or free-flowing in a directive manner.
• Always follow the body up with a footer that includes
your resources, a sign-off of your company/brand
and most importantly, a call-to-action of some sort.
STEP 1: Content is King
HEADER
BODY
FOOTER
3. • The creative brief is a document that provides
insight into your company, your brand and
the purpose behind the infographic.
• It also explains your ideas, or your vision, of
what you want the infographic to look like.
In order to do that, you need to ask yourself what
kind of infographic best fits your content and brand.
• Determine whether your content needs:
1) Data Visualization: charts and graphs {pie,
pictoral, line, bar} and icons
2) Narrative: guiding the reader through a series
of information that tells a story; or
3) Informational Design: flowcharts, diagrams,
anatomical illustrations
STEP 2: THE Creative Brief
4. • Establish what kind of format/structure the
infographic will have, whether it’s vertical
{recommended} or horizontal; if it’s a timeline,
or free-flowing; or if it needs to be divided up
into sections.
• Lastly, decide on the style/theme of the
infographic— whether you want a corporate,
conservative look; a humorous, cheeky one;
something current and trendy; contains simple
or custom illustrations, photography,
iconography and so on.
STEP 2: THE Creative Brief cont’d
5. STEP 3: Discuss & Brainstorm
• With steps 1 and 2 completed, a kick-off call
about the outline and creative brief with an
experienced infographic designer is crucial.
They will need to understand your brand and
vision, the subject and content so they can
translate your story accurately.
• Sometimes it’s best to brainstorm together with
the designer if you don’t know what you
want—they can assist with the direction.
• Once you are in agreement about the direction,
the design process will begin. However, before
any of that can happen, be sure to arrange a
contract with the designer for a price quote
and terms & conditions.
6. STEP 1: Mood Board & Wireframe
• The preliminary steps to defining the design of
an infographic is in the discovery; creating a
mood board:
1) The color palette: whether it’s from your brand
guidelines or in addition to—or it’s created to fit
the subject and content—a selection of 2-5 colors
will be chosen.
2) Font styles and typefaces: again, if you have
brand guidelines, those fonts will be used; but if
not, up to 3 typefaces will be selected for the
headers, subheads and body of copy.
ABCDEFGHIJKLMN123456789O
ABCDEFGHIJKLMN1234567890
abcdefghijklmn1234567890
7. STEP 1: Mood Board & Wireframe cont’d
3) Illustration or photography style: here again,
this may be based off any brand guidelines; but if
not, a consistent style of imagery will be chosen
where needed within the body content.
• Some designers will sketch out the skeleton of the
layout, called a wireframe. Some may just dive
right into the working file and design as they go,
with the direction in mind.
• It’s up to you and the designer on whether or not
this stage is reviewed together before moving into
the first full draft of the layout. This can help make
sure the direction is agreed upon, conserving
valuable time.
• You can expect to see the mood board and/or
wireframe within 2-3 business days of them
receiving the outline and creative brief.
8. STEP 2: Design & Layout
• Once the mood board and/or wireframe is
signed off by you, the designer will begin with
the layout/design of your infographic according
to the creative brief and outline provided.
• Upon completion they will submit the first full
draft for your review. The design stage typically
takes between 5-7 business days—you can’t
rush creativity!
9. STEP 3: Refinement
• Sometimes the designer will nail the infographic
design on the first draft, sometimes not—most likely
you can expect a few design revisions.
• It’s also possible that you may not like how the copy
looks once it’s in place—it might be too much
or too little, or just doesn’t translate as well
as you hoped.
• This is where the designer and you will go through
rounds of revisions until you are satisfied. Depending
on the project scope, you may be limited to 2-3
rounds within a price quoted, so expect to pay for further
edits if that’s the case.
• Be sure to work out all these details with the designer prior
to engagement so there are no surprises on either end.
• The rounds of revisions could take 1-3 weeks depending on
the turnaround time of communication, and the amount
and kind of edits.
7. Migration, remastering
8. Data mobility
9. Power consumption
10. Monitoring
11. Data center flo
12. Provisioning time
or space
10. STEP 4: DELIVERABLES
• Based on the strategy of the infographic
placement, you will receive the final deliverable
as either a PNG or JPG for posting. PNGs are
best for illustration and text-heavy images. JPGs
are best for photographs and realistic images.
• However, depending on where you post your
infographic, some sites prefer one over the
other, some even require a PDF only. It would be
wise to have a PR/Social Marketing team in
place, if you don’t, to help promote your
infographic across the internet.
11. STEP 1: SHARING IS CARING
• In order to make your infographic to go viral,
make it very easy for people to share, and give
several options.
• Use standard social sharing buttons on your
website or blog page that are easy to view and
use. Also provide a HTML embed code to help
viewers embed your infographic and re-publish
on their own web pages. This gives you quality
linkbacks at no cost to you.
• Submit your infographic to sites such as
Slideshare, Daily Infographic, or Visual.ly who
allow you to easily embed it while linking back to
the original source.
12. STEP 2: SHOUT IT OUT
• Once your infographic is launched, you need
to promote it, and promote it aggressively
using all the social media networks such as
Facebook, Twitter, Google+, Pinterest,
LinkedIn and so on.
• Get your audience engaged. Find your best
influencers, and create a strategy for them to
share your infographic, write about it, and
tweet it out. Make sure your message is
consistent in order to maintain your social
media presence.
• After your infographic goes viral, it will
spread around the web all on it’s own, and
you can sit back and watch.
13. dezinegirlcreative.com
Brand Identity Campaigns | Infographics | Websites
Digital Media Graphics | Print Collateral | Presentations
http://dezinegirlcreative.com/
https://www.facebook.com/DezinegirlCreativeStudio https://twitter.com/dezinegirl https://www.linkedin.com/in/dezinegirl https://www.behance.net/dezinegirl http://www.pinterest.com/dezinegirl http://visual.ly/users/dezinegirl
Contact dezinegirl creative studio
for your next amazing infographic!
Try to set realistic expectations for your infographic. You may have a great
idea, or content, or even a quality designed infographic, but this doesn’t
necessarily mean it will go viral or double your sales. Proper distribution is
key. And working with an experienced designer is part of the equation for a
successful infographic.