Technical Report - August 25, 2010
•
0 likes•85 views

The document provides a market summary for the day, including key indices levels, top gainers and losers, sectoral performance, and a technical outlook. Some of the key details include: - The Nifty and Sensex closed lower by 0.69% and 0.53% respectively. - Cairn, RCOM, and Bharti Airtel were among the top gainers, while Idea, Hindalco, and Sterlite were among the top losers. - Sectoral performances were mixed with CD and FMCG gaining while realty saw the largest losses. - The technical outlook remains cautiously optimistic, expecting support around current levels and resistance in the 18,380-18,

Recommended
More Related Content
What's hot
What's hot (20)
Viewers also liked
Viewers also liked (20)
Similar to Technical Report - August 25, 2010
Similar to Technical Report - August 25, 2010 (14)
More from Angel Broking
More from Angel Broking (20)
Recently uploaded
Recently uploaded (20)
Technical Report - August 25, 2010
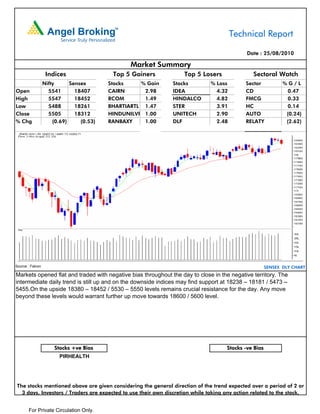
- 1. Technical Report Date : 25/08/2010 Market Summary Indices Top 5 Gainers Top 5 Losers Sectoral Watch Nifty Sensex Stocks % Gain Stocks % Loss Sector %G/L Open 5541 18407 CAIRN 2.98 IDEA 4.32 CD 0.47 High 5547 18452 RCOM 1.49 HINDALCO 4.82 FMCG 0.33 Low 5488 18261 BHARTIARTL 1.47 STER 3.91 HC 0.14 Close 5505 18312 HINDUNILVR 1.00 UNITECH 2.90 AUTO (0.24) % Chg (0.69) (0.53) RANBAXY 1.00 DLF 2.48 RELATY (2.62) Source : Falcon SENSEX DLY CHART Markets opened flat and traded with negative bias throughout the day to close in the negative territory. The intermediate daily trend is still up and on the downside indices may find support at 18238 – 18181 / 5473 – 5455.On the upside 18380 – 18452 / 5530 – 5550 levels remains crucial resistance for the day. Any move beyond these levels would warrant further up move towards 18600 / 5600 level. Stocks +ve Bias Stocks -ve Bias PIRHEALTH The stocks mentioned above are given considering the general direction of the trend expected over a period of 2 or 3 days. Investors / Traders are expected to use their own discretion while taking any action related to the stock. For Private Circulation Only.
- 2. Technical Report PIVOTS Stocks Close S2 S1 Pivot R1 R2 SENSEX 18312.00 18150.00 18231.00 18341.00 18422.00 18532.00 NIFTY 5505.00 5455.00 5480.00 5514.00 5539.00 5572.00 ABB 764.00 742.00 753.00 769.00 780.00 796.00 ACC 866.00 849.00 858.00 869.00 877.00 888.00 AMBUJACEM 121.00 118.00 120.00 121.00 123.00 124.00 AXISBANK 1372.00 1345.00 1358.00 1372.00 1385.00 1399.00 BHARTIARTL 323.00 313.00 318.00 322.00 327.00 330.00 BHEL 2484.00 2451.00 2467.00 2496.00 2512.00 2541.00 BPCL 760.00 729.00 745.00 771.00 787.00 813.00 CAIRN 354.00 336.00 345.00 354.00 364.00 373.00 CIPLA 317.00 310.00 313.00 317.00 321.00 324.00 DLF 322.00 314.00 318.00 325.00 329.00 336.00 GAIL 455.00 445.00 450.00 459.00 464.00 473.00 HCLTECH 409.00 401.00 405.00 408.00 413.00 416.00 HDFC 624.00 608.00 616.00 624.00 633.00 641.00 HDFCBANK 2209.00 2136.00 2173.00 2196.00 2232.00 2256.00 HEROHONDA 1890.00 1855.00 1872.00 1903.00 1920.00 1951.00 HINDALCO 169.00 162.00 165.00 171.00 174.00 180.00 HINDUNILVR 270.00 265.00 267.00 270.00 272.00 274.00 ICICIBANK 1002.00 982.00 992.00 1008.00 1018.00 1034.00 IDEA 68.00 65.00 67.00 69.00 70.00 72.00 IDFC 187.00 183.00 185.00 187.00 189.00 191.00 INFOSYSTCH 2765.00 2736.00 2751.00 2770.00 2784.00 2804.00 ITC 160.00 157.00 159.00 160.00 161.00 163.00 JINDALSTEL 698.00 684.00 691.00 702.00 709.00 721.00 JPASSOCIAT 118.00 116.00 117.00 119.00 121.00 123.00 KOTAKBANK 858.00 837.00 848.00 863.00 873.00 888.00 LT 1861.00 1833.00 1847.00 1865.00 1878.00 1896.00 M&M 616.00 604.00 610.00 620.00 626.00 636.00 MARUTI 1233.00 1208.00 1220.00 1238.00 1250.00 1268.00 NTPC 194.00 191.00 192.00 194.00 196.00 198.00 ONGC 1273.00 1250.00 1261.00 1276.00 1288.00 1303.00 PNB 1188.00 1167.00 1177.00 1193.00 1203.00 1219.00 POWERGRID 103.00 101.00 102.00 104.00 104.00 106.00 RANBAXY 494.00 468.00 481.00 491.00 504.00 514.00 RCOM 166.00 161.00 164.00 166.00 168.00 170.00 RELCAPITAL 778.00 760.00 769.00 779.00 788.00 798.00 RELIANCE 972.00 960.00 966.00 974.00 980.00 987.00 RELINFRA 1024.00 1000.00 1012.00 1033.00 1045.00 1066.00 RPOWER 154.00 152.00 153.00 154.00 155.00 156.00 SAIL 190.00 186.00 188.00 190.00 192.00 194.00 SBIN 2846.00 2774.00 2810.00 2832.00 2868.00 2891.00 SIEMENS 715.00 707.00 711.00 715.00 719.00 724.00 STER 152.00 145.00 149.00 154.00 158.00 163.00 SUNPHARMA 1788.00 1758.00 1773.00 1790.00 1805.00 1823.00 SUZLON 50.00 48.00 49.00 50.00 51.00 53.00 TATAMOTORS 1012.00 1000.00 1006.00 1013.00 1019.00 1026.00 TATAPOWER 1279.00 1264.00 1272.00 1283.00 1290.00 1301.00 TATASTEEL 514.00 501.00 507.00 517.00 523.00 532.00 TCS 871.00 856.00 863.00 873.00 880.00 889.00 UNITECH 84.00 81.00 82.00 84.00 86.00 88.00 WIPRO 408.00 402.00 405.00 410.00 413.00 419.00 For Private Circulation Only.
- 3. Technical Report RESEARCH TEAM Shardul Kulkarni Head - Technicals Brijesh Ail Technical Analyst Mileen Vasudeo Technical Analyst For any Queries, Suggestions and Feedback kindly mail to vasudeo.kamalakant@angeltrade.com Research Team: 022-3952 6600 Website: www.angelbroking.com DISCLAIMER: This document is not for public distribution and has been furnished to you solely for your information and must not be reproduced or redistributed to any other person. Persons into whose possession this document may come are required to observe these restrictions. Opinion expressed is our current opinion as of the date appearing on this material only. While we endeavor to update on a reasonable basis the information discussed in this material, there may be regulatory, compliance, or other reasons that prevent us from doing so. Prospective investors and others are cautioned that any forward-looking statements are not predictions and may be subject to change without notice. Our proprietary trading and investment businesses may make investment decisions that are inconsistent with the recommendations expressed herein. The information in this document has been printed on the basis of publicly available information, internal data and other reliable sources believed to be true and are for general guidance only. While every effort is made to ensure the accuracy and completeness of information contained, the company takes no guarantee and assumes no liability for any errors or omissions of the information. No one can use the information as the basis for any claim, demand or cause of action. Recipients of this material should rely on their own investigations and take their own professional advice. Each recipient of this document should make such investigations as it deems necessary to arrive at an independent evaluation of an investment in the securities of companies referred to in this document (including the merits and risks involved), and should consult their own advisors to determine the merits and risks of such an investment. Price and value of the investments referred to in this material may go up or down. Past performance is not a guide for future performance. Certain transactions - futures, options and other derivatives as well as non-investment grade securities - involve substantial risks and are not suitable for all investors. Reports based on technical analysis centers on studying charts of a stock's price movement and trading volume, as opposed to focusing on a company's fundamentals and as such, may not match with a report on a company's fundamentals. We do not undertake to advise you as to any change of our views expressed in this document. While we would endeavor to update the information herein on a reasonable basis, Angel Broking, its subsidiaries and associated companies, their directors and employees are under no obligation to update or keep the information current. Also there may be regulatory, compliance, or other reasons that may prevent Angel Broking and affiliates from doing so. Prospective investors and others are cautioned that any forward-looking statements are not predictions and may be subject to change without notice. Angel Broking Limited and affiliates, including the analyst who has issued this report, may, on the date of this report, and from time to time, have long or short positions in, and buy or sell the securities of the companies mentioned herein or engage in any other transaction involving such securities and earn brokerage or compensation or act as advisor or have other potential conflict of interest with respect to company/ies mentioned herein or inconsistent with any recommendation and related information and opinions. Angel Broking Limited and affiliates may seek to provide or have engaged in providing corporate finance, investment banking or other advisory services in a merger or specific transaction to the companies referred to in this report, as on the date of this report or in the past. Sebi Registration No : INB 010996539 For Private Circulation Only.