Downloaded 16 times


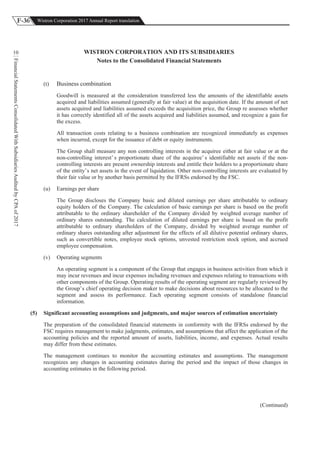
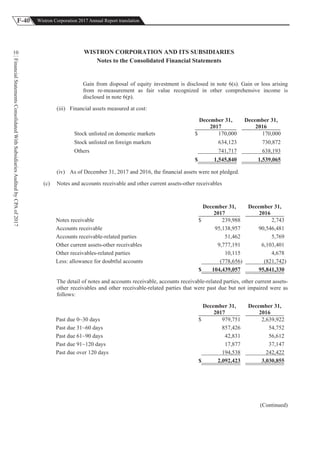
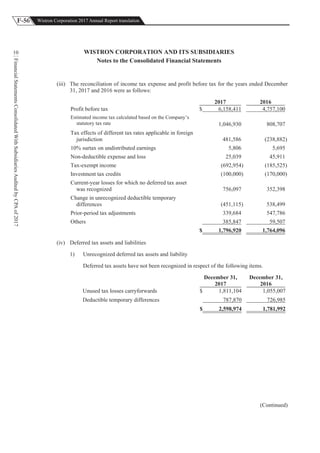
![73Wistron Corporation 2017 Annual Report translation
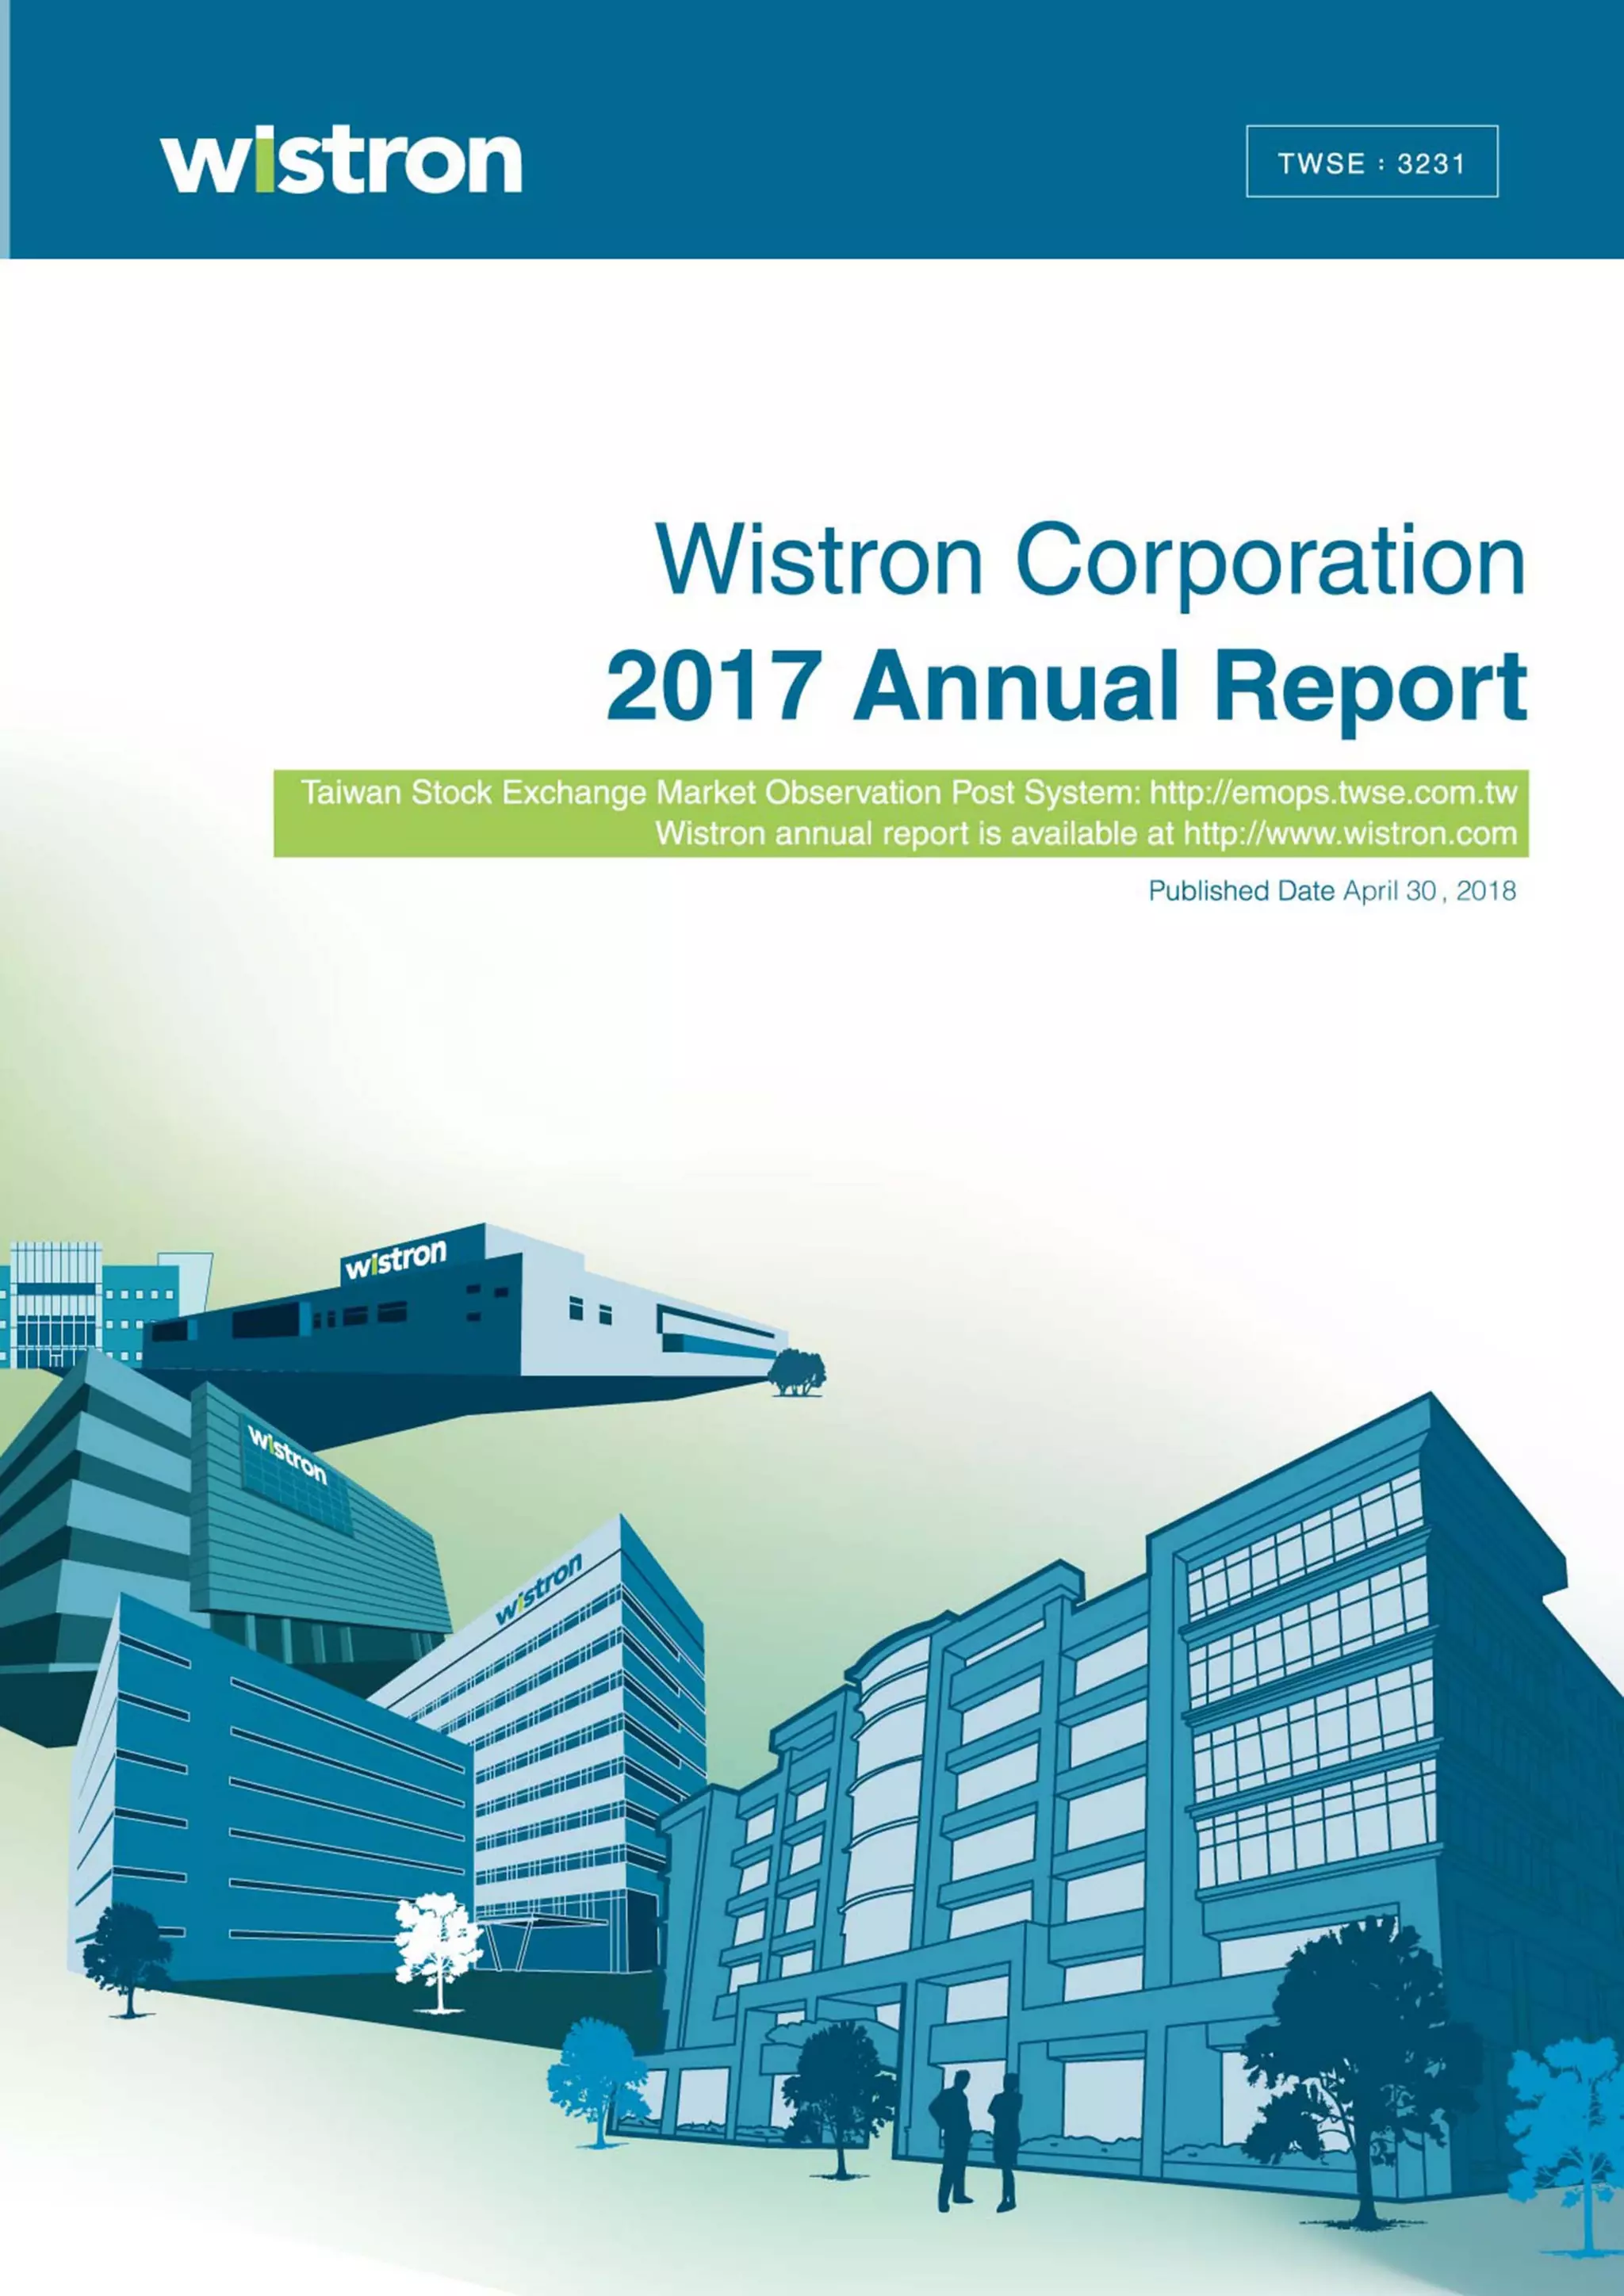
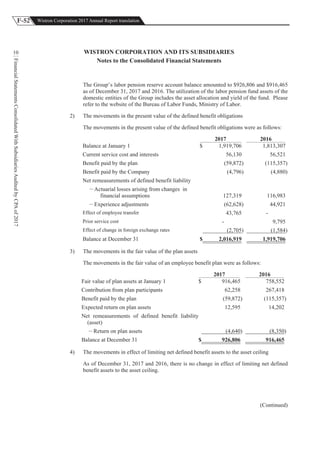
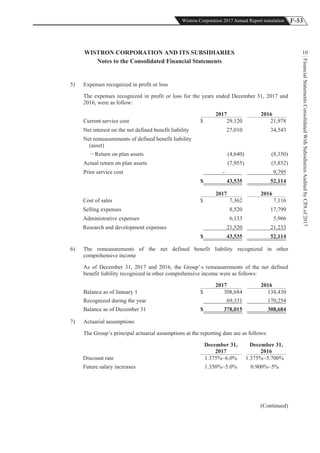
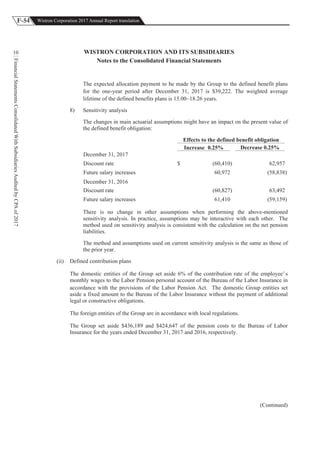
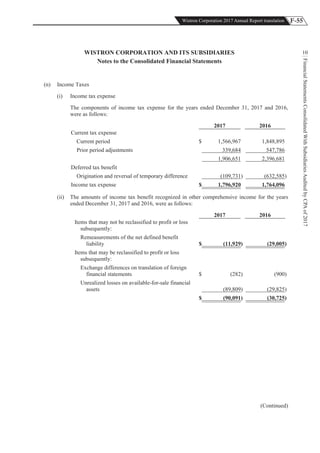
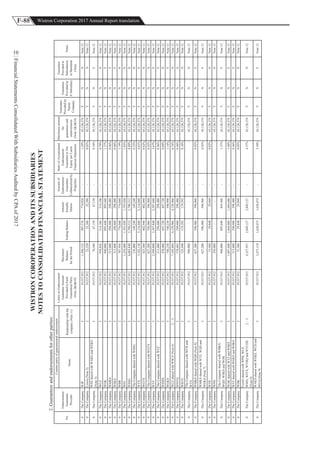
FinancialStanding
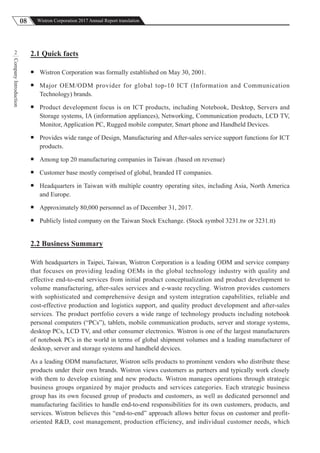
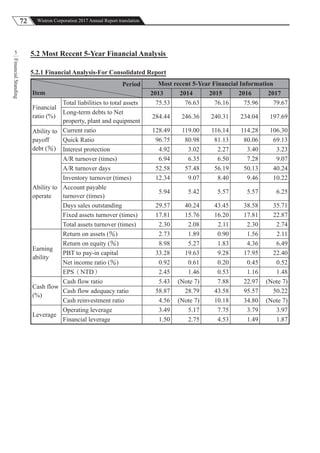
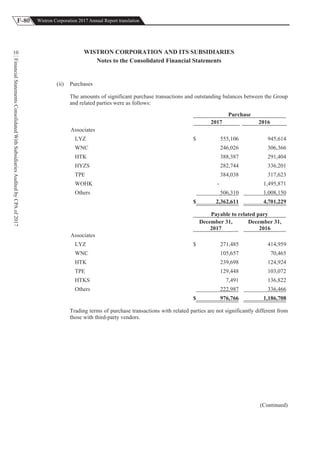
5Note :
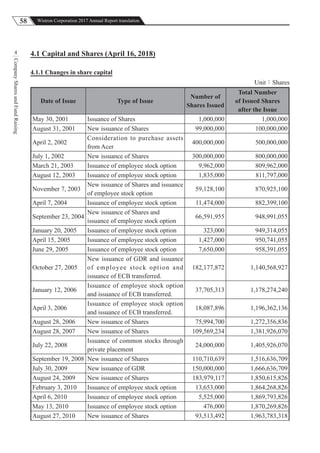
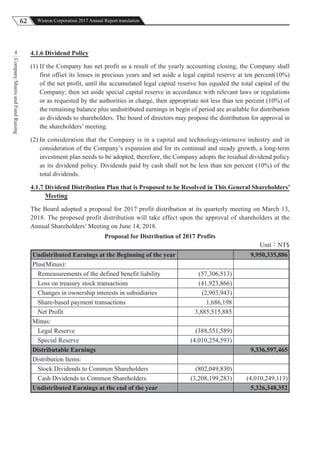
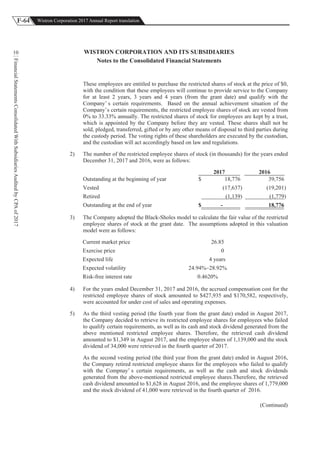
1. Financial Ratio
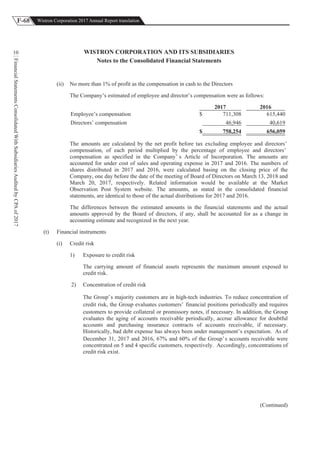
(1) Total liabilities to Total assets=Total liabilities/Total assets
(2) Long-term fund to property, plant and equipment=(Net equity+Non-current liabilities)/Net property, plant and
equipment
2. Ability to Pay off Debt
(1) Current ratio=Current Assets/Current liability
(2) Quick ratio=(Current assets-Inventory-Prepaid expenses)/Current liability
(3) Interest protection=Net income before income tax and interest expense/Interest expense
3. Ability to Operate
(1) Account receivable (including account receivable and notes receivable from operation) turnover=Net sales/the
Average of account receivable (including account receivable and notes receivable from operation) balance
(2) A/R turnover day=365/account receivable turnover
(3) Inventory turnover=Cost of Goods Sold/the average of inventory
(4) Account payable (including account payable and notes payable from operation)turnover=Cost of goods sold/
the average of account payable (including account payable and notes payable from operation) balance
(5) Inventory turnover day=365/Inventory turnover
(6) Fixed assets turnover=Net sales/Net Fixed Assets
(7) Total assets turnover=Net sales/Total assets
4. Earning Ability
(1) Return on assets=[PAT+Interest expense × (1-effective tax rate)]/the average of total assets
(2) Return on equity=PAT/the average of net equity
(3) Net income ratio=PAT/Net sates
(4) EPS =(Profit attributable to owners of the Company- Dividend from prefer stock)/weighted average
outstanding shares
5. Cash Flow
(1) Cash flow ratio=Cash flow from operating activities/Current liability
(2) Cash flow adequacy ratio=Most recent 5-year Cash flow from operating activities/Most recent 5-year (Capital
expenditure+the increase of inventory+cash dividend)
(3) Cash investment ratio=(Cash flow from operating activities-cash dividend) /(Gross property, plant and
equipment+long-term investment+other non-current assets+working capital)
6. Leverage
(1) Operating leverage=(Nest revenue-variable cost of goods sold and operating expense)/operating income
(2) Financial leverage=Operating income/(Operating income-interest expenses)
7. The analysis of negative cash flow from operating activities is meaningless.](https://image.slidesharecdn.com/3-181129185541/85/Wistron-Corporation-Annual-Report-2017-73-320.jpg)
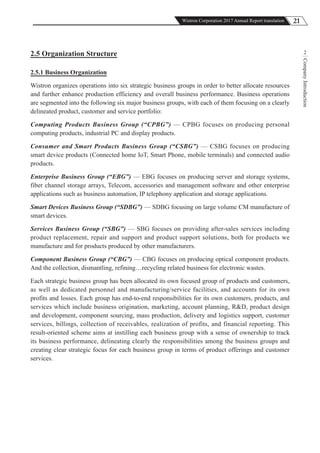
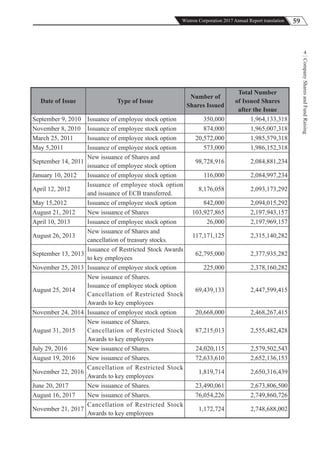
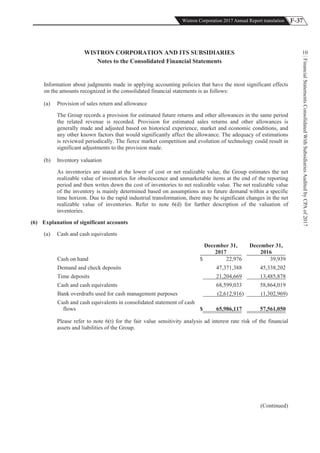
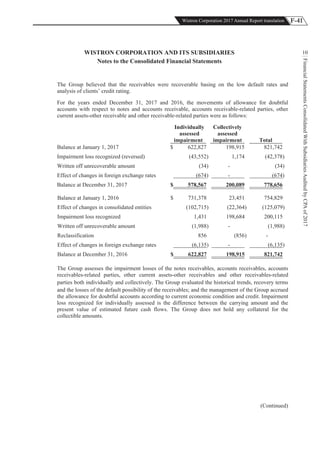
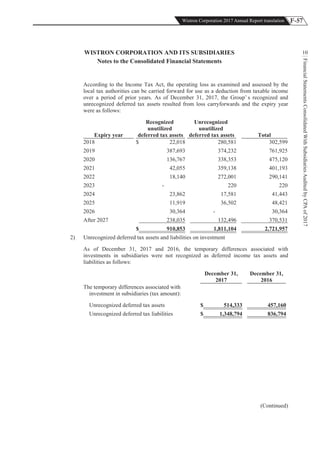
![75Wistron Corporation 2017 Annual Report translation
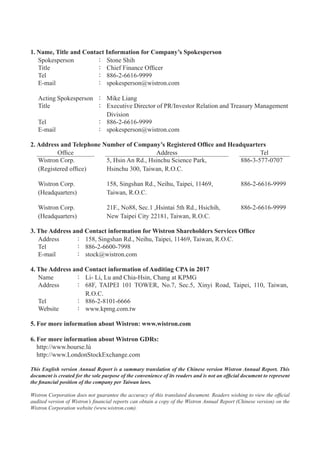
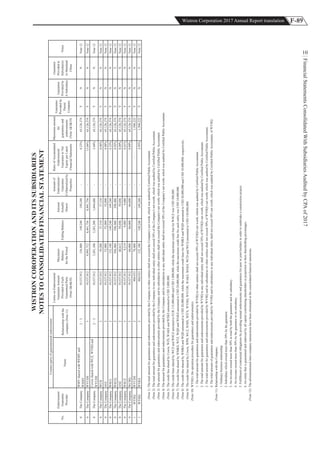
FinancialStanding
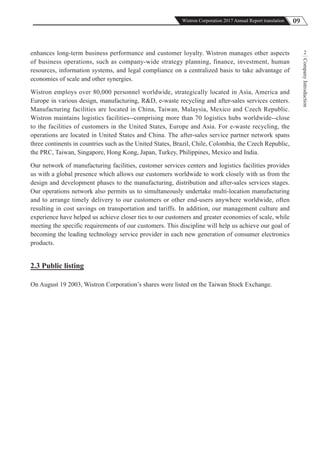
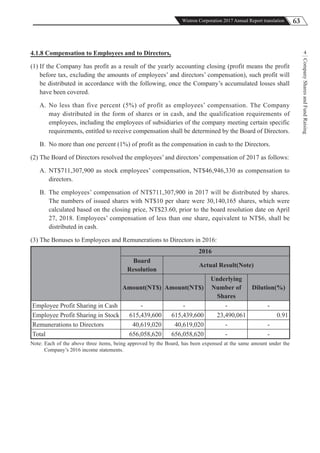
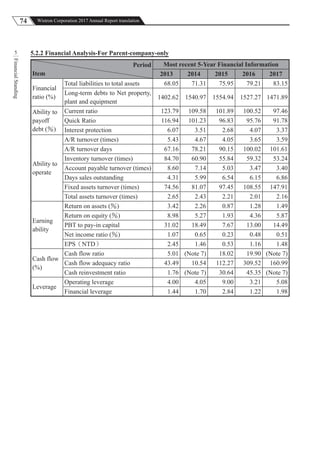
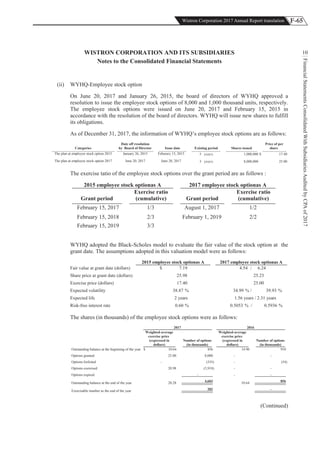
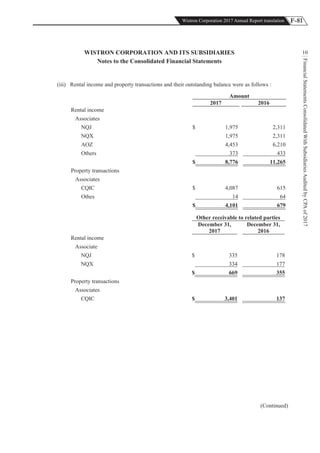
5Note :
1. Financial Ratio
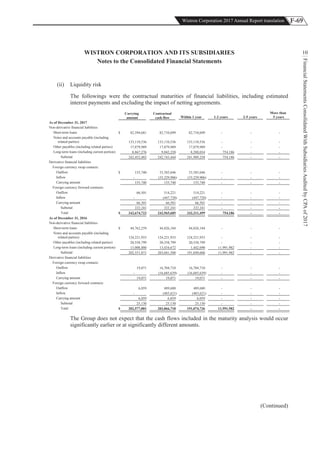
(1) Total liabilities to Total assets=Total liabilities/Total assets
(2) Long-term fund to property, plant and equipment=(Net equity+Non-current liabilities)/Net property, plant and
equipment
2. Ability to Pay off Debt
(1) Current ratio=Current Assets/Current liability
(2) Quick ratio=(Current assets-Inventory-Prepaid expenses)/Current liability
(3) Interest protection=Net income before income tax and interest expense/Interest expense
3. Ability to Operate
(1) Account receivable (including account receivable and notes receivable from operation) turnover=Net sales/the
Average of account receivable (including account receivable and notes receivable from operation) balance
(2) A/R turnover day=365/account receivable turnover
(3) Inventory turnover=Cost of Goods Sold/the average of inventory
(4) Account payable (including account payable and notes payable from operation)turnover=Cost of goods sold/
the average of account payable (including account payable and notes payable from operation) balance
(5) Inventory turnover day=365/Inventory turnover
(6) Fixed assets turnover=Net sales/Net Fixed Assets
(7) Total assets turnover=Net sales/Total assets
4. Earning Ability
(1) Return on assets=[PAT+Interest expense × (1-effective tax rate)]/the average of total assets
(2) Return on equity=PAT/the average of net equity
(3) Net income ratio=PAT/Net sates
(4) EPS =(PAT- Dividend from prefer stock)/weighted average outstanding shares
5. Cash Flow
(1) Cash flow ratio=Cash flow from operating activities/Current liability
(2) Cash flow adequacy ratio=Most recent 5-year Cash flow from operating activities/Most recent 5-year (Capital
expenditure+the increase of inventory+cash dividend)
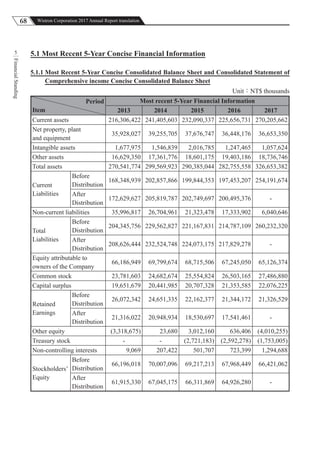
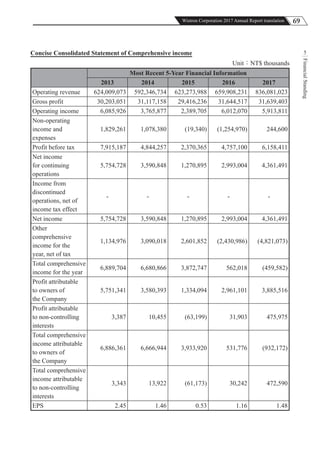
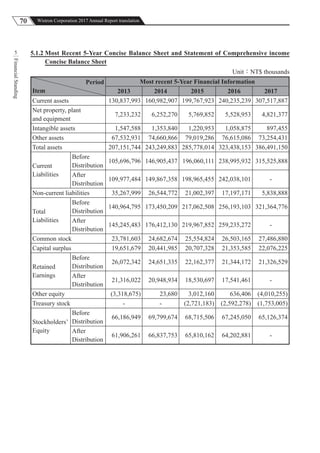
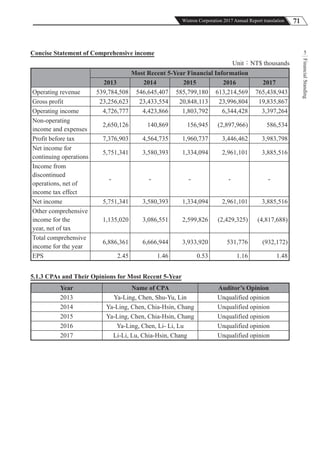
(3) Cash investment ratio=(Cash flow from operating activities-cash dividend) /(Gross property, plant and
equipment+long-term investment+other non-current assets+working capital)
6. Leverage
(1) Operating leverage=(Nest revenue-variable cost of goods sold and operating expense)/operating income
(2) Financial leverage=Operating income/(Operating income-interest expenses)
7. The analysis of negative cash flow from operating activities is meaningless.](https://image.slidesharecdn.com/3-181129185541/85/Wistron-Corporation-Annual-Report-2017-75-320.jpg)

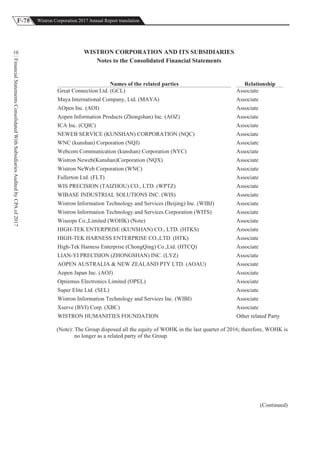
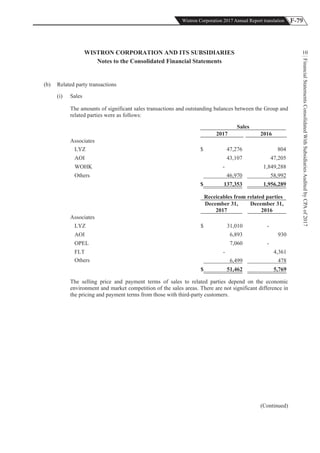
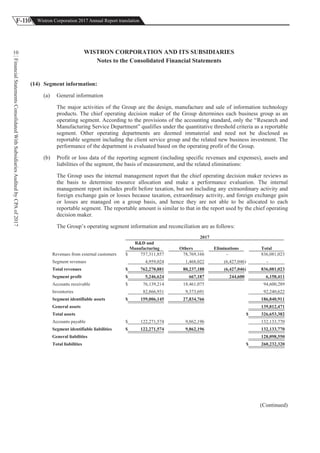
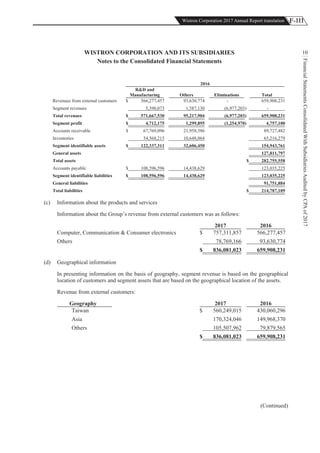


The document details Wistron Corporation's 2017 annual report, outlining key contact information, company structure, operational performance, and financial results, including record revenue of NT$836.1 billion. It discusses strategies for future growth, focusing on digital transformation and expansion into new business areas like cloud services and IoT, while emphasizing corporate governance and social responsibility. Additionally, the report highlights Wistron's extensive global operations and its role as a major ODM provider in the ICT sector.


