7. Contents
Foreword vii
Preface xv
List of Contributors xix
1 Introduction 1
2 Evaluation of Articles on Therapy 15
3 Evaluation of Articles on Diagnosis 45
4 Evaluation of Articles on Harm 67
5 Evaluation of Articles on Prognosis 85
6 Evaluation of Systematic Reviews 99
7 Literature Searches 115
Index 137
9. Foreword
No clinician would consider entering clinical practice without
knowing the rudiments of history-taking and physical examina-
tion. Nor would clinicians consider independent practice without
a basic understanding of how the drugs they prescribe act on
their patients. Yet, traditionally, clinicians have started practice
without an ability to understand evidence about how they should
interpret what they find on history and physical examination, or
the magnitude of the effects they might expect when they offer
patients medication.
Evidence-based medicine (EBM) provides a remedy for this
problem. The movement to teach clinicians to become effec-
tive users of medical literature began in the 1970s and evolved
through the 1980s into a whole system for the delivery of clin-
ical care. We needed a name for this new way of practice and
the term ‘evidence-based medicine’, which first appeared in the
medical literature in 19911
proved extremely popular. Over the
subsequent 16 years evidence-based medicine has evolved and
now represents not only an approach to using the medical liter-
ature effectively, but a principled guide for the process of clinical
decision-making.
Members of the general public are surprised, and often
appalled, when they learn that most physicians remain unable
10. viii FOREWORD
to critically read an original research article or fully understand
the results reported there. For the physician, inability to critically
appraise a research study and grasp all that is implied in its find-
ings limits their independence. The result is reliance on expert
opinion, the practices of colleagues and on information from the
pharmaceutical industry. But what is one to do if experts and
colleagues disagree, or if one is mistrustful of the enthusiastic
advice from a pharmaceutical industry representative?
This book represents the key to a world that provides the
answer to that question, a world that has traditionally been closed
to most practising physicians: the world of original medical liter-
ature. Opening the door to this world is enormously empow-
ering. No longer must one choose what to believe on the basis
of which recommendation is backed by the most authority, or
speaks with the loudest voice. The ability to differentiate high
from low quality evidence and large treatment effects from small
allows clinicians to make independent judgements about what is
best for their patients. It also allows them to explain the impact
of alternatives to the patients themselves, and thus to ensure
that choices are consistent with patients’ underlying values and
preferences.
Ten years ago, experts and the official voices of the organi-
zations to which they belonged consistently recommended long-
term hormone replacement therapy (HRT) for post-menopausal
women. These recommendations were made largely on the basis
of observational studies suggesting that women taking HRT could
expect large reductions to their risk of major cardiovascular
events. Proponents of evidence-based medicine raised concerns
about the wisdom of this strong advocacy of therapy for huge
populations on the basis of the fundamentally weak methods
of observational studies. Their voices were largely ignored, until
randomized trials demonstrated that the results of the observa-
tional studies were incorrect. If HRT has any impact on cardio-
vascular disease at all, it is to increase its frequency.
11. FOREWORD ix
Many clinical communities now endorse widespread popu-
lation screening to prevent the occurrence of cancer and
cardiovascular disease. Breast cancer screening for women as
young as 40 years, colon cancer screening for entire populations
and treatment to improve lipid profiles even in very low risk
patients are widely advocated. Many clinicians are unaware that
to prolong a single life, hundreds of individuals must be screened
for breast or colon cancer or treated with lipid profile-modifying
agents for periods of up to a decade. The costs include anxiety
as a result of the many false positive results, complications of
invasive procedures such as lumpectomy or colonoscopy, side
effects of treatment (including deaths as a result of a lipid-
lowering agent now withdrawn from the market) and resource
investment that, at least for some individuals, might be better
allocated elsewhere. The point is not that the experts were
uniformly wrong in suggesting that women consider HRT, nor
that screening or treatment of low-risk individuals to modify
their cancer or coronary risk is wrong. Rather, it is that clinicians
should be aware there are important trade-offs in these decisions.
If clinicians don’t know the difference between an observational
study and a randomized trial, or between a relative risk reduction
and a risk difference, they are in no position to understand these
trade-offs. If they are unable to understand the trade-offs, it is
not possible for them to convey the possible benefits and risks
to their patients, many of whom may, with a full understanding,
decline screening or treatment.
This book provides the basic tools for the clinician to evaluate
the strength of original studies, to understand their results and to
apply those results in day-to-day clinical practice. I am delighted
to inform the reader that its editors are not only brilliant teachers
who have created a wonderful introductory text, but wonderful
human beings. I met Tony and Inday Dans just about the time
that our McMaster group was realizing that what we had been
calling ‘critical appraisal’ had evolved into a systematic approach
12. x FOREWORD
to medical practice, a system of thinking about clinical care and
clinical decision-making.
Inday and Tony had come to McMaster to train in clin-
ical epidemiology – the science that underlies evidence-based
medicine. I had the great pleasure of working with both these
brilliant, enthusiastic and critical young people. I was extremely
fortunate that Tony chose me as one of his supervisors, and
as a result we had the opportunity to work particularly closely
together. It was not long before I discovered that I had the priv-
ilege of interacting with an extraordinary individual, exceptional
even among the lively, intelligent, dedicated students who popu-
lated our Masters program. Tony was far more questioning than
most students, and possessed a far deeper and more intense social
conscience. To me, these qualities were very striking.
Since their days at McMaster, Inday and Tony have continued
to demonstrate their high intelligence, tremendous initiative,
extraordinary ability to question and explore issues at the
deepest level and their unusual and extremely admirable social
conscience. Having a social conscience leads you to challenge
existing power structures and vested interests. Doing so requires
more than conscience: it requires courage. I have had the good
fortune and great pleasure to interact with Inday and Tony in
a variety of settings at quite regular intervals, and have as a
result seen first-hand how their courage has led them to repeat-
edly challenge authority and power, acting in the interests of
the Philippine people. To use the adjective preferred by young
Canadians nowadays, their performance has been consistently
awesome.
I will add one final anecdote about what makes Tony and
Inday so special. Each year, we conduct a ‘how to teach evidence-
based medicine’ workshop at McMaster. In the last few years,
Tony and Inday have participated in the workshop in the role of
tutor trainees. Almost all participants in the workshop feel they
learn a great deal, and take elements of what they have discovered
13. FOREWORD xi
back to their own teaching settings. But very few, and extremely
few among the very experienced, make major innovations in
their teaching as a result. Despite having run literally dozens of
extremely successful workshops in the Philippines prior to their
participation in the McMaster workshop, Inday and Tony took
the key elements of the McMaster strategy and revamped their
approach to their own workshops. The result has been a spectac-
ular success, with Philippine participants reporting profoundly
positive educational experiences. In the two decades in which I
have participated in our workshop, I’ve never seen anyone make
as good use of their experience with us. The message about Tony
and Inday: a tremendous openness and ability to integrate what
they’ve learned and apply in imaginative and perspicacious ways
in their own setting.
One fortunate consequence of Inday and Tony’s brilliant
teaching – which makes the presentation of this book so vividly
clear – is that it inspires others. About ten years ago Mianne
Silvestre, a neonatologist, attended one of the Dans’ workshops
and emerged as an EBM enthusiast. She took on a teaching role
and emerged as one of the most effective EBM facilitators in the
Philippines. Her insights and experience have also contributed to
the lucid presentations in this text.
We shall now take advantage of Inday, Tony and Mianne’s
enormous experience of EBM and their imagination and brilliant
teaching abilities in this wonderful book. The title ‘Painless EBM’
captures the essence of their work. They have presented chal-
lenging concepts in simple, clear and extremely appealing ways
which make learning EBM painless and enjoyable. They have
emphasized the last of the three pillars of the EBM approach:
while the book tells you about validity and understanding the
results, the focus is on applicability. What is the meaning of the
evidence? How can you apply it in your own setting? How can you
apply the evidence to patients with very different circumstances
and varying values and preferences?
14. xii FOREWORD
Increasingly, applying the literature to clinical practice does
not mean a detailed reading of a large number of original studies.
Rather, the clinician can recognize valid pre-appraised resources
and differentiate them from poorly substantiated opinion. The
book provides guides for assessing not only original studies of
diagnosis and therapy, but also systematic reviews which summa-
rize a number of such original studies. The ability to differ-
entiate strong from weak literature reviews and to understand
summaries of the magnitude of treatment effects is crucial for
efficient evidence-based practice.
When a new pivotal study comes to light, evidence-based clin-
icians do not need to read it in detail to evaluate its significance
or to decide how to use its results. Imagine that I am telling you
about a recently conducted study reporting an apparently impor-
tant treatment effect. I tell you: that the study was a random-
ized trial and that randomization was adequately concealed;
that patients, caregivers and those collecting and adjudicating
outcome data were blind to whether patients received treatment
or control interventions; that investigators successfully followed
all patients who were randomized; and that, in the analysis, all
patients were included in the groups to which they were random-
ized. Assuming that I am skilled in making these judgements, and
am telling you the truth, you have all the information you need
to judge the validity of the study. If I then provide you with a few
crucial details of who was enrolled, how the interventions were
administered and the magnitude and precision of estimates of the
impact of the intervention on all patient-relevant outcomes, you
have everything you need to apply the results in clinical practice.
Synopses of individual studies which provide the crucial
information needed to understand the appropriate strength of
inference to apply the results are increasingly available, as are
systematic reviews and, to a lesser extent, high quality evidence-
based practice guidelines. Entire systems of knowledge based
on evidence-based principles and textbooks of evidence-based
15. FOREWORD xiii
medicine are beginning to arrive. The innovative electronic text
UpToDate is an example of a resource that strives to be fully
evidence-based and to provide guidance for most dilemmas that
clinicians face in practice; UpToDate is effective in meeting both
these aims.
When you, as a clinician, have read and digested the current
text, you will have the tools to read and interpret synopses and
systematic reviews and will be able to find such pearls in the
rocky landscape of the current medical literature. In this text
you will find case studies and examples directly relevant to your
area of clinical practice. More importantly, you will find true-
to-life examples of how to address the daily patient dilemmas
you face more effectively. You will find clinical practice more
satisfying and, most important, you will be more confident in
providing your patients with optimal medical care. Finally, if
you are interested in a deeper understanding of EBM, this book
provides a stepping stone to a more comprehensive text that can
provide knowledge and skills required for not only the practice,
but also the teaching of EBM2
.
It has been my privilege and joy to reflect on EBM in the
context of this wonderful book, prepared by two of my dear
friends and their outstanding colleague.
Gordon Guyatt, MD
McMaster University
References
[1] Evidence-Based Medicine Working Group. 1992. Evidence-based
medicine. A new approach to teaching the practice of medicine. Journal
of the American Medical Association. 268(17): 2420–2425.
[2] Guyatt G and Rennie D (eds.) 2002. The Users’ Guides to the Medical
Literature: A Manual for Evidence-Based Clinical Practice. AMA publica-
tions: Chicago, Illinois.
17. Preface
Inday (Leonila) and I finished our Masters Degrees in Clin-
ical Epidemiology at the McMaster University Medical Center
in Ontario in 1991. Since then, our lives have never been the
same. The learning culture was unusual at Mac. Education was
casual and fun, self-directed and interactive – very different from
the serious, didactic, teacher-directed learning that characterized
the region where we came from. Distinguished faculty insisted
on being called by their first names, rather than ‘professor’ or
‘doctor’. This was difficult for us at first, but soon we began to
understand: at Mac, there was only a grey line separating students
and teachers.
In the midst of what, for us, was a novel learning environment,
we had the great fortune of meeting pioneers in the field of
Clinical Epidemiology such as Gordon Guyatt, Brian Haynes,
Andy Oxman, Dave Sackett and Peter Tugwell. If there was one
thing we brought home from interacting with these professors,
it was a passion for lifelong learning. Although the term had
not yet been coined, they developed and taught the rudiments
of evidence-based medicine: the process of updating one’s self
to ensure that patients receive not just the latest, but the best
medical care.
On our return to the Philippines from the idyllic world of
McMaster, we encountered overwhelming obstacles to practising
18. xvi PREFACE
and teaching what we had learned. The infrastructure was not
ready for EBM; there was no internet nor e-mail, MEDLINE was
not accessible and our medical library at the university seemed
like a newspaper stand compared to the library at McMaster.
Yes, we worked in an academic setting, but that too was not
ready to accept a way of thinking that challenged the status quo.
Traditional ‘experts’ felt threatened by EBM, and clinicians were
bewildered by the onslaught of alien epidemiologic terms.
To make matters worse, we grappled constantly with the
problem of applicability of research conducted in other countries.
When are such results applicable to the patients we see? Should we
always insist on local studies? What criteria do we use to decide?
We had many questions, and hardly any answers. Although the
books we brought home from McMaster did not have the solu-
tions, the curiosity we had developed and the creativity we had
learned from our mentors there helped us think through the
problem. In 1998, with much encouragement and guidance from
Gordon Guyatt, we wrote an article on the applicability of clin-
ical trials: our own contribution to the Journal of American
Medical Association (JAMA) series of User’s Guides to Reading
the Medical Literature1
. Since then, we have developed guides
on the applicability of other study designs. We share many of
them for the first time in this book.
Another problem which we encountered in trying to teach
EBM was the discovery that, unlike healthcare providers in North
America, those in developing countries were unable to spare a
lot of time reading thick books, listening to long explanations
of different concepts of EBM, or attending lengthy workshops
or seminars. They didn’t want 5-day workshops; they wanted
1-hour lectures. They didn’t want a 500-page dissertation; they
wanted brief material that could be read in just a few hours. Of
course, we insisted on a compromise. Most workshops which we
conducted in the 1990s lasted an average of 2 days and the reading
material was at least 25 pages. Slowly but surely through these
19. PREFACE xvii
abbreviated meetings, EBM crept into the consciousness of health
workers: first among physicians and then among various health-
care professionals. These meetings were a tremendous source of
gratification, with each workshop bringing new knowledge, new
friends and lots of fun.
Dr Mianne Silvestre was one of our participants in these 2-day
workshops. Hers is a story we use to inspire other students
in EBM. Mianne caught on to EBM really fast. A week after
attending her first workshop, she was able to facilitate and teach.
A week after that, we heard she had been invited to Singapore to
lecture on evidence-based neonatology! This rapid ascent to fame
has allowed us to proclaim: you don’t need a Masters degree in
clinical epidemiology to practice and teach EBM, all you need is
a passion for lifelong learning. Her valuable contribution to this
book is to ensure that reading it is ‘painless’.
With Mianne and eight other enthusiastic participants of our
self-learning workshops, we have extended the EBM learning
experience through this book. We now provide not 25 but
150 pages of prose, developed through years of trying different
approaches to teaching what many consider to be difficult
concepts. We have painstakingly put these strategies together to
ease the pain of reading and shorten the time it takes to under-
stand EBM. As a result, our publishers have told us that we have
an unusually large number of editors and contributors for such a
short book. The reason this happened is because we spent years
testing the materials on hundreds of workshop participants in
the Asia-Pacific region for clarity and re-writing them to make
learning exciting and enjoyable.
To augment the simplicity of our prose, we have developed
what we call ‘tackle boxes’. These are stand-alone tables that
help readers grapple with difficult issues without interrupting
the train of thought in the text. These tackle boxes come with
instructions for use, and often have exercises to reinforce the
lessons learned. The result is a simple, concise book which we
20. xviii PREFACE
hope captures the very essence of EBM: lifelong learning that is
painless, spontaneous and lots of fun!
We would like to thank Mrs Jemimah Gambito-Esguerra, CEO
of the Asia-Pacific Center for EBM, who helped us put together
this manuscript; Miguel, our son who, fresh from high school,
became our guinea pig to test the manuscript for readability; and
Sandra, our daughter, who took time from her studies to draw
the cartoons for each chapter.
Special thanks are due to Dr Peter Tugwell and Dr Gord Guyatt,
revered mentors and dear friends who inspired us to write this
book, and from whom we learned the rudiments of practising
and teaching EBM.
Lastly, we thank the thousands of workshop participants in the
region whose company we have cherished and who continue to
show us how to teach EBM.
Mabuhay!
Antonio L. Dans
References
[1] Dans AL, Dans LF, Guyatt GH and Richardson S for the Evidence-Based
Medicine Working Group. 1998. How to Decide on the Applicability
of Clinical Trials Results to Your Patient. Journal of American Medical
Association. 279(7): 545–549.
21. List of Contributors
Hilda Diana A. Alava
Department of Pediatrics
Manila Central University FDTMF College of Medicine
Caloocan City, Philippines
Marissa M. Alejandria
Department of Clinical Epidemiology
University of the Philippines College of Medicine
547 Pedro Gil St., Ermita, Manila, Philippines 1000
Antonio L. Dans
Section of Adult Medicine
Department of Medicine
University of the Philippines College of Medicine
547 Pedro Gil St., Ermita, Manila, Philippines 1000
Leonila F. Dans
Department of Pediatrics
Department of Clinical Epidemiology
University of the Philippines College of Medicine
547 Pedro Gil St., Ermita, Manila, Philippines 1000
22. xx LIST OF CONTRIBUTORS
Aldrin B. Loyola
University of the Philippines College of Medicine
Medical Specialist III
University of the Philippines-Philippine General Hospital
Taft Ave., Manila, Philippines
Jacinto Blas V. Mantaring III
Clinical Associate Professor of Pediatrics
University of the Philippines College of Medicine
547 Pedro Gil St., Ermita, Manila, Philippines 1000
Bernadette A. Tumanan-Mendoza
Institute of Clinical Epidemiology
NIH-University of the Philippines Manila
Benita S. Padilla
Hemodialysis Unit
National Kidney and Transplant Institute
Quezon City, Philippines
Felix Eduardo R. Punzalan
University of the Philippines College of Medicine
547 Pedro Gil St., Ermita, Manila, Philippines 1000
Maria Asuncion A. Silvestre
University of the Philippines College of Medicine
547 Pedro Gil St., Ermita, Manila, Philippines 1000
Maria Vanessa V. Sulit
Asia Pacific Center for Evidence Based Medicine
1344 Taft Ave, Manila, Philippines, 1000
24. 2 CH01 INTRODUCTION
were not taught how to keep up with science. We were certainly
told that we had to keep up-to-date, but we didn’t know how to
do this efficiently until 1991. In that year, Dr Gordon Guyatt
of McMaster University Medical College in Ontario, Canada,
described what he believed were important improvements in the
way medicine was taught in his university:
Clinicians were formerly taught to look to authority (whether a text-
book, an expert lecturer, or a local senior physician) to resolve issues
of patient management. Evidence-based medicine uses additional strate-
gies, including quickly tracking down publications of studies that are
directly relevant to the clinical problem, critically appraising these studies,
and applying the results of the best studies to the clinical problem at
hand[2]
.
This is the first use of the term evidence-based medicine (EBM)
in published literature. While the emphasis in this passage is
on decision-making, the key process has to do with keeping
up-to-date with the literature. The faculty of McMaster thought
they were on to something exciting[2]
– and they were! Within
the next few years, the concept spread like fire, becoming one
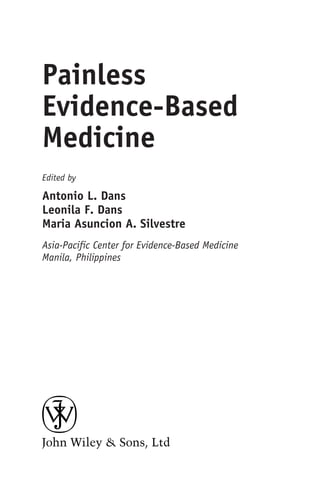
of the most widely-used phrases in the medical literature (see
Figure 1.1). EBM was introduced into the curricula of healthcare
professionals, first in medicine and later in other fields[3]
. Semi-
nars and workshops were conducted across the globe, involving
thousands of practitioners from various health care disciplines.
The popularity of EBM is easy to understand. For many the
proposed ‘rules of evidence’ were simple and easy to understand.
These rules demystified scientific research, turning it into some-
thing busy practitioners could understand, challenge and keep up
with. A few ‘philosophers’ have debated whether EBM deserves
the popularity it has gained[4, 5]
, but the debate has been confusing
rather than helpful, fuelled by misconceptions and hurt rather
than meaningful differences in opinion. An example of just how
confusing the debate has been is as follows:
25. CH01 INTRODUCTION 3
0
21 31 50 141
365
839
1307
2006
2466
3268
3566
3905
4568
5200
5911
Year of publication
92 94
93 95 96 97 98 99 00 01 02 03 05 06
04
1000
2000
3000
4000
Number
of
citations
6000
7000
5000
Figure 1.1 MEDLINE citations containing the phrase ‘evidence-based’ in
the title or abstract
The authors reframe the evidence-based medicine debate by pointing out
an underappreciated epistemological deficiency: evidence-based medicine
as currently conceptualized cannot accommodate concepts that resist
quantitative analysis and therefore cannot logically differentiate human
beings from complex machines. The authors use Michael Polanyi’s
philosophy of tacit knowing (which refers to the taken-for-granted
knowledge at the periphery of attention that allows persons to understand
the world and discern meaning in it) as a starting point for rectifying
this deficiency and for working towards an improved, person-centred
epistemology of medical practice[6]
.
We are sure the intellectual ruminations would be fascinating – if
only we could understand them. The debate, however, is for
philosophers and not for busy healthcare practitioners. For now,
all we want to say is this: if you’re overwhelmed by the literature
in healthcare, then it doesn’t matter if you’re a physician, dentist,
nurse, midwife or therapist, EBM is for you!
26. 4 CH01 INTRODUCTION
1.1 The definition of EBM
Choosing an acceptable definition of EBM is difficult since
there are so many definitions available[7]
. This is partly because
EBM has evolved so much since 1992, and partly because
various healthcare professions have modified its definition to
suit particular fields. Thus, there are definitions for evidence-
based surgery[8]
, evidence-based nursing[9]
, evidence-based
pediatrics[10]
, evidence-based psychiatry[11]
, evidence-based
healthcare[12]
and even evidence-based alternative medicine[13]
,
to state a few. Our search for the best definition led to the
conclusion that there are too many definitions, so what the heck,
here’s our own:
EBM is a systematic approach to the acquisition, appraisal and application
of research evidence to guide healthcare decisions.
Below is our first tackle box on understanding the definition of
EBM (Tackle Box 1.1). As with other tackle boxes in this book,
please spend as much (or as little) time on it as you need to,
before proceeding with the text. In the following sections of this
chapter, we discuss the three essential skills necessary for the
practice of EBM.
1.2 The three skills of EBM
Our proposed definition of EBM requires that healthcare
providers demonstrate three major skills to efficiently process the
literature. Each skill has several components which are illustrated
in Figure 1.2 and discussed in the following sections.
Skill number 1: Acquiring the evidence
The literature on healthcare can be acquired in two modes: by
active searching or by browsing[14]
. In the active mode, acquisition
27. 1.2 THE THREE SKILLS OF EBM 5
Tackle Box 1.1 Components of the definition of
evidence-based medicine
Instructions: This tackle box summarizes our definition of EBM and explains various
components of the definition. Read column 1 in its entirety before reading the details
row by row.
Components of the definition Explanation of the component
EBM is a systematic approach
to the
EBM allows practitioners to assess new
(as well as old) technology in an efficient
and logical manner, without being
intimidated or overwhelmed. This
approach requires three sets of skills:
acquisition, the skill to conduct an efficient literature
search and secure a publication in
response to information needs;
appraisal the skill to criticize medical literature and
decide if results are credible or not; and
and application of research
evidence
the skill to utilize the information in the
care of specific persons or populations.
to guide decisions The evidence itself is only one
component of the decisions that need to
be made. Other components are tacit
knowledge, professional expertise and
patients’ preferences.
in healthcare. The skills in EBM have found application
in medicine, surgery, physical therapy,
nursing, dentistry, primary care,
emergency medicine and many other
fields including public health.
Note: What have we omitted from other definitions and descriptions?
1. The role of clinical expertise[14]
: while this is an important aspect of healthcare
decisions, it is a set of skills distinct from EBM, developed and taught in other areas
of training of a healthcare professional.
2. The role of patient preferences[14]
: again, we feel this is an important element of
medical decisions but, like clinical expertise, skills for eliciting patient preferences are
distinct from EBM, and are developed and taught in other areas of training.
3. EBM is a philosophy, a movement, or even a scientific revolution[15]
. Let’s leave the
debate to philosophers. This is a book for healthcare practitioners. We say it again -
if you are drowning in the medical literature, then EBM is for you!
28. 6 CH01 INTRODUCTION
Ask a focused
question
Conduct
the search
Retrieve the
information
Appraise
results
Appraise
validity
Appraise
directness
Assess
applicability
Individualize
results
Apply
Appraise
Acquire
Figure 1.2 The three skills of EBM: how to acquire, appraise and apply
the evidence
of evidence is driven by a problem we encounter during the actual
care of a specific patient. This triggers a process of search and
retrieval for a specific article. In contrast, data acquisition happens
by accident in the browse mode, e.g. while leafing through articles
in a journal, listening to a lecture series or surfing the net. Most
EBM advocates prefer the active mode because the evidence is
used almost immediately on a patient. Any lessons learned in this
process are more likely to be retained.
Active searches entail three important skills:
(a) how to ask focused clinical questions;
(b) how to search the literature for answers; and
(c) how to retrieve the necessary references.
How to ask focused clinical questions
The most common types of questions asked in clinical practice
pertain to the effectiveness of treatment, accuracy of diagnostic
tests, prognosis of certain conditions or harmful effects of certain
exposures. Whether they are on therapy (Chapter 2), diagnosis
29. 1.2 THE THREE SKILLS OF EBM 7
(Chapter 3), harm (Chapter 4) or prognosis (Chapter 5), focused
clinicalquestionshavethreecomponents:thepopulationofinterest
(P), the exposure in question (E) and the outcome expected (O).
These are explained in detail in their respective chapters. Tackle
Box 1.2 includes examples of how to phrase these questions.
Generating focused clinical questions during day-to-day prac-
tice is very important because it is during encounters with patients
that we come face to face with much of our information needs.
Because health technology evolves so rapidly, it is safe to assume
that healthcare professionals should be asking these questions all
their lives. In an actual healthcare service, this will entail constant
vigilance. It will also entail a measure of humility. Instead of
posing as professors who know everything, practitioners should
role-model curiosity and information-seeking behaviour in their
daily practice.
How to search the medical literature
One advantage of phrasing clinical questions as populations (P),
exposures (E) and outcomes (O) is that these variables are our
gateways to the medical literature. Medical literature databases
(such as MEDLINE) usually classify articles according to P, E
and O. Looking for articles in these databases becomes a simple
matter of using these keywords as filters.
In recent years, managers of these medical literature databases
have begun to classify articles according to study design. This is
an exciting development because now we can specify not just the
topic, but the study design as well.
More details on systematic search strategies are described
in the final chapter of this book. It is sufficient to say at this
point that the ability to conduct efficient searches is a new skill
expected of all healthcare providers. This skill is now a specific
expectation in undergraduate and postgraduate curricula for
healthcare professionals.
30. 8 CH01 INTRODUCTION
Tackle Box 1.2 Asking a focused clinical question
Instructions: A well-stated question makes it clear whether one is dealing with a query on
therapy, diagnosis, harm or prognosis. If the type of question is not clear, then something
is wrong. Go through this tackle box to learn the syntax then rehearse the skill while
drawing from your own clinical experience.
Type of question Syntax Sample question
Therapy Among P (patients with a
certain disease), how effective
is E (a certain treatment) in
preventing O (an adverse
outcome)?
Among children with HIV (P),
how effective is isoniazid
prophylaxis (E) in preventing
tuberculosis (O)?
Diagnosis Among P (patients with a
certain condition), how
accurate is E (a certain test),
in diagnosing O (a disease)?
Among patients with acute chest
pain (P), how accurate is an
electrocardiogram (E) in
diagnosing acute myocardial
infarction (O)?
Harm Among P (a certain group of
patients), how much does E (a
potentially harmful exposure),
contribute to the causation of
O (a certain disease)?
Among healthy males (P), how
much does smoking (E)
contribute to the causation of
lung cancer (O)?
Prognosis Among P (patients with a
certain disease), by how much
does E (a prognostic factor),
increase the risk of O (a
certain complication)? or
Among patients with P, how
big is the risk of O?
Among patients with prostatic
cancer (P), by how much does
lumbar metastasis (E) increase
5-year mortality (O)? or Among
patients with stage IV breast
cancer (P), what is the risk of
mortality in the next 5 years (O)?
Note: P=the population of interest (usually characterized by a disease or condition);
E=the exposure being evaluated (a treatment, test, harmful exposure or a prognostic
factor); O=the outcome expected (a disease, complication or some measure of health).
In a single study, several Ps, Es and Os may be compared at the same time.
Exercise: Look back to a patient you took care of in the previous week. Think of four
focused questions that you could have asked while caring for that patient, and state them
in terms of P, E and O.
How to retrieve articles
In most developed countries, once an article has been identified
through a systematic search it can almost always be retrieved
electronically at the touch of a key. Unfortunately, there are
31. 1.2 THE THREE SKILLS OF EBM 9
great inequities in access to health information. Libraries in low
to middle income countries (LMICs) are generally small and
under-resourced. For this reason, journal retrieval can become
long-drawn, tedious and frustrating. Methods of tackling this
problem include the following:
1. Access free articles online. Many journals such as the Journal
of the American Medical Association (JAMA) and Lancet
provide free access six to twelve months after publication.
Others such as BioMed Central (BMC) are entirely free for
the developing world. Freemedicaljournals.com lists journals
that currently provide open access. PubMed also highlights
such journals. The World Health Organization through the
Health InterNetwork Access to Research Initiative (HINARI)
provides free online access to major journals to many devel-
oping countries.
2. Seek help from multinational companies which have access to
extensive library collections (this will be better for your health
than seeking free meals).
3. Write to the authors of the publication and request a copy of
their article. E-mail addresses are usually listed in the article
itself, and authors are often happy to learn of interest in their
papers.
4. Keep a list of friends in developed countries, especially those
with access to university libraries. Make sure to rotate requests
for journals so that they all remain your friends.
If all else fails, you can always pay for online access to an
article. The more often you try to retrieve articles, the easier it
becomes. Hopefully, one day, someone will address this problem
of inequitable access to healthcare information.
32. 10 CH01 INTRODUCTION
Skill number 2: Appraising the evidence
Once an article has been obtained, three aspects of a study
need detailed appraisal: directness, validity and results. These are
described briefly below, and are discussed in greater detail in
Chapters 2–6.
Appraising directness
Directness refers to how well the PEO in the article corresponds
to the PEO that you ask. Because medical knowledge is limited,
the answers provided in the literature are often similar but
not identical. Sometimes the difference is trivial and can be
neglected. Other times, however, the differences are important
and worrisome.
Appraising validity
Validity refers to how close we think study results are to the
truth. As can be seen in later chapters, there are numerous ways
in which studies may be flawed. These flaws can lead to biases,
meaning they can lead to over- or under-estimates of the things
we want to measure such as effectiveness of a treatment, accuracy
of a test or causation or prognosis of disease. The higher the
number of flaws, the greater is the expectation of bias.
Unfortunately, it is impossible to simply classify evidence as
valid or invalid based on study design. The difference between a
perfectly valid and a totally invalid study is a huge grey area of
intermediate validity. This has led to the concept of a ‘hierarchy
of evidence’, where study designs are ranked according to validity
rather than categorized as valid or invalid. The goal of EBM is
to identify the best evidence in this hierarchy for each focused
clinical question. More will be learnt about evaluating the validity
of specific studies in Chapters 2–6.
33. 1.2 THE THREE SKILLS OF EBM 11
Appraising the results
We use the term ‘results’ to refer to numeric expressions of
effectiveness, accuracy, causal relationships and prognosis. Exam-
ples include the relative risk reduction, number needed to treat,
likelihood ratios, odds ratios and hazards ratios. Understanding
these numeric expressions can be problematic, especially for the
numero-phobic. However, as will be seen, time spent under-
standing these concepts will eventually be gratified by improve-
ments in the quality of care rendered. We have exerted a lot of
effort trying to simplify these concepts in this book.
Skill number 3: Applying the evidence
After acquiring the evidence and appraising directness, validity
and results, the last step in processing the evidence is applying it to
a particular clinical situation. Two tasks are required: assessment
of applicability and individualization of results.
Assessing applicability
Applicability refers to the extent to which conclusions of a study
can be expected to hold true for a particular patient. It is similar
to directness, but not exactly the same. Directness compares the
clinical PEO to the research PEO (in a very general sense). Clini-
cians can then decide if an article is worth reading or not. Appli-
cability, on the other hand, takes a closer look at specific issues
such as biologic and socioeconomic differences between the study
population and the patients we see. Clinicians reading articles in
scientific journals intuitively ask: will this technology work for
my patients? While the hesitation is sometimes well founded, it
may actually be unnecessary in some cases. In Chapters 2–6, we
share ways of thinking about applicability that have helped us
34. 12 CH01 INTRODUCTION
strike a balance between hasty application and excessive caution
in the interpretation of results.
Individualizing the results
Studies are concerned with average effects of health technology
on large groups of people. As healthcare providers, however, we
deal with individual patients whose responses may differ from
the average. The estimation of the effect in an individual is
therefore an important process. We refer to this process as ‘indi-
vidualization of results’. Individualization is both a science and
an art. The science deals with estimation of the magnitude of
the effect on a particular individual. This involves some grap-
pling with numbers. The art refers to sharing decisions with
patients, laying the cards on the table and using their own values
and preferences to assess the trade-offs between benefit, harm
and cost.
1.3 Summary
Evidence-based medicine is a systematic approach to the acqui-
sition, appraisal and application of research evidence to guide
healthcare decisions. The key skills in EBM help us keep up-
to-date with the literature. Acquisition of evidence involves
skills in asking focused clinical questions, searching for the
evidence and retrieving articles. Appraisal of evidence involves
skills in the critical assessment of directness, validity and results.
Finally, application of evidence involves skills in the assess-
ment of applicability and individualization of results. Acquisi-
tion skills are detailed in Chapter 7 (Literature searches), while
appraisal and application skills are discussed more extensively in
Chapters 2–6.
35. REFERENCES 13
References
[1] http://hms.harvard.edu/public/history/past-deans.html; George Packer
Berry, 1949–1965. Past Dean of the Harvard Medical School.
[2] Evidence-Based Medicine Working Group. 1992. Evidence-based
medicine. A new approach to teaching the practice of medicine. Journal
of the American Medical Association. 268(17): 2420–2425.
[3] Green ML. 2000. Evidence-Based Medicine training in graduate
medical education: past, present and future. Journal of Evaluation in
Clinical Practice. 6(2): 12–138.
[4] Miles A, Charlton B and Bentley P. 2000. New perspectives in evidence-
based health care debate. Journal of Evaluation in Clinical Practice. 6(2):
77–84.
[5] Miles A, Bentley P, Polychronis A and Grey J. 1997. Evidence-based
Medicine: Why all the fuss? This is why. Journal of Evaluation in Clinical
Practice. 3(2): 83–86.
[6] Henry SG, Zaner RM and Dittus R. 2007. Viewpoint: Moving beyond
Evidence-based Medicine. Academy of Medicine. 82(3): 292–297.
[7] Beutow S and Kenealy T. 2000. Evidence Based Medicine: need for
new definition. Journal of Evaluation in Clinical Practice. 6(2): 85–92.
[8] Toledo-Pereyra LH. 2005. Evidence-Based Surgery. Journal of Inves-
tigative Surgery. 18(5): 219–222.
[9] DiCenso A, Cullum N and Ciliska D. 1998. Implementing
evidence-based nursing: some misconceptions [editorial]. Evidence-
Based Nursing. 1: 38–40.
[10] Moyer VA and Elliott EJ. 2000. Preface In Moyer VA, Elliott EJ, Davis
RL, Gilbert R, Klassen T, Logan S, Mellis C and Williams K (eds.).
Evidence based pediatrics and child health. London: BMJ Books.
[11] Goldbloom DS. 2003. Evidence-based psychiatry [editorial]. CPA
Bulletin. 35(6): 3, 5.
[12] Hicks N. 1997. Evidence based healthcare. Bandolier. 4(39): 8.
http://www.jr2.ox.ac.uk/bandolier/band39/b39-9.html
[13] Mills EJ, Hollyer T, Guyatt G, Ross CP, Saranchuk R and Wilson
K. 2002. Evidence-Based Complementary and Alternative Medicine
Working Group. Teaching evidence-based complementary and alter-
native medicine: 1. A learning structure for clinical decision changes.
Journal of Alternative Complementary Medicine. 8(2): 207–214.
[14] Sackett, D. 2000. Evidence-based Medicine: How to Practice and Teach
EBM. 2nd edition. Churchill Livingstone.
36. 14 CH01 INTRODUCTION
[15] Seton SR and Stanley DE. 2003. A philosophical analysis of the
evidence-based medicine debate. BMC Health Services Research. 3: 14.
Good! You acquired the article! Now you need to appraise and apply.
38. 16 CH02 EVALUATION OF ARTICLES ON THERAPY
Outcomes in each of these treatment groups are compared in
therapy trials. Some outcomes are dichotomous, meaning there
are only two possible results, e.g. death or survival. Dichoto-
mous outcomes are usually summarized as proportions (e.g. the
proportion that died in each treatment group). Other outcomes
are continuous in nature, meaning there is a wide range of
possible results (e.g. changes in weight). Continuous outcomes
are commonly summarized as means (e.g. the mean change in
weight in each treatment group).
2.1 Appraising directness
Before even reading an article, the first thing we must do is
evaluate directness, i.e. how well the PEO in the study (the
research question), corresponds with our own PEO (the clinical
question). The problem of directness is very common. Direct-
ness issues arise because investigators are constrained by their
budgets to answer very narrow, focused questions. In contrast,
healthcare professionals in the real world are interested in a
very broad range of issues. These differences are summarized in
Table 2.1.
Because the evidence doesn’t always provide a direct answer
to our clinical question, we are often constrained to use avail-
able information. For example, we have used studies in men to
manage coronary disease in women for many decades[1]
. Also,
few beta-blockers have been proven to reduce the risk of stroke
in hypertensive patients and yet specialty societies agree that any
beta-blocker may be used[2]
.
There are instances however, when we should be very cautious
in using indirect evidence. For example, a study on the anti-
arrhythmic drug flecainide for acute myocardial infarction (MI)[3]
showed that, despite the beneficial effect on cardiac rhythm (the
surrogate outcome), the drug eventually caused thousands of
39. 2.1 APPRAISING DIRECTNESS 17
Table 2.1 The problem of directness: differences in the types of questions
asked by researchers and clinicians according to the population of
interest (P), the exposures or treatments evaluated (E) and the outcomes
monitored (O)
Research Questions Clinical Questions
P Because sample size is
limited, researchers need to
restrict their studies to a
few, broadly defined
subgroups of patients
e.g. the effect of treatment
in the young and old.
Clinically, we are often interested in
treatment effects in many different
subgroups e.g. the effect of
treatment in young and old, males
and females, sick and healthy,
smokers and non-smokers, rich and
poor.
E Researchers usually evaluate
a specific exposure e.g. drug
preparation, surgical
technique or educational
strategy.
Clinically, we are usually interested
in variations of the exposure e.g. a
similar drug belonging to the same
class, a similar surgery using a
modified technique, or a similar
educational strategy using a different
educational tool.
Researchers sometimes
make inappropriate
comparisons e.g. a high
dose of one drug versus a
low dose of another.
Clinically, we are only interested in
fair comparisons.
O Researchers usually monitor
a selected few, easily
measurable outcomes e.g.
surrogate outcomes such as
serum cholesterol and
blood pressure.
Clinically, we are more interested in
important effects that are sometimes
difficult and expensive to measure
e.g. clinical outcomes such as pain
relief, disability, overall quality of
life or mortality.
Researchers at times
monitor composite
outcomes e.g. instead of
measuring the incidence of
death alone, they monitor
the combined incidence of
death, stroke or heart
attack. This increases the
number of events in a
study, and thus decreases
the required sample size.
Clinically, we are interested in the
effect of treatment on separate
outcomes because in composite
outcomes 1) the individual
components may not be of equal
importance to us or 2) the effect of
treatment may not be of the same
magnitude for each component.
40. 18 CH02 EVALUATION OF ARTICLES ON THERAPY
deaths in the setting of an acute MI (the clinical outcome)[4]
.
If we are to avoid harming patients the way this drug did, we
must think twice before assuming that a surrogate outcome,
such as reducing cardiac rhythm problems, provides a direct
answer to a clinically important question, such as prolonging
life.
Evaluating directness is as much an art as it is a science. If you
feel the article might provide a reasonably close answer to the
question you are asking, then proceed to evaluate it in greater
detail. Otherwise, it would be wise to spend your time looking
for a closer match.
2.2 Appraising validity
The validity of trials comparing two therapies depends almost
entirely on how fair the comparisons are between patients in
the treatment and control groups. We summarize eight criteria
for assessing validity. These criteria are phrased as questions.
A ‘yes’ answer to a question means that the criterion is satis-
fied. The more ‘yes’ answers there are, the more sure we
become that the comparisons are fair and that the odds are
not stacked in favour of one group (a phenomenon known as
bias).
Question 1: Were patients randomly assigned
to treatment groups?
Random assignment of patients to treatment groups in a trial
is the best technique to ensure that treatment groups are truly
comparable. If patients are not assigned to treatment groups at
random, then allocation may become unfair. Cases with poorer
prognosis may end up being assigned to one treatment group.
41. 2.2 APPRAISING VALIDITY 19
Historically, a coin toss could be used to assign patients to either
treatment group. More frequently, tables of random numbers
and, more recently, computer-generated random sequences have
been used.
Studies that use this strategy to compare two treatments are
referred to as randomized controlled trials (RCTs). Such trials are
considered the highest form of evidence on therapy. However,
there are some situations where we cannot insist on random-
ization. For example, when one therapy is clearly superior to
another in reversing the course of a disease, it would be unethical
to conduct an RCT. In such situations (e.g. blood transfusion for
massive haemorrhage, or surgical repair of perforating abdom-
inal injuries), we can usually assume effectiveness. Unfortunately,
such miracle cures are the exception rather than the rule. In
general, we search for RCTs before accepting a claim that a
therapy is effective.
Tip: To check if randomization was performed, look for the
words ‘randomization’, ‘randomized’ or ‘randomly allocated/
assigned’ in the title, abstract or methodology.
Question #2: Was allocation concealed?
In a trial, the random order by which we assign patients to
treatment groups is referred to as the allocation sequence. It is
not sufficient that researchers generate an allocation sequence
that is random; they must also take measures to ensure that the
sequence is not altered by clinicians who unknowingly (or know-
ingly) tend to disturb it. These measures are called allocation
concealment strategies. One such measure is placement of treat-
ment assignments in sealed opaque envelopes. Other investigators
assign a third party not involved in the study (e.g. a pharmacist)
to assign the treatment. More recently, objective computers
42. 20 CH02 EVALUATION OF ARTICLES ON THERAPY
have replaced subjective humans in the task of allocating
treatment.
Tip: To ascertain allocation concealment, look for a phrase or
paragraph stating one of the following:
1. that a clinician recruiting a patient must contact a remote
centre to obtain a patient treatment assignment;
2. that envelopes containing the allocation sequence were sealed
and numbered; or
3. that vehicles or packages containing the medications were
indistinguishable.
Question #3: Were baseline characteristics similar
at the start of the trial?
Because of randomization, baseline characteristics of treatment
groups in an RCT tend to be very similar. Sometimes, however,
inequality between treatment groups may arise due to chance
alone. This third criterion checks how successful randomiza-
tion and allocation concealment were by actually comparing
the characteristics of patients within the treatment and control
groups.
The comparisons are usually presented as a table of baseline
characteristics with columns for treatment and control groups.
Sometimes there is also a column of p-values but this is not as
important. A p-value just tells us if the difference occurred by
chance. What we really need to know is if the difference is big
enough to affect the results by putting one group at a disad-
vantage. Thus, when studies report, ‘There was no statistically
significant difference between the two groups for baseline char-
acteristics’, try to assess if the magnitude of the differences are
clinically important. For example, a difference in mean gestational
43. 2.2 APPRAISING VALIDITY 21
age of 31 weeks versus 33 weeks among premature babies may
be statistically insignificant (p 0.05). However, this difference
may still be clinically important in a trial assessing a therapy to
prevent hyaline membrane disease.
Question #4: Were patients blinded
to treatment assignment?
If patients know which treatment they are receiving (active
drug or placebo), they can subconsciously or even deliber-
ately influence their own outcomes. This may occur, especially
when the outcomes being monitored are subjective. For example,
there may be a tendency to report symptoms if they know
they are taking placebo. This will make the active drug seem
better.
Tip: To decide if patients were blinded during conduct of the
trial, look for use of identical preparations. Obviously, blinding is
more difficult (even impossible) when the interventions involve
diet, educational manoeuvres or surgical procedures.
Do not confuse blinding with allocation concealment. Blinding
is an attempt to make the treatments being compared indistin-
guishable. In contrast, allocation concealment is an attempt to
preserve the allocation sequence (as described in Question #2
above).
Question #5: Were caregivers blinded
to treatment assignment?
When caregivers and physicians are aware of the treatment group
to which patients are assigned, they may treat the patients in the
two groups differently. For example, a clinician who knows his
patient is on a placebo may worry and decide to take better care
44. 22 CH02 EVALUATION OF ARTICLES ON THERAPY
of that patient. Conversely, a clinician who knows the patient
is on treatment may decide to monitor more frequently just in
case there are side effects. These changes in care may make a
treatment appear better or worse than it really is.
Tip: To decide if caregivers were blinded in the conduct
of the trial, look for use of identical preparations. Again,
blinding is not always possible. It can be very difficult when the
interventions involve diet, educational manoeuvres, or surgical
procedures.
Question #6: Were outcome assessors blinded
to treatment assignment?
Outcome assessors can be the patients themselves, or their
caregivers. They are sometimes directly involved in assessing
outcomes or therapy response. For example, patients may be
asked if they feel better and caregivers may be asked if they
think their patients are doing well. The potential bias involved
in this task can often be reduced by blinding them to treatment
assignments as described in Questions #4 and #5.
Sometimes, however, the outcome assessors are study
personnel (for example, members of an endpoint committee),
responsible for deciding how a patient responded to therapy. The
questions these personnel answer can become very tricky. Was
this hospitalization a result of a drug side effect? Did this patient
die of a heart attack or pneumonia? Is this rise in creatinine
significant or not?
Because their decisions are often subjective, information on
treatment assignment should be withheld from outcome assessors
whenever they review a case. This is an important strategy. As
mentioned in Questions #4 and #5, blinding of patients and their
caregivers may be difficult or impossible in some trials. However,
blinding study personnel when they assess outcomes is almost
45. 2.2 APPRAISING VALIDITY 23
always doable (with rare exceptions). This will usually ensure a
more objective evaluation.
Tip: First decide who is making the outcome assessment: the
patient, the caregiver or the investigator. If it is the patient or
caregiver, tips to answer Questions #5 and #6 will apply. If it
is the investigator, look for statements indicating that they were
‘blinded’, that clinical data was withheld, or that their assessments
were independent.
Question #7: Were all patients analysed in the groups
to which they were originally randomized?
As in the real world, patients in trials may not comply or adhere
to the treatment protocol that they were assigned to. This may
happen for many reasons. They may forget how to take a drug
properly, suffer intolerable side effects, or even refuse to go on for
no apparent reason. A dilemma arises: should they be analysed
in their original treatment group (intention-to-treat analysis),
or should they just be excluded from the study (censored
analysis)?
There are two reasons why non-compliant patients should
be analysed in their original groups. Firstly, in the real world,
a patient’s ability to comply is considered part of the perfor-
mance (success or failure) of that therapy. If investigators remove
non-compliant patients from their analysis, the treatments may
appear better than they actually are. Secondly, non-compliant
patients should be analysed in their original assignments because
removing them could disturb the balance achieved by random
allocation.
Tip: To make sure that investigators did not censor non-
compliant patients from the analysis, look for the term ‘intention-
to-treat’ under the analysis section of the article. If not stated
explicitly, look for some indication that patients retained their
46. 24 CH02 EVALUATION OF ARTICLES ON THERAPY
original assignment even if they were non-compliant. If this
is not stated as well, a last resort would be to check that
the number of patients randomized is equal to the number of
patients analysed at the end of the study. This suggests (but
does not guarantee) that patients were not excluded from the
analysis.
Question #8: Was follow-up rate adequate?
Adequacy of follow-up refers to minimization of the number
of patients who drop out from a study. Drop-outs are not
the same as non-compliant patients (discussed in Question #7
above). Non-compliant patients stop taking the drug, but we can
still determine what happened to them. In fact, as previously
discussed, we can still include them in the analysis. In contrast,
drop-outs leave the study (or are removed), leaving us with no
data on their outcomes. Drop-outs usually leave the study because
of adverse events or dissatisfaction. The greater the number of
patients lost to follow-up, the more the study validity is threat-
ened. The crucial issue is ascertaining when to worry about the
number of drop-outs. Tackle Box 2.1 provides an approach to
this problem. Essentially, readers should worry about drop-out
rates when they are large enough to affect the outcome of a trial.
The eight questions on the validity of a study have now been
discussed. While it is tempting to be strict and insist that all eight
criteria be satisfied, we must be pragmatic and remember that
we sometimes need to make medical decisions based on less than
perfect information. If you feel that errors are small or that this is
probably the best study you will find that addresses your clinical
question, read the results. If you feel the errors are too great and
that there are better studies, then don’t waste your time with the
article.
47. 2.3 APPRAISING THE RESULTS 25
2.3 Appraising the results
Question #1: How large was the effect of treatment?
The magnitude of the treatment effect may be expressed by
comparing outcomes in the treatment and control groups. As
described earlier, outcomes can be reported either as:
1. continuous variables, which have a range of possible results
(e.g. change in weight, or change in quality of life on a scale
of zero to one); or
2. dichotomous variables, which have only one of two possible
results (e.g. dead or alive, hospitalized or not).
When the outcomes are continuous, the effect of treatment is
simply expressed as the ‘mean difference’. This is easily calculated
by obtaining the mean result in the treatment and control groups
and calculating the difference, that is
Mean difference=mean in control group−mean in treatment group
For example, if a trial on hypertension showed the mean systolic
blood pressure in the control to be 160 mmHg and the mean in
the treatment group to be 120 mmHg, then the mean difference
would be 40 mmHg.
Unfortunately, things are not as straightforward when dealing
with dichotomous outcomes. Tackle Box 2.2 attempts to simplify
this task. If unfamiliar with the concepts of relative risk reduction,
absolute risk reduction and relative risk, take time to study this
box. If you have heard of these concepts but have difficulty
remembering them, the box provides some tricks to help you
recall them in an instant.
48. Tackle Box 2.1 Assessing if there are too many drop-outs in a study
Instructions: In this hypothetical RCT, patients with severe pneumonia are randomized to receive either active
treatment (n = 30) or placebo (n = 30). There are 13 drop-outs in the study, 6 on treatment and 7 on placebo.
Go through this tackle box by rows to learn how to decide if there are too many drop-outs in a study.
Treatment group
N = 30
Placebo group
N = 30
Step 1: Count the number of patients with
bad outcomes in each treatment group,
and express this as a fraction of the
number of patients analysed
Deaths =
5
24
Deaths =
9
23
Step 2: Count the number of drop-outs in
each treatment group
Drop-outs = 6 Drop-outs = 7
Step 3: Create a worst scenario for the
treatment group by assuming all the
drop-outs in this group had the bad
outcome, and all the drop-outs in the
control group had a good outcome
Deaths =
5 + 6
24 + 6
=
11
30
Deaths =
9 + 0
23 + 7
=
9
30
49. Step 4: Create a best scenario for the
treatment group by assuming the opposite,
i.e. all the drop-outs in this group had a
good outcome, and all the drop-outs in
the control group had the bad outcome
Deaths =
5 + 0
24 + 6
=
5
30
Deaths =
9 + 7
23 + 7
=
16
30
Step 5: Were the conclusions of the best
and worst scenarios significantly different?
If yes, then there were too many
drop-outs!
The best-case scenario showed fewer bad events for
treatment (benefit), while the worst-case scenario
showed more bad events for treatment (harm). There-
fore, there were too many drop-outs in this hypothet-
ical study.
Note – This process of making best and worst assumptions about what happened to drop-outs is called a sensitivity
analysis. In essence, we are trying to find out if the conclusions are sensitive to the assumptions we make. If
it didn’t matter what happened to the drop-outs, we say the conclusions are ‘robust’. If what happened to the
drop-outs will significantly change our conclusions, however, we say that the conclusions are ‘soft’.
Exercise – If the deaths on treatment were 1/24 and the deaths on placebo were 16/23, would the same drop-out
rates still be worrisome? (Answers: No, the treatment group would have fewer deaths in both the best and worst
scenarios.)
50. Tackle Box 2.2 Measures of effectiveness for dichotomous outcomes
Instructions: Before going through this tackle box, imagine you went on a diet and lost weight from 80 kg to 60 kg. Now spend a few minutes to
think of different ways of numerically expressing your weight loss. We’ve listed some ways to do this in column 1. Start by going through this
column, then through columns 2–5, to understand different measures of effectiveness.
Weight analogy Measures of effectiveness
In what ways could you
express your change in
weight if it went down
from 80 kg (Wc) to 60
kg (Wt)?
What subliminal formula
did you use to come up
with these expressions?
Similarly, in what ways could
you express a change in the
risk of death from 8% in a
control group (Rc) to 6% in a
treatment group (Rt)?
What would the
formulae be for these
expressions?
How would you interpret
these numbers?
‘I lost 25% of my weight’
– your relative weight
reduction.
weight change
original weight
=
Wc − Wt
Wc
‘I lost 25% of my risk’.
This is called the relative risk
reduction or RRR, and it is
usually expressed in %.
RRR =
risk change
original risk
=
Rc − Rt
Rc
RRR (usually in percent):
0% Treatment beneficial
˜0% Treatment no effect
0% Treatment harmful
‘I lost 20 kg’
– your absolute weight
reduction.
weight change = Wc − Wt ‘I lost 2% of my risk’.
This is called the absolute risk
reduction or ARR, and it is
usually expressed in %.
ARR = risk change
= Rc − Rt
ARR (usually in percent):
0% Treatment beneficial
˜0% Treatment no effect
0% Treatment harmful
‘I now weigh 75% of
what I used to weigh’
– your relative weight.
new weight
original weight
=
Wt
Wc
‘My risk is now 0.75 of what it
was’.
This is called the relative risk or
RR, and it is usually expressed
as a decimal number.
RR =
new risk
original risk
=
Rt
Rc
RR (usually in decimals):
1.0 Treatment beneficial
˜1.0 Treatment no effect
1.0 Treatment harmful
51. Notes:
1) Look at the middle column. One statement reads ‘I lost 25% of my risk’. The other statement reads ‘I lost 2% of my risk’. Can both of these
statements be correct, given the same data? The answer is yes. Note however, that the first is a relative reduction and the second an absolute
reduction. Authors like to report relative reductions because they are constant and they also seem bigger. Readers should also look for the
absolute reductions.
2) Look at the last column. These interpretations of ARR, RRR and RR assume that the outcomes are reported as unfavourable events (e.g.
death), rather than favourable events (e.g. survival). If the outcome is reported as the proportion that survived instead of the proportion that
died, all the interpretations are reversed. An RRR 0% could actually mean harm instead of benefit. We think authors should always report
the harmful outcome to avoid confusion. Also, we feel that it sounds really pessimistic to report ‘the relative risk of surviving’. Unfortunately,
not everyone agrees.
3) Aside from the RRR, ARR and RR, there is a fourth measure of treatment effects not shown in the table. This is known as the number needed
to treat, or NNT. This is derived from the ARR. In the example above, the ARR is 2%, which means ‘I can prevent 2 deaths out of every
100 patients that I treat’. Thus, I need to treat 50 patients before I save one life. NNT, therefore, is simply calculated as 100/ARR (since it is
reported in percent). It tells us the number of patients we would need to treat to prevent 1 adverse outcome. The closer the NNT is to one,
the more effective the treatment. The higher it is above one, the less effective the treatment is. When the ARR is 0 (i.e. when treatment is
harmful), NNT will also be negative. In this situation it is sometimes referred to as the number needed to harm (NNH).
Exercise:
1. If an RCT showed death rates of 4% in the treatment group and 5% in the placebo group, what would the RRR, ARR, RR and NNT be?
2. What if death rates were 5% on treatment and 4% on placebo?
Answers: 1. RRR = 20%, ARR = 1%, RR = 0.80, NNT = 100; 2. RRR = –25%, ARR = –1%, NNH=100.
52. 30 CH02 EVALUATION OF ARTICLES ON THERAPY
Another way of summarizing dichotomous outcomes is by
using rates instead of proportions. As the term suggests, rates tell
us how fast events accumulate in treatment and control groups
through time. Thus, if a clinical trial is conducted over a four-
year period, the results can be stated as either: 40% of patients
died in the control group and 20% in treatment (proportions);
or 10% died per year in the control group, and 5% died per year
in the treatment group (rates). The difference can be graphically
illustrated in survival curves as shown in Figure 2.1.
100%
0%
20%
40%
60%
80%
1 2
Years of follow-up
3 4
Treatment
group
Placebo
group
Death
rate
in
%
Figure 2.1 Survival curve of a hypothetical randomized controlled trial
A common expression comparing two rates would be the hazards
ratio, which is the rate of outcomes on treatment divided by the
rate of outcomes in control. This expression is similar to the
relative risk (RR). It is interpreted in exactly the same way and it
is usually different by just a few decimal places. The various ways
of expressing effectiveness are summarized in Table 2.2 below.
53. 2.3 APPRAISING THE RESULTS 31
Table 2.2 Ways of expressing effectiveness
Outcome Summary of result
within each group
Comparison of results
between two groups
Dichotomous
(e.g. lived or died,
BP controlled or
not)
Proportion (e.g.
deaths per 100
patients)
Relative risk reduction,
absolute risk reduction,
relative risk (see Tackle Box
2.2)
Rate = e.g. deaths per
100 patients per year
Hazard ratio = rate in
treatment/rate in control
group
Continuous (e.g.
blood pressure in
mmHg, quality of
life on a scale of
0 to 1)
Mean (e.g. mean blood
pressure)
Mean difference = mean in
control − mean in
treatment group
Question #2: How precise was the estimate
of the treatment effect?
Because a study merely estimates the true effect of a drug, it may
be unduly confident to express absolute risk reduction (ARR),
relative risk reduction (RRR) and relative risk (RR) as exact
values or point estimates. For example, it may be misleading to
say simply that ‘warfarin reduces the risk of stroke in patients
with atrial fibrillation by 79% (RRR)’. Such an estimate does not
accurately reflect uncertainty due to sample size limitations. Thus,
in addition to simplistic point estimates, researchers also report
an interval estimate which provides a range of possible values
of the treatment effect. By convention, interval estimates are
estimated at a 95% level of confidence. Thus, when we state 95%
confidence intervals (95% CI), we mean that we are 95% sure that
the true effect of the treatment lies within this range. Therefore,
for warfarin, a better statement would be that ‘it reduces the risk
54. 32 CH02 EVALUATION OF ARTICLES ON THERAPY
of stroke in patients with atrial fibrillation by 79% (RRR), but
the actual RRR could range anywhere from 52% to 90%’[5]
. By
convention, this is expressed as:
RRR = 79% 95% CI 52%90%
How do we interpret the results? Tackle Box 2.3 below
summarizes different conclusions that can arise from looking at
confidence intervals. Spend some time familiarizing yourself with
reading CIs. To make things easier, remember the following four
basic tenets.
1. When both ends of the CI are on the side of benefit, the
treatment is definitely beneficial.
2. When both ends of the CI are on the side of harm, the
treatment is definitely harmful.
3. When one end reflects important benefit and the other end
reflects important harm, then the study is inconclusive.
4. When one end reflects a small unimportant benefit and the
other end reflects a small unimportant harm, then for all
intents and purposes the two treatments being compared are
equal.
Confused? Then, you really need to spend time on Tackle Box 2.3.
This will be worthwhile as it will help analyse study results quickly
and efficiently.
Tackle Box 2.3 demonstrates why it is important to understand
confidence intervals. Without them, it would be very difficult to
interpret the results of a study. In cases where the 95% CIs are
not reported in the article, do not panic! You could either
1. use freely downloadable programs[6, 7]
;
2. call a statistician friend to compute it for you; or
55. 2.4 ASSESSING APPLICABILITY 33
3. compute it yourself[8]
(not recommended if you are not
confident about working with numbers).
As a final option: go ahead and panic.
2.4 Assessing applicability
After evaluating validity and analysing the results of a trial, the
next step is to decide if the results can be applied to our own
patients. Trials provide information that can help us decide this.
For example, we can check if our patients’ characteristics satisfy
the inclusion and exclusion criteria. We can also look at treatment
effects in subgroups of patients that more closely approximate
the individual patient we are trying to help (subgroup analysis).
Unfortunately, in real life there are simply too many patient
subtypes and trials are typically too small to address more than a
few subgroup hypotheses. It would be very unlikely for example,
that we find a trial on a drug for hypertension which analyses
effects among male smokers aged 40–45, weighing 60–70 kg, with
a total cholesterol of 6–7 mmol/Li and a family history of stroke!
Because data from subgroups are limited, healthcare providers
must decide on the applicability of trial results to individual
patients, based on the general information available to them.
In doing this, we suggest consideration of biologic as well as
socioeconomic issues.
Biologic issues affecting applicability
Sex
Consider physiological, hormonal or biochemical differences
between sexes that might affect the effectiveness of an inter-
vention. For example, women have greater reduction in stroke
incidence compared to men when treated with aspirin[9]
.
56. Tackle Box 2.3 Interpreting 95% Confidence Intervals (CIs)
Instructions: When researchers express the effect of treatment using the relative risk reduction, absolute risk reduction, or relative risk, they often
give us a range of possibilities rather than a single estimate. This range of possibilities is called a ‘95% Confidence Interval (95% CI)’ to mean ‘we
are 95% sure that the true effect of a drug lies in this range’. Go through this tackle box in rows, to discover how helpful 95% CIs are.
Measure of
effectiveness
Interpretation of point
estimates
Interpretation of 95% CIs
Treatment surely
better than control
Treatment surely
worse than control
Inconclusive (we
need more studies)
The two are probably
equivalent
Relative Risk
Reduction
Usually in percent
0% Treatment beneficial
Both ends of 95%
CI 0%
Both ends of
95% CI 0%
95% CI straddles
0%; either end is far
from 0%
95% CI straddles 0%;
either end very close
to 0%
RRR =
Rc − Rt
Rc
˜0% Treatment no effect
0% Treatment harmful
Example:
RRR = 7%
[95% CI: 6%, 8%]
Example:
RRR = –8%
[95% CI: –7%, –9%]
Example:
RRR = 1%
[95% CI: –16%, 15%]
Example:
RRR = 0.4%
[95% CI: –0.6%, 1.0%]
Absolute Risk
Reduction
Usually in percent
0% Treatment beneficial
Both ends of 95%
CI 0%
Both ends of
95% CI 0%
95% CI wide;
straddles 0%
95% CI narrow;
straddles 0%
ARR = Rc − Rt
˜0% Treatment no effect
0% Treatment harmful Example:
ARR = 2%
[95% CI: 1%, 3%]
Example:
ARR = −3%
[95% CI: –7%, –1%]
Example:
ARR = 1%
[95% CI: –9%, 9%]
Example:
ARR = 0.2%
[95% CI: –0.1%, 0.5%]
57. Relative Risk Usually in decimals
1.0 Treatment beneficial
Both ends of 95%
CI 1.0
Both ends of
95% CI 1.0
95% CI wide;
straddles 1.0
95% CI narrow;
straddles 1.0
RR =
Rt
Rc
˜1.0 Treatment no effect
1.0 Treatment harmful Example:
RR = 0.7
[95% CI: 0.6, 0.8]
Example: RR = 2.4
[95% CI: 1.8, 3.2]
Example:
RR = 1 [95% CI: 0.2,
5.3]
Example:
RR = 1
[95% CI: 0.9, 1.1]
Note: These interpretations only hold if the dichotomous events are expressed as adverse rather than desirable events, e.g.
death rather than survival, treatment failure rather that cure, or disease rather than disease-free. When dichotomous outcomes
are expressed as desirable events, the interpretation of benefit and harm is reversed. We feel researchers should standardize
reporting and use adverse events in order to avoid confusion. Unfortunately, not everyone agrees.
Exercise: An RCT compared stroke rates among patients given an experimental drug or placebo. How would you interpret the
following hypothetical results?
(a) RR = 2.3 [95% CI: 1.5, 3.1];
(b) RR = 0.98 [95% CI: 0.95, 1.02];
(c) RR = 0.63 [95% CI: 0.53, 0.73]; and
(d) RR = 0.98 [95% CI: 0.50, 1.50]
Answers: (a) treatment surely worse; (b) the two are equivalent; (c) treatment surely better; and (d) inconclusive results.
58. 36 CH02 EVALUATION OF ARTICLES ON THERAPY
Co-Morbidities
Consider co-existent conditions that could affect applicability.
Studies show that response to measles vaccination is reduced in
malnourished children[10, 11]
.
Race
Racial differences may affect applicability. For example, black
hypertensives are more responsive to diuretics than whites[12]
.
East Asians are more likely to develop the adverse effect of
cough from angiotensin converting enzyme inhibitors compared
to whites[13]
.
Age
Age differences commonly affect response to a treatment. For
example, flu vaccines lead to smaller reductions in the risk of
influenza in older people[14]
.
Pathology
Consider differences in the disease under study itself. At times,
diseases we refer to by the same name are actually conditions with
slightly different pathology. This can lead to significant variations
in response to treatment. For example, malaria in Zimbabwe is
different from malaria in the Philippines and this is manifested
as differences in treatment response[15, 16]
.
Socioeconomic issues affecting applicability
Most trials are carried out under ideal conditions, which are
difficult to apply in everyday life. This is as much a problem
of provider compliance as it is a problem of patient compli-
ance. Patient compliance problems often relate to markers of
59. 2.5 INDIVIDUALIZING THE RESULTS 37
socioeconomic disadvantage such as poverty and lack of educa-
tion. Provider compliance problems, on the other hand, are
often related to skill in the implementation of certain procedures
and availability of necessary facilities. Some therapies present
both types of compliance problems. Warfarin administration for
atrial fibrillation, for example, requires not only strict patient
compliance with monitoring, but also availability of resources for
prothrombin time determination and emergency management of
life-threatening bleeds.
2.5 Individualizing the results
When you are satisfied that biologic and socioeconomic factors
will not compromise effectiveness, the next step is to individu-
alize the benefit, risks and costs to your patient. While studies
report effectiveness of a treatment in a population as a whole, the
benefits, risks and costs will vary slightly from patient to patient.
The main source of this variation is the patient’s baseline risk
for the event you are trying to prevent. Variation in risk is very
common in medicine. Patients have mild, moderate or severe
forms of the same disease, or may have variable risk factors for
an adverse outcome. Some individuals may come in early and
others may come in late in the course of an illness. Tackle Box 2.4
shows us five quick steps in using the baseline risk to estimate
the effect of therapy on an individual.
You now have information on the individualized benefits,
harms and costs of treatment which you can use to reach a
decision for your patient. Remember that we tend to make deci-
sions for patients most of the time. This is acceptable for treat-
ments where benefits far outweigh the harm, and cost is not a
problem. However, when we are at a deadlock between benefit
and harm, or when cost is potentially prohibitive, we may want
to provide information for our patient in a clear and concise but
60. Tackle Box 2.4 Steps to estimate the individualized changes in risk
Instructions: Studies estimate the average effect of treatment on groups of people, but unfortunately, not everyone is average.
Some people have milder disease than average, while others have more severe disease. Consideration of these differences allows
us to individualize the estimated effect of treatment. Here are five simple steps to do this.
Step How to do it Example: Treatment
showing benefit
Example: Treatment showing
harm
Step 1: Estimate your
individual patient’s risk for
an event without treatment
(Rc).
This is estimated from clinical
features of the patient’s condition,
e.g. severity, stage of disease, age, risk
factors, etc. Possible references
include studies on prognosis. For a
few diseases, risk calculators are
available (e.g. coronary risk
calculators).[17, 18]
A 55-year old male with
atrial fibrillation,
diabetes hypertension, a
prior stroke but no valve
disease has an annual
risk of ischemic stroke
of 8%[19]
.
A 55-year old male with
atrial fibrillation, diabetes
hypertension, a prior stroke but
no valve disease has a small
annual risk of major
extracranial haemorrhage of
approximately 1%[20]
.
Step 2: Estimate the RR
using the study results.
If the relative risk (RR) is given, well
and good. If not, estimate it from the
relative risk reduction (RRR). Simply
convert RRR from percent to decimal
notation and subtract from 1.00. For
example, if RRR = 25%, then
RR = 1.00 – 0. 25 = 0.75.
If we give warfarin to
the patient above, we
can reduce the risk of an
ischemic stroke:
RR = 0.36[19]
If we give warfarin to the
patient above, we increase the
risk of a extracranial
haemorrhage: RR = 4.3[19]
61. Step 3: Estimate your
individual patient’s risk for
an event with treatment
(Rt).
RR =
Rt
Rc
therefore
Rt = Rc×RR
Rt = Rc×RR
= 8% × 0.36
= 2.9%
Rt = Rc×RR
= 1% × 4.3
= 4.3%
Step 4: Estimate the
individualized absolute risk
reduction (ARR)
ARR = Rc − Rt (from step 1 and 3) ARR = 8.0% – 2.9%
= 5.1%
ARR
= 1% – 4.3%
= –3.3%
Step 5: Estimate the
individualized number
needed to treat (NNT) or
number needed to harm
(NNH)
NNT = 100/ARR NNT = 100/5.1 = 20 NNT = 100/–3.3= –30
or NNH = 30
Note: Sometimes your only source for step 1 is the control group in the trials themselves. If this is the case, then you don’t need to go
through all five steps. The individualized NNT for your patient is the one reported in the study.
Exercises:
1. What would the NNT be in the example in column 3, if the baseline risk for ischemic stroke was (a) 16%; (b) 32%?
2. What would the NNH be in the example in column 4, if the baseline risk for extracranial haemorrhage was (a) 2%; (b) 4%?
Answers: 1(a) 10; 1(b) 5; 2(a) 15; 2(b) 7
62. 40 CH02 EVALUATION OF ARTICLES ON THERAPY
balanced manner. Tools that have been used for this purpose
are called patient decision aids. They may take the form of audio
or video tapes, illustrations or reading materials, and have been
shown to improve knowledge as well as stimulate participation
in decision-making[21]
.
Patients are unlikely to understand RR, RRR or ARR easily,
so a better way to express treatment effects would be to
simply show them the changes in risk. Using the example of
warfarin for patients with atrial fibrillation but no valve disease
(Tackle Box 2.4), we might summarize the individualized effect
of treatment as follows.
Benefit: The risk of ischemic stroke falls from 8.0% to 2.9% per year.
Harm: The risk of haemorrhagic stroke rises from 1.0% to 4.3% per
year.
Cost: Average treatment cost would be US $365 per year (based on
Philippine prices as of 2007).
Unfortunately, presenting information in this way may be chal-
lenging for many patients[22]
. An effective way of simplifying this
would be to present a face table[23, 24]
. Face tables consist of 100
faces, coloured or shaded to indicate the probability of certain
outcomes. In the example in Figure 2.2, two sets of 100 faces
represent treated and untreated patients. White ‘smiley’ faces
No warfarin Warfarin
Legend:
No outcome
Stroke
Hemorrhage
Legend:
No outcome
Stroke
Hemorrhage
Figure 2.2 Face table summarizing the effect of warfarin in a patient with
atrial fibrillation but no valve disease
63. REFERENCES 41
represent patients who do well, dark grey ‘frowny’ faces represent
patients who develop the unfavourable outcome being prevented
(e.g. stroke), and the light grey ‘frowny’ faces represent the
number with an adverse effect (e.g. extracranial haemorrhage).
Decision aids such as these face tables enable patients to visualize
the trade-offs between benefit and harm better than numbers can.
2.6 Summary
Articles on therapy are probably the most common types of
articles that we come across. When confronted with a therapy
article, first appraise directness: does it directly address a question
that is important to you? If it does, appraise validity to decide if
the results are credible. Try to save yourself some time. You don’t
need to read the entire article. Just go straight ahead and seek
answers to each of the validity questions. If you are satisfied that
the study is valid, proceed to appraise the results. However, do not
simply accept the findings hook-line-and-sinker. Remember, you
still have to assess applicability. If you are satisfied with directness,
validity, the results and applicability, then individualize the results
to estimate specific effects on your individual patient. Involve
them in decisions when necessary, by sharing what you know
about risks, benefits and costs.
References
[1] Grady D, Chaput L and Kristof M. 2003. Results of Systematic Review
of Research on Diagnosis and Treatment of Coronary Heart Disease in
Women, Evidence Report/Technology Assessment No. 80. University
of California, San Francisco-Stanford Evidence-Based Practice Center.
AHRQ Publication No. 03-E035.
[2] Chobanian AV, Bakris GL, Black HR, Cushman WC, Green LA,
Izzo JL Jr, Jones DW, Materson BJ, Oparil S, Wright JT Jr and
64. 42 CH02 EVALUATION OF ARTICLES ON THERAPY
Roccella EJ. 2003. Joint National Committee on Prevention, Detection,
Evaluation, and Treatment of High Blood Pressure. National Heart,
Lung, and Blood Institute; National High Blood Pressure Education
Program Coordinating Committee. Seventh report of the Joint National
Committee on Prevention, Detection, Evaluation, and Treatment of
High Blood Pressure. Hypertension. 42(6): 1206–1252. Epub 2003
Dec 1. http://www.nhlbi.nih.gov/guidelines/hypertension/express.pdf
[3] Epstein AE, Bigger JT, Wyse DG, Romhilt DW, Reynolds-Haertle RA
and Hallstrom AP. 1991. Events in the Cardiac Arrhythmia Suppression
Trial (CAST): mortality in the entire population enrolled. Journal of
American College of Cardiology. 18(1): 14–19.
[4] Moore TJ. 1995. Deadly Medicine. Simon Schuster: New York.
[5] Ezekowitz MD, Bridgers SL, James KE, Carliner NH, Colling CL and
Gornick CC. 1992. Warfarin in the prevention of stroke associated with
nonrheumatic atrial fibrillation. Veterans affairs stroke prevention in
nonrheumatic atrial fibrillation investigators. New England Journal of
Medicine. 327: 1406–1412.
[6] http://www.cdc.gov/epiinfo/epiinfo.htm
[7] http://www.statpac.com/statistics-calculator/index.htm
[8] Riffenburgh RH. 2006. Statistics in Medicine. Second Edition. Academic
Press: USA.
[9] Ridker PM, Cook NR, Lee I, Gordon D, Gaziano JM, Manson JE,
Hennekens CH and Buring JE. 2005. A randomized trial of low-dose
aspirin in the primary prevention of cardiovascular disease in women.
New England Journal of Medicine. 13(352): 1293–1304.
[10] Adu FD, Akinwolere OA, Tomori O and Uche LN. 1992. Low
seroconversion rates to measles vaccine among children in Nigeria.
Bulletin of World Health Organisation. 70: 457–460.
[11] Bautista-Lopez N, Vaisberg A, Kanashiro R, Hernandez H and Ward
BJ. 2001. Immune response to measles vaccine in Peruvian children.
Bulletin of World Health Organisation. 79: 1038–1046.
[12] Falkner B and Kushner H. 1990. Effect of chronic sodium loading on
cardiovascular response in young blacks and whites. Hypertension. 15:
36–43.
[13] McDowell SE, Coleman JJ and Ferner RE. 2006. Systematic review
and meta-analysis of ethnic differences in risks of adverse reactions to
drugs used in cardiovascular medicine. British Medical Journal. 332:
1177–1181. DOI 10.1136/bmj.38803.528113.55.
[14] Villari P, Manzoli L and Boccia A. 2004. Methodological quality of
studies and patient age as major sources of variation in efficacy esti-
65. REFERENCES 43
mates of influenza vaccination in healthy adults: a meta-analysis.
Vaccine. 22(25–26): 3475–3486.
[15] Mharakurwa S, Manyame B and Shiff CJ. 1997. Trial of the ParaSight-F
test for malaria diagnosis in the primary health care system, Zimbabwe.
Tropical Medicine/International Health. 2: 544–550.
[16] Bell D, Go R, Miguel C, Walker J, Cacal L and Saul A. 2001. Diagnosis of
malaria in a remote area of the Philippines: comparison of techniques
and their acceptance by health workers and the community. Bulletin
of World Health Organisation. 79: 933–941.
[17] http://www.intmed.mcw.edu/clincalc/heartrisk.html
[18] http://www.chd-taskforce.com/calculator/calculator.htm
[19] Rothman KJ. 2002. Epidemiology. Chapter 3. Oxford University Press:
Oxford; p. 46–49.
[20] Saxena R and Koudstaal PJ. 2004. Anticoagulants for preventing stroke
in patients with nonrheumatic atrial fibrillation and a history of stroke
or transient ischaemic attack. Cochrane Database of Systematic Reviews.
2:CD000185. DOI: 10.1002/14651858.CD000185.pub2.
[21] O’Connor AM, Stacey D, Rovner D, Holmes-Rovner M, Tetroe J,
Llewellyn-Thomas H, Entwistle V, Rostom A, Fiset V, Barry M and Jones
J. 2001. Decision aids for people facing health treatment or screening
decisions. Cochrane Database of Systematic Reviews. 3:CD001431.
Update in 2003 2:CD001431.
[22] Edwards A, Hood K, Matthews EJ, Russell D, Russell IT, Barker J, Pill R
and Stott N. 2000. The effectiveness of one-to-one risk communica-
tion interventions in health care: a systematic review. Medical Decision
Making. 20: 290–297.
[23] Santesso N, Maxwell L, Tugwell PS, Wells GA, O’Connor AM,
Judd M and Buchbinder R. 2006. Knowledge transfer to clinicians
and consumers by the Cochrane Musculoskeletal Group. Journal of
Rheumatology. 33(11): 2312–2318.
[24] Feldman-Stewart D, Kocovski N, McConnell BA, Brundage MD, and
Mackillop WJ. 2000. Perception of quantitative information for treat-
ment decisions. Medical Decision Making. 20: 228.
68. 46 CH03 EVALUATION OF ARTICLES ON DIAGNOSIS
3.1 Appraising directness
Questions on diagnosis should be phrased in terms of the
following variables: P, the patient population on whom the test
might be done; E, the exposure (in this case the test to be
performed); and O, the outcome (i.e. the condition that the test
is supposed to diagnose). Examples include:
Among postmenopausal women presenting with a breast mass (P), how
accurate is fine needle aspiration biopsy (E) in establishing the presence
or absence of breast cancer (O)?
In Bacille Calmette Guerin (BCG)-vaccinated children (P), how accu-
rate is an interferon- assay (E) in establishing the presence or absence
of tuberculosis (O)?
As in articles on therapy, before even reading an article, the first
thing we must do is evaluate directness i.e. how well the PEO
in the study (the research question), corresponds with your own
PEO (the clinical question). Did the study evaluate the kind of
patients you are interested in? Is the test in the study exactly
the one you want? Is the disease which is being diagnosed the
same? If you feel the article might provide a reasonably close
answer to the question you ask, then proceed to evaluate it in
greater detail. Otherwise, it would be wiser to spend your time
on something else.
3.2 Appraising validity
Question #1: Was the reference standard an
acceptable one?
To measure the accuracy of a particular test we need to compare
its results to a reference standard, a test that can unequivocally