FUTURE UPGRADATIONS AND GAP FILLING IN FLEWS/DMS DATABASE
•
0 likes•47 views

The document outlines a plan to upgrade the FLEWS/DMS system in Assam, India through database preparation and upgrading, methodology upgrading, and automation. Key activities proposed include: 1. Re-digitizing river layers from high resolution imagery and updating attribute data. 2. Collecting coordinate data for gauge stations and rainfall stations to integrate them into the database. 3. Creating rainfall grids, isohyets and Thiessen polygons from station data for hydrological model calibration. 4. Updating alert maps with latest imagery, catchment boundaries and other layers. 5. Rebuilding HEC-HMS hydrological models using updated inputs and calibration with stage-discharge data

Recommended
Recommended
More Related Content
What's hot
What's hot (19)
Viewers also liked
Viewers also liked (14)
Similar to FUTURE UPGRADATIONS AND GAP FILLING IN FLEWS/DMS DATABASE
Similar to FUTURE UPGRADATIONS AND GAP FILLING IN FLEWS/DMS DATABASE (20)
Recently uploaded
Recently uploaded (20)
FUTURE UPGRADATIONS AND GAP FILLING IN FLEWS/DMS DATABASE
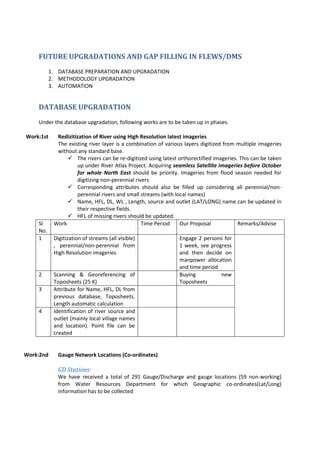
- 1. FUTURE UPGRADATIONS AND GAP FILLING IN FLEWS/DMS 1. DATABASE PREPARATION AND UPGRADATION 2. METHODOLOGY UPGRADATION 3. AUTOMATION DATABASE UPGRADATION Under the database upgradation, following works are to be taken up in phases. Work:1st Redizitization of River using High Resolution latest imageries The existing river layer is a combination of various layers digitized from multiple imageries without any standard base. The rivers can be re-digitized using latest orthorectified imageries. This can be taken up under River Atlas Project. Acquiring seamless Satellite imageries before October for whole North East should be priority. Imageries from flood season needed for digitizing non-perennial rivers Corresponding attributes should also be filled up considering all perennial/non- perennial rivers and small streams (with local names) Name, HFL, DL, WL , Length, source and outlet (LAT/LONG) name can be updated in their respective fields. HFL of missing rivers should be updated. Sl No. Work Time Period Our Proposal Remarks/Advise 1 Digitization of streams (all visible) , perennial/non-perennial from High Resolution imageries Engage 2 persons for 1 week, see progress and then decide on manpower allocation and time period 2 Scanning & Georeferencing of Toposheets (25 K) Buying new Toposheets 3 Attribute for Name, HFL, DL from previous database, Toposheets. Length automatic calculation 4 Identification of river source and outlet (mainly local village names and location). Point file can be created Work:2nd Gauge Network Locations (Co-ordinates) GD Stations: We have received a total of 291 Gauge/Discharge and gauge locations (59 non-working) from Water Resources Department for which Geographic co-ordinates(Lat/Long) information has to be collected
- 2. Non-recording Rainfall Stations: Apart from IMD/MOSDAC AWS stations various state departments have a number of non- recording(manual) rain-gauge stations. Also there is a good network of tea garden raingauge stations for which regular data is collected. We have received few data from AWRD in this regard. But marking GPS locations of these stations should be a priority. Recording rain gauge stations: The IMD/MOSDAC stations should be marked for erroneous, constant and correct data providing stations. Also, last 10-15 years data in time-series should be collected from these departments. Sl No. Work Time Period Our Proposal Remarks/Advise 1 Identifying tentative locations from existing database. Mark stations using Imagery/Google earth 2 Collection of location using GPS Outlet of rivers (department local names) 3 Letters to IMD/MOSDAC- data order. Minimum 33 years data needed for hydrological works Preferably in person 4 Letters to CWC (gauge/discharge) - data order. Minimum 33 years data needed for hydrological works Data in soft copy 5 Data Entry (in case data comes in hard copy format) 6 Arrange data according to modelling needs Format to be decided according to software. Work:3rd Rainfall for HMS calibration A rainfall grid/isohyets/thiessen polygons can be created from combined IMD/MOSDAC/Non-recording gauges so that the existing FLEWS models can be calibrated. Sl. No. Work Time Period Our Proposal Remarks/Advise 1 Creating rainfall grids from available data Procedure to be discussed in detail 2 Create thiessen polygons from station points Direct from points 3 Create Isohyets from Grids. Orographically weighted isohyets should be preference Procedure to be discussed in detail 4 Create 2-year Precipitation grid Procedure to be discussed in detail
- 3. Work:4th Update Alert Maps The present Alert Maps for various rivers can be updated with inclusion of - latest imagery, catchment boundary, digitized rivers, RCs and place marks. Sl No Work Time Period Our Proposal Remarks/Advise 1 Identification and collection of layers 2 Create River Maps with the following details - River Highlighted - Subcatchment - Revenue Circle Boundary - Village Points (few selected) - Schools/Hospitals/Police Stations Work:5th GIS layers from State Departments: Latest Revenue Circle (RCs) and District Boundary to be obtained from ASDMA. Also, River Map of Assam with minor rivers marked can be obtained so that attributes in our existing vector layer can be updated. Work:6th Quality check of AWRD data and Gap area identification The Stage and Discharge data received from AWRD should be checked for errors and arranged chronologically. Gap areas should be identified and filled. Sl. No Work Time Period Our Proposal Remarks/Advise 1 Check data availability by month and year. Identification of gaps 2 Collection of Discharge Calculation Sheets Work:7th Cross-sections of rivers at gauge sites Most gauge stations have been fitted at foothills (Upstream) and near Brahmaputra (Downstream) respectively. Although it is physically not possible to collect cross-sections every 5-10 km, it can at least be collected at 2 gauge locations per river. This will serve two purposes- 1. Development of Rating curve 2. Estimating regular discharge by theoretical methods Work:8th Development of Rating curves With the availability of Gauge/Discharge data, Rating Curves can be developed for flood prone rivers. This will help us in flood alert after HMS model calibration is complete. Also, the consideration of current discharge in the river can be taken with predicted model discharge.
- 4. Sl. No Work Time Period Our Proposal Remarks/Advise 1 Rating Curve from CWC data 2 Rating curve from WRD data 3 Synthetic rating curve development for gauge stations (without discharge measurement) 4 AUTOCAD - Hydraulic area and perimeter 5 Sheets for regular gauge data and discharge by theoretical methods Work:9th Embankment shapefile The latest embankment shapefile should be collected before September 2016 from Chief Engineer Office, Chandmari, Guwahati. METHODOLOGY UPGRADATION Work:1st Delineation of catchments using latest and updated DEM, Imagery and River File. The latest CARTO DEM should be collected from NRSC. Sl. No Work Time Period Our Proposal Remarks/Advise 1 Delineation of rivers & catchments. 2 Sub-catchment size to be kept for 9km WRF. Merging and splitting Work:2nd Development of CN Grid from 10k LULC and SOIL layer With the availability of 10 K data, the previous CN Grids can be updated for HMS models. Work:3rd Development of HEC-HMS models The HEC-HMS models will be rebuilt using latest CN Grid and Delineated layers. Two sets of models should be built depending on Input data to be used - 1. WRF Input Models WRF grid at 9km will be used as input 2. Real rainfall Input models The rainfall grid created in Work-3(Database Upgradation) will be used for daily model runs. Further consideration for Antecedent Moisture Conditions (AMC-I, AMC-II and AMC-III) should be taken in models. Thus a total of 6 sets of models should be kept for operational phase.
- 5. Work:4th Routing Methods HEC-HMS The existing Muskingum method can be kept but rivers should be updated to 8 pointer scheme (from rectangular currently). A common problem faced in this method was river slope from DEM. SOI Topo Maps can be used for the purpose. Also river widths can be used from Google maps as even minor streams are visible. Work:5th Loss and Transform methods in HEC-HMS The loss method can be converted to 'Gridded SCS Curve Number' from 'SCS Curve number' currently to account for diverse land use within sub-basins. Current method averages the CN values in various grids instead of considering them separately. The change in loss method will automatically force to use ModClark Transform method. But we need to create 2-year precipitation grid for the above. Work:6th Optimization and calibration of the models The models finally built should be calibrated with real-rainfall and stage-discharge curves and comparison with past flood events. Work:7th Threshold preparation for each rivers With completion of Rating Curves and HMS Model optimization Threshold setting for floods can be done for various flood prone rivers. Different threshold setting should be kept for Real and Forecasted rainfall. Work:8th WRF Model calibration The WRF models can be calibrated using rainfall grids created in Work-3: Work Upgradation Also, RADAR data assimilation in models can be taken up. Work:9th Hydraulic Models With the availability of data and completion of above works, HEC-RAS/MIKE -11 1D Models can be setup for major gauged rivers in a catchment. The WRD water levels received daily can be boundary inputs into the models and result comparison can be done using developed rating curves. With operationalization of NER-DRR server facility MIKE FLOOD models can also be run at pilot basis and flood maps can be given to ASDMA. AUTOMATION The automation work can be started with help of NESAC IT team. Work:1st HMS Model Input With the completion of all models it will be necessary to run approximately 80 models daily for which a automation is must. Work:2nd SMS based Water Level & Rainfall
- 6. NESAC can provide mobiles/simcards to personnel collecting water level and rainfall or to DDMA offices. The numbers will be linked to NESAC servers and a datasheet. This will almost save lot of useful time. A similar method is being followed in Bangladesh. This will be much more effective than app based service in Assam scenario. Work:3rd Map and Graph creation similar to other organizations like IMD/CWC - Water Level Graphs with DL, WL and HFL showing trend for 5-7 days - Rainfall Graphs - Discharge Graphs Work:4th Display HEC-HMS and RAS/MIKE Result Graphs Work:5th Interactive Inundation and WL/Discharge change maps An interactive portal can be created similar to Flood Modeller (previously ISIS) software viewer showing inundation level with change in WL/Discharge Work:6th Preparation of FLEWS portal Work:7th Preparation of Decision making tool A central system inclusive of all databases, thresholds, hydrologic and atmospheric data can be prepared. Help can be taken of National Oceanic and Atmospheric Administration (NOAA) guidance on Early Warning Systems. With completion of above said works this can be easily taken up.