Tech-Forward - Achieving Business Readiness For Copilot in Microsoft 365
2.article on socio economic 14 25
1. Journal of Economics and Sustainable Development www.iiste.org
ISSN 2222-1700 (Paper) ISSN 2222-2855 (Online)
Vol.2, No.8, 2011
Socioeconomic Characteristics of Beneficiaries of rural credit
Muhammad Amjad Saleem
Government College of Commerce & Management Sciences
Dera Ismail Khan (Pakistan)
Revised: October 19th, 2011
Accepted: October 29th, 2011
Published: November 4, 2011
Abstract
Agriculture is not only the backbone of our food, livelihood and ecological security system, but is also the
very soul of our sovereignty. In Pakistan population density is high and has been increasing day by day and
agricultural land has been decreasing because of fragmenting or converting it into residential plots. To meet
the domestic food requirements and raising standard of life use of improved production technologies
developed by research is must. In this behalf government of Pakistan has been extending loan to poor
farmers for adoption of new farm technology; a capital intensive technology. Right adoption of new farm
technology depends on different demographic factors of farmers. Therefore objective of the paper was to
see who benefits more of credit. Primary data regarding different determinants effecting well being of
farmers after use of credit was collected from 320 farmers who participated in credit using stratified
sampling technique through questionnaire and interview. Descriptive statistics,ANOVE and Linear
regression model was applied with the help of SPSS.Education and visiting agriculture information centre
were found significant suggesting younger more educated farmers who visits information centre be
provided credit ,as they had ability to improve their standard.
Keywords Rural credit; house hold economic welfare
Introduction
International prose asserts that rural credit began alleviating poverty quite a lot of decades ago when
organization of different nations started testing the notions of lending to the people who were on the
breadline .According to Vogt (1978), credit may provide people a chance to earn more money and improve
their standard of living
Agriculture sector in Pakistan is contributing nearly 22% to the national income of Pakistan (GDP) and
employing just about 45% of its workforce. As much as 67.5% of country’s population living in the rural
areas is directly or indirectly reliant on agriculture for its livelihood (Government of Pakistan,
2008).Agriculture as a segment depends more on credit than any other segments of the financial system
because of the seasonal variations in the farmers’ returns and a varying tendencies from subsistence to
commercial farming. Most small farmers cannot back their farming business from their inadequate savings.
These farmers therefore require support in the form of assembly credit in order to take up relevant
technologies to improve their farm productivity and income (Ater et al., 1991).
Dera Ismail Khan division lies in the arid zone of Pakistan and is located in the extreme south of the
Khyber Pakhton Khawa Province at the bank of river Indus. Total geographic area of 0.73 million hectares
out of which only 0.24 million hectares is cultivated. About one third of the cultivated area is irrigated
while the other two third depends on rainfall and hill torrents for its moisture requirements. Main stay of
peoples of this area is agriculture and over 75% population derives its earning directly or indirectly from
agriculture, till recently, farmers are a poor segment of population of this district. Their income is quite
meager. Technical know how is limited. Where farmers of study area need practical guidance in the
Page | 14
www.iiste.org
2. Journal of Economics and Sustainable Development www.iiste.org
ISSN 2222-1700 (Paper) ISSN 2222-2855 (Online)
Vol.2, No.8, 2011
application of new farm technical know how there they need credit to apply this capital intensive
technology. Therefore main objective of paper was to see socioeconomic characteristics of farmers who has
ability to improve their standard as a result of using rural credit in their farms and hence a good impact on
the economy of the area.
Literature
Getting access to credit helps the poor improve their productivity and management skills and hence,
increase their income and other benefits such as health care and education. Pragmatic evidence can be
originated from various papers, such as (Morduch, 1995; Gulli, 1998; Khandker, 1998; Pitt and Khandker,
1998; Zeller, 2000; Parker and Nagarajan, 2001; Khandker, 2001; Khandker and Faruque, 2001; Coleman
,2002; Pitt and Khandker, 2002; Khandker, 2003)
Quach, Mullineux and Murinde (2003) found that household credit contributes positively and significantly
to the economic wellbeing of households in terms of per capita expenditure, per capita food expenditure
and per capita non-food expenditure. The positive effect of credit on household economic wellbeing was
apart from whether the households were poor or better-off.
Every budding borrower faced a credit limit because of asymmetries of information between borrowers and
lenders and the imperfect enforcement of loan contracts. At the national level, access to bank credit was
positively and significantly influenced by age, being male, household size, education level, household per
capita expenditure and race (Kavanamur, 1994; Okurut et al, 2004; Okurut, 2006; Diagne et al,2000;Giagne
and Zeller 2001). Small landholder farmers were too poor to benefit from any kind of credit, and that, even
if they had access to ample credit and inputs, their land constraints were so cruel that any increase in
productivity would fall short of guaranteeing their food security (Fredrick and Bokosi, 2004). The formal
lenders took on strict collateral rudiments to lessen dodging thus straightening out poor from the process.
Status, the dependency ratio of households, and the amount of credit applied for by the household were
recognized as the determinants of credit rationing by the bank. The low level of proceeds and asset
escalation made the poor household unappealing and caused high-risk contour for formal lenders (Duong et
al, 2002; Pal, 2002; Barslund and Tarp, 2007). Credit was not a profiting activity for small farmers (Saboor
et al, 2009). Literacy was positively and significantly related with saving due to interventions in credit by
farmers Panda (2009) household size, number of visit by extension agent, farm size,hired Labour,
agrochemical, fertilizer and seedling were positively related with income, while age, educational level and
Level of participation were negatively related to income earned by the farmers due to interventions in
credit. Among these variables, farm size was the most significant (Kudi et al, 2009).If agriculture credit is
methodically institutionalized for small farmers; agricultural progress can be materialized. Due to small
holdings, low crop yields and small income, there is very petite saving among the best part of Pakistani
farmers (Abedullah et al, 2009).The farmers with upper level of education had better thoughtful about the
role of credit in getting modern technology and the role of technology to augment output therefore were
demanding large amount of credit as compared to farmers with low down education. Large farmers could
afford to take bigger amount of credit because they had relatively large piece of land to put in the bank as
collateral
Methodology
Primary data from 320 farmers who participated in farm credit were collected using stratified sampling
technique on farm and farmers’ characteristics affecting wellbeing of farmers with the help of structured
questionnaire and interview as used by many researchers such as (Nunung et al, 2005,Oladosu, 2006;
Faturoti et al, 2006).Apart from various closed end questions on different determinants that might effect
well being, questionnaire also contained a question with such attributes that were indicators of change in
well being of farmers for frequency count. Such attributes were also designed on five scales for knowing
regression impacts of different determinants on well being of farmers. Statistical Package for Social
Page | 15
www.iiste.org
3. Journal of Economics and Sustainable Development www.iiste.org
ISSN 2222-1700 (Paper) ISSN 2222-2855 (Online)
Vol.2, No.8, 2011
Sciences (SPSS) was used for frequency counts, correlation check and ANOVA test. Regression analysis
was applied to know cause and effect on the works of (Oladosu, 2006; Kizilaslan and Omer,
2007;Olagunju, 2007).
Modeling
The General Linear Model is commonly estimated using ordinary least square has become one of the most
widely used analytic techniques in social sciences (Cleary and Angel 1984). Most of the statistics used in
social sciences are based on linear models, which means trying to fit a straight line to data collected.
Ordinary least square is used to predict a function that relates dependent variable (Y) to one or more
independent variables (x1, x2, x3…xn). It uses linear function that can be expressed as
Y = a + bXi + ei
Where
a Constant
b Slope of line
Xi Independents variables
ei Error term
Hence to assess contribution of different determinants in wellbeing due to intervention in farm credit Linear
Regression Model was expressed as follow
Y (Well being of farmers) = a (constant) + X1 (Age) +X2 (Education) + X3 (Family size) + X4 (Farm size)
+ X5(Farming experience) + X6 (Numbers of times credit attained) + X7(Visiting agricultural information
system) + ei (Error term)
Analysis and Interpretation
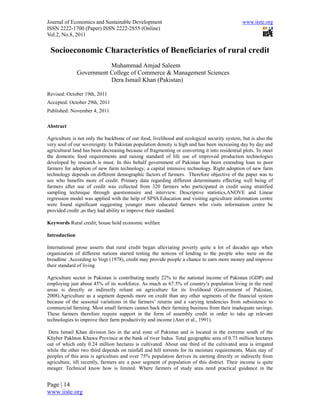
Table 1 indicates that before taking credit mostly farmers lacked personnel transport facilities,
entertainments facilities communications facilities, furnished houses, better health and education facilities
etc. After using credit for production purpose, now 180 farmers out of 320 possessed TV, 198 out of 320
had telephone facility, 182 out of 320 got motor cycle facility, 268 out of 320 had car facility, 254 out of
320 built new furnished houses, 214 out of 320 had got admitted their children in private schools for better
education, 188 out of 320 got access to better health facilities and 224 out of 320 could enjoy visiting other
cities.
Table 1 Change in living standard of farmers after use of farm credit
Possessions Frequency(BLA) Frequency ALA)
More land 150 170
TV 140 180
Telephone 122 198
Motor cycle 138 182
Car 52 268
New house 66 254
Send child to govt schools 162 158
Send child to private schools 106 214
Seeing doctor in cities 132 188
Eating in restaurants 62 258
Keeping livestock for business 44 276
House renovation 168 152
Page | 16
www.iiste.org
4. Journal of Economics and Sustainable Development www.iiste.org
ISSN 2222-1700 (Paper) ISSN 2222-2855 (Online)
Vol.2, No.8, 2011
Member in an organization 82 238
Visit other cities 96 224
BLA= Before loan attainment, ALA=After loan attainment
300
250
200
Before
150
After
100
50
0
r
TV
nd
s
Ph
Dr
H
R
t
.M
.C
c
C
Sc
Ca
S
Re
.S
N.
H.
V.
M
L.
La
O
P.
G
Detailed discussion of impact of using agricultural credit on living standard with respect to different farms
and farmers characteristics
Age
Impact of use of agricultural credit on middle-aged farmers (31 years to 45 years) to improve their living
standard was more than lower (15 years to 30 years) or upper (46 or above) age group of farmers (table2)
Table 2 Descriptive statistics of the Impact of using farm loan on living
standard with respect to age group of farmers
Age % of
Possessions Total
15-30 31-45 46-above 31-45
More land 46 68 56 170 40
TV 50 68 62 180 37.77778
Telephone 64 66 68 198 33.33333
Motor cycle 56 66 60 182 36.26374
Car 68 110 90 268 41.04478
New house 80 94 80 254 37.00787
Send child to govt schools 50 66 42 158 41.77215
Send child to private schools 52 92 70 214 42.99065
Seeing doctor in cities 52 70 66 188 37.23404
Eating in restaurants 72 98 88 258 37.9845
Keeping livestock for business 82 112 82 276 40.57971
House renovation 46 56 50 152 36.84211
Member in an organization 66 102 70 238 42.85714
Visit other cities 68 78 78 224 34.82143
Source: - Field survey
Page | 17
www.iiste.org
5. Journal of Economics and Sustainable Development www.iiste.org
ISSN 2222-1700 (Paper) ISSN 2222-2855 (Online)
Vol.2, No.8, 2011
Middle-aged farmers mostly paid more attention on the education of their children. Out of 214 farmers who
paid attention on the education of there children 92 (43%) belonged to middle age group. Out of 238
respondents who after taking benefits from use of credit for their agriculture production improved their
living standard being a member of an organization 102(42.85%) belonged to middle ages farmers led to 70
farmers of upper age group. Out of 268 respondents who improved their standard having personal transport
facility after the use of credit for agricultural production 110(41%) belonged to middle age group followed
by 90 farmers of upper age group Thirty seven percent respondents now had better health facilities. Age
group had no significant impact (p=0.706) on living standard (table3). . Change in living standard depends
upon income and also upon developed communication & transport means, religious and social values
attached with the change. Farmers of either age changed their living standard when they had better income.
Table 3 Impact of following farm and farmers characteristics (using ANOVA)
Sum of
Variable Levels df Mean Square F Sig
Squares
Age Between group 6.621 2 3.311 .349 .706
With in Group 3009.379 317 9.493
Total 3016.000 319
Education Between group 36.823 2 18.412 1.959 .143
With in Group 2979.177 317 9.398
Total 3016.000 319
Farming Between group 28.392 2 14.196 1.506 .223
Experience With in Group 2987.608 317 9.425
Total 3016.000 319
Family Size Between group 24.855 2 12.428 1.317 .269
With in Group 2991.145 317 9.436
Total 3016.000 319
Farm Size Between group 227.961 2 113.981 12.960 .000
With in Group 2788.039 317 8.795
Total 3016.000 319
Numbers of Between group 724.433 2 362.217 50.107 .000
times credit With in Group 2291.567 317 7.229
attained Total 3016.000 319
Education
Better educated farmers in study area improved their living standard more than illiterates and low educated
farmers after taking benefits from the use of credit for crop productivity (table 4).
Table 4 Descriptive statistics of the Impact of using farm loan on living
standard with respect to educational grouping of farmers
Education
% of above
Possessions Up to Up to Above Total
secondary
primary secondary secondary
More land 28 68 74 170 43.52941
TV 36 78 66 180 36.66667
Telephone 44 74 80 198 40.40404
Motor cycle 34 74 74 182 40.65934
Car 54 110 104 268 38.80597
New house 54 96 104 254 40.94488
Send child to govt schools 28 64 66 158 41.77215
Send child to private schools 42 96 76 214 35.51402
Seeing doctor in cities 40 72 76 188 40.42553
Eating in restaurants 50 103 104 257 40.46693
Keeping livestock for business 50 112 114 276 41.30435
Page | 18
www.iiste.org
6. Journal of Economics and Sustainable Development www.iiste.org
ISSN 2222-1700 (Paper) ISSN 2222-2855 (Online)
Vol.2, No.8, 2011
House renovation 26 62 64 152 42.10526
Member in an organization 40 102 96 238 40.33613
Visit other cities 48 88 88 224 39.28571
Source: - Field survey
Forty three point fifty three percent (43.53%) respondents among those respondents who now had more
farmlands after use of farm credit were educated above secondary level. Out of 152 respondents who had
better residence than before using credit for crop productivity 64 (42.10%) were educated above secondary
level followed by 62 farmers who were educated up to secondary level. Among 182 and 198 respondents
who got access to more transport and communication facilities than before using credit 74 (41.65%) and 80
(40.40%) respondents respectively belonged to those farmers who had education above secondary level.
Education affected insignificantly (p=0.143) the living standard of the farmers (table3). Farmers of any
education level got possessions of those food and non-food items that improved their standard of living
when they had more income due to agricultural growth after using farm credit for adoption
Farming experience
More experienced farmers (experience of 21years or above) improved their living standard more than less
experienced farmers after the use of farm credit (table5).
Table 5 Descriptive statistics of the Impact of using farm loan on living
standard with respect to farming experience group.
Farming Experience (in years) % Of 21
Possessions Total
& Above
1-10 11-20 21-above
More land 34 60 76 170 44.70588
TV 44 50 86 180 47.77778
Telephone 38 58 102 198 51.51515
Motor cycle 34 64 84 182 46.15385
Car 56 92 120 268 44.77612
New house 52 88 114 254 44.88189
Send child to ovt schools 38 50 70 158 44.3038
Send child to private schools 50 76 88 214 41.1215
Seeing doctor in cities 40 58 90 188 47.87234
Eating in restaurants 49 84 124 257 48.24903
Keeping livestock for business 66 92 118 276 42.75362
House renovation 32 44 76 152 50
Member in an organization 56 84 98 238 41.17647
Visit other cities 38 76 110 224 49.10714
Source: - Field survey
Out of 268 respondents who improved them in getting personal Out of 198 respondents who got access to
better communication facilities after the use of credit for crop productivity 102(51.52%) respondents had
more than 20 years of farming experience. Out of 152 respondents who now lived in renovated houses after
the use of credit for crop productivity 76 (50%) respondents belonged to those farmers who had more than
20 years of farming experience. Out of 257 farmers who could entertain them in restaurants after the use of
credit for crop productivity124 (48.25%) were highly experienced conveyance after the use of credit for
crop productivity 120(44.78%) belonged to those respondents who had more than 20 years of farming
experience led to 92 respondents who had farming experience of 11years to 20 years. Among 224
respondents who now could visit other cities110 (49.10%) respondents were highly experienced farmers.
Page | 19
www.iiste.org
7. Journal of Economics and Sustainable Development www.iiste.org
ISSN 2222-1700 (Paper) ISSN 2222-2855 (Online)
Vol.2, No.8, 2011
Farming experience group had no significant impact (p=0.223) on change in living standard (table3).
Farmers with any farming experience in study area changed their standard of living when they saw change
in other fellows.
Family size
Respondents who had medium family size (6 members to 10 members) raised their living standard more
than those respondents who had small family size (1 member to 5 members) or big family (more than 10
members) after use of credit for crop productivity (table 6).
Table 6 Descriptive statistics of the Impact of using farm loan on living
standard with respect to family size .
Family Size (in members) % 0f
Possessions Total
1-5 6-10 11-above 6-10
More land 60 76 34 170 44.70588
TV 46 100 34 180 55.55556
Telephone 48 112 38 198 56.56566
Motor cycle 58 94 30 182 51.64835
Car 78 140 50 268 52.23881
New house 74 136 44 254 53.54331
Send child to Govt schools 38 84 36 158 53.16456
Send child to private schools 56 124 34 214 57.94393
Seeing doctor in cities 52 114 22 188 60.6383
Eating in restaurants 72 145 40 257 56.42023
Keeping livestock for business 86 144 46 276 52.17391
House renovation 40 90 22 152 59.21053
Member in an organization 74 118 46 238 49.57983
Visit other cities 54 138 32 224 61.60714
Source: - Field survey
Out of 257 respondents who had now better food opportunities than before use of credit for crop
productivity 145 (56.42%) respondents belonged to those farmers who had medium family size. Out of 276
respondents who had now more livestock than before use of credit for crop productivity 144 (52.17%)
respondents belonged to those farmers who had medium family size.Out of 268 respondents who had now
personal conveyance than before use of credit for crop productivity 140(52.23%) respondents belonged to
those farmers who had medium family size. Out of 224 respondents who were able to visit other cities after
use of credit for crop productivity138 (61.61%) respondents belonged to those farmers who had medium
family size. Out of 254 respondents who lived in new house after use of credit for crop productivity 136
(53.54%) respondents belonged to those farmers who had medium family size. Out 214 respondents who
had got admitted their children in private schools for better education after using credit for crop
productivity 124 (57.94%) respondents belonged to those farmers who had medium family size. Out of 188
respondents who got better health facilities after using credit for crop productivity 114(60.63%)
respondents belonged to those farmers who had medium family size. Family size had no significant impact
(p=0.269) on standard of living (table3). Farmers in study area changed their living standard because where
they earned more due to increased crops productivity after taking benefits from using farm credit there they
accepted effects of having better communication and transport facilities provided them from government.
Farm size
Impact of using credit for farming purpose on welfare of farmers was more on those farmers who had small
farm lands (up to 400 canal) than those farmers who had farms of medium size (401 canal to 800 canal) or
big size (more than 800 canal). Greater attention of small farmers for their welfare was on livestock, better
Page | 20
www.iiste.org
8. Journal of Economics and Sustainable Development www.iiste.org
ISSN 2222-1700 (Paper) ISSN 2222-2855 (Online)
Vol.2, No.8, 2011
eating, becoming member in organizations, visiting other cities, personal conveyance, Communication
facilities and better housing respectively (table7).
Table 7 Descriptive statistics of the impact of using farm loan on living
standard with respect to Farm Size
Farm Size (In canal) % Of
Possessions Total
1-400 401-800 801-above 1-400
More land 116 12 42 170 68.23529
TV 120 24 36 180 66.66667
Telephone 138 24 36 198 69.69697
Motor cycle 130 20 32 182 71.42857
Car 186 30 52 268 69.40299
New house 164 36 54 254 64.56693
Send child to govt schools 96 34 28 158 60.75949
Send child to private schools 142 28 44 214 66.35514
Seeing doctor in cities 128 34 26 188 68.08511
Eating in restaurants 173 38 46 257 67.31518
Keeping livestock for business 180 46 50 276 65.21739
House renovation 104 24 24 152 68.42105
Member in an organization 164 24 50 238 68.90756
Visit other cities 154 34 36 224 68.75
Source: - Field survey
Out of 276 respondents who enhanced their livestock 180 respondents were those farmers who had small
farmlands. Out of 257 respondents who had better food opportunities than before use of credit for crop
productivity 173 respondents were those farmers who had small farmlands. Out of 238 respondents who
were members in organizations after use of credit for crop productivity 164 respondents belonged to those
farmers who had small farmlands. Out of 224 respondents who visited other cities for entertainment after
using credit for crop productivity 154 respondents belonged to those farmers who had small farmlands. Out
of 198 respondents who had better communication facilities than before use of credit for crop productivity
138 respondents belonged to those farmers who had small farmlands. Farm size had significant impact
(p=0.000) on living standard of farmers (table3). Farmers who had small farms used new farm technology
more than farmers who had farms of other sizes to enhance their agriculture products from small piece of
land.Hence generated more income to meet necessities of life and to change standard of living.
Numbers of times credit attained (in years)
Impact of participation in credit for agricultural productivity on living standard of the farmers was more on
those farmers who took credit for 1 to 2 times than those farmers who participated in credit from 3 times to
5 times and 6 times or above (table 8).
Table 8 Descriptive statistics of the Impact of using farm loan on living
standard with respect to period of credit taken by farmers
Possessions Period of Credit taken % 0f 1-2
Years
1-2 years 3-5 years 6-10 years Total
More land 78 86 6 170 45.88235
TV 108 72 0 180 60
Telephone 110 88 0 198 55.55556
Motor cycle 108 68 6 182 59.34066
Car 134 120 14 268 50
New house 128 114 12 254 50.3937
Send child to Govt schools 80 72 6 158 50.63291
Send child to private schools 100 108 6 214 46.72897
Page | 21
www.iiste.org
9. Journal of Economics and Sustainable Development www.iiste.org
ISSN 2222-1700 (Paper) ISSN 2222-2855 (Online)
Vol.2, No.8, 2011
Seeing doctor in cities 114 66 8 188 60.6383
Eating in restaurants 142 101 14 257 55.25292
Keeping livestock for business 124 132 20 276 44.92754
House renovation 86 58 8 152 56.57895
Member in an organization 112 120 6 238 47.05882
Visit other cities 130 86 8 224 58.03571
Source: - Field survey
The indicators, which were given more attention for improvement in living standard among others, were
foods, health, education for children, conveyance, visiting other cities, housing, Livestock for business and
becoming members in organizations etc. Out of 188 respondents who had access to better health facilities
than before use of credit for crop productivity 114 (60.63%) respondents were those farmers who obtained
credit for one or two times (in years). Out of 180 respondents who had television facility after use of credit
for crop productivity in order to get information of about and to entertain themselves 108 (60%) were those
respondents who obtained credit one or two times. Out of 198 respondents who had telephone facility than
before using credit for crop productivity 110 respondents were those farmers who obtained credit for one
time or two times. One hundred and eight respondents (59.34%) out of 182 respondents who had
motorcycle (personal conveyance) facility than before using credit for crop productivity were those farmers
who obtained credit for one time or two times. Out of 224 respondents who could visit other cities for
enjoyment after using farm credit 130 (58%) respondents belonged to those farmers who obtained credit
one time or two times. Credit taken period affected living standard significantly (p=0.000, table3). Mostly
farmers were not willing to take credit more than 5 times because of risk bearing. Hence farmers who took
credit for few times tried their best for the right use of credit to enhance their agriculture and got more
profit. Hence became able to improve their livings.
It can be seen from table 9 that education, family size and farm size were positively correlated with well
being,
Table 9 Correlation between Dependent and independent variables
Independent variables
Dependent
Variable Farm
Age Family Agricultural Farming
Education Size NTCA
(years) Size information experience
(acres)
Living -0.176 -0.003
Standard -0.122 0.133 0.043 0.031 -0.032
Sig. (2- 0.002 0.952
tailed) 0.030 0.017 0.444 0.576 0.572
While age, farming experience, visiting agriculture information centre and numbers of times credit attained
were negatively correlated. It means younger, more educated big farmers who participated in credit and
visited agriculture information centre few times changed their living standard. Education had positively
significant impact and visiting agriculture information centre for getting help how to apply new farm
technology had negatively significant impact on wellbeing of farmers (table 10).
Table 10 Regression impacts of different independent variables on
dependent variable well being
Adjusted
Model R R Square F Sig.
R Square
1 .242 .058 .037 2.768 .008
Independent variables
Unstandardized Coefficients Standardizd t Sig.
Page | 22
www.iiste.org
10. Journal of Economics and Sustainable Development www.iiste.org
ISSN 2222-1700 (Paper) ISSN 2222-2855 (Online)
Vol.2, No.8, 2011
Coefficients
B Std. Error Beta
(Constant) 3.304 .559 5.913 .000
Age (years) -.013 .012 -.096 -1.128 .260
Education .038 .021 .131 1.809 .071
Family size -.006 .028 -.013 -.218 .828
Farm Size (acres) 2.230E-5 .000 .024 .440 .660
Numbers of times credit
-.021 .046 -.028 -.464 .643
attained
Farming experience .007 .011 .055 .656 .512
Agricultural
-.071 .024 -.175 -3.011 .003
information
It means that highly educated farmers got more benefits of using farm credit. They visited agriculture
information centre to know better use of new farm technology only few times because centre was not easily
accessible. The F-statistics shows that the explanatory variables included in the model collectively had
significant impact on well being. The R2 and Adjusted-R2 values suggest that below 5 percent variations in
the well being were explained by the explanatory variables included in the model. The analysis revealed
findings that rejected null hypothesis and confirmed that credit is very important for agricultural
productivity.
Conclusion
From the findings of present survey it is concluded that different determinants used in the model were
collectively important in explaining impact on well being. But education and demonstrative effect is more
significant. However R2 = 0.058 and adjusted R2 = 0.037 values were not distinctive in explaining impact.
More educated younger farmers with either family and farm size and farming experience are provided
credit as they were more adoptive. Extension services be easily accessible for them so that they may take
full advantage of obtaining credit through application of this credit in adoption of new farm technology and
to raise their income and hence their living standard.
References
Abedullah.N.,Mahmood.M.,Khalid.1 and Kouser.s (2009). “The role of agricultural credit in the growth of
livestock sector: a case study of Faisalabad Pakistan,” Vet. J, 29(2): Pp 81-84
Ater.P.I.,Agbo.C.I.,Barau.A.D(1991). “Loan delinquency in the Benue State small – scale Agricultural On–
lending credit scheme: A case study.” Niger. J. Rural Econ. Soc. 1(1): Pp70 – 76
Barslund.M and Tarp.F( 2007). “Formal and informal rural credit in four provinces of Vietnam.”
Discussion Papers, Department of Economics, University of Copenhagen
Cleary.P.D and Angel.R (1984). “The analysis of relationship involving dichotomous dependent variable.”
Journal of Health and Social Behaviour.25 Pp334 – 348 Cliffs, New Jersey
Coleman.B.E(2002). “Microfinance in Northeast Thailand: Who benefits and How much?” Asian
Development Bank -Economics and Research Department Working Paper 9
Page | 23
www.iiste.org
11. Journal of Economics and Sustainable Development www.iiste.org
ISSN 2222-1700 (Paper) ISSN 2222-2855 (Online)
Vol.2, No.8, 2011
Diagne.A and Zeller.M (2001). “Access to credit and its impact on welfare in Malawi” International Food
Policy Research Institute, Washington D.C. Research Report 116
Diagne.A.,Zeller.M and Sharma.M(2000). “Empirical measurements of households' access to credit and
credit constraints in developing countries.” Methodological issues and evidence, FCND discussion paper
no. 90, Food Consumption and Nutrition Division ,International Food Policy Research Institute 2033
Duong.P and Izumida.Y(2002). “Rural development finance in Vietnam:A micro econometric analysis of
household surveys.” World Development 30, no 2: 319-35
Faturoti.B.O.,Emah.G.N.,Isife.B.I.,Tenkouano.A.I and Lemchi.J(2006). “Prospects and determinants of
adoption of IITA plantain and banana based technologies in three Niger Delta States of Nigeria.” African
Journal of Biotechnology Vol. 5 (14), Pp. 1319-1323
Fredrick.F and Bokosi.K(2004). “Determinants and characteristics of household demand for smallholder
credit in Malawi” http//econ papers.repc.org/scripts
Government of Pakistan (2008). Economic Survey of Pakistan. Ministry of Finance, Economic Advisor’s
Wing, Islamabad, Pakistan.
Gulli.H(1998). “Microfinance and Poverty: Questioning the Conventional Wisdom.” Washington, DC,
Inter-American Development Bank
Kavanamur.D(1994). “Credit information and small enterprises.” Political and Administrative Studies
Department, University of Papua New Guinea
Khandker.S.R(1998). “Fighting poverty with micro credit: Experience in Bangladesh.” New York, Oxford
University Press, Inc
Khandker.S.R(2001). “Does micro-finance really benefit the poor?” Evidence from Bangladesh, Asia and
Pacific forum on poverty: Reforming Policies and Institutions for Poverty Reduction, Asian Development
Bank, Manila, Philipinnes
Khandker.S.R.(2003). “Microfinance and Poverty: Evidence Using Panel Data from Bangladesh.” World
Bank Policy Research Working Paper 2945. Washington D.C.: World Bank
Khandker.S.R and Faruque.R.R(2001). “The impact of farm credit in Pakistan.” Rural Development,
Development Research Group, World Bank Paper
Kizilaslan.H and Adiguzel.O(2007). “Factors affecting credit use in agricultural business concerns in
Turkey.” Research Journal of Agriculture and Biological Sciences, 3(5): Pp 409-417
Kudi.T.M.,OdugboS.B.,Banta.A.L and Hassan.M.B(2009). “ Impact of UNDP microfinance programme on
poverty alleviation among farmers in selected local government areas of Kaduna State, Nigeria
International Journal of Sociology and Anthropology Vol. 1(6) Pp 99-103
Morduch.J(1995). “Income smoothing and consumption smoothing", Journal of Economic Perspectives
9(3): Pp103-14
Nunung.N.,Zeller.M and Schwarze.S(2005).“Credit rationing of farm households and agricultural
production.” Empirical evidence in the rural areas of central Sulawesi, Indonesia Tropentag Stuttgart-
Hohenheim, Conference on International Agricultural Research for Development
Page | 24
www.iiste.org