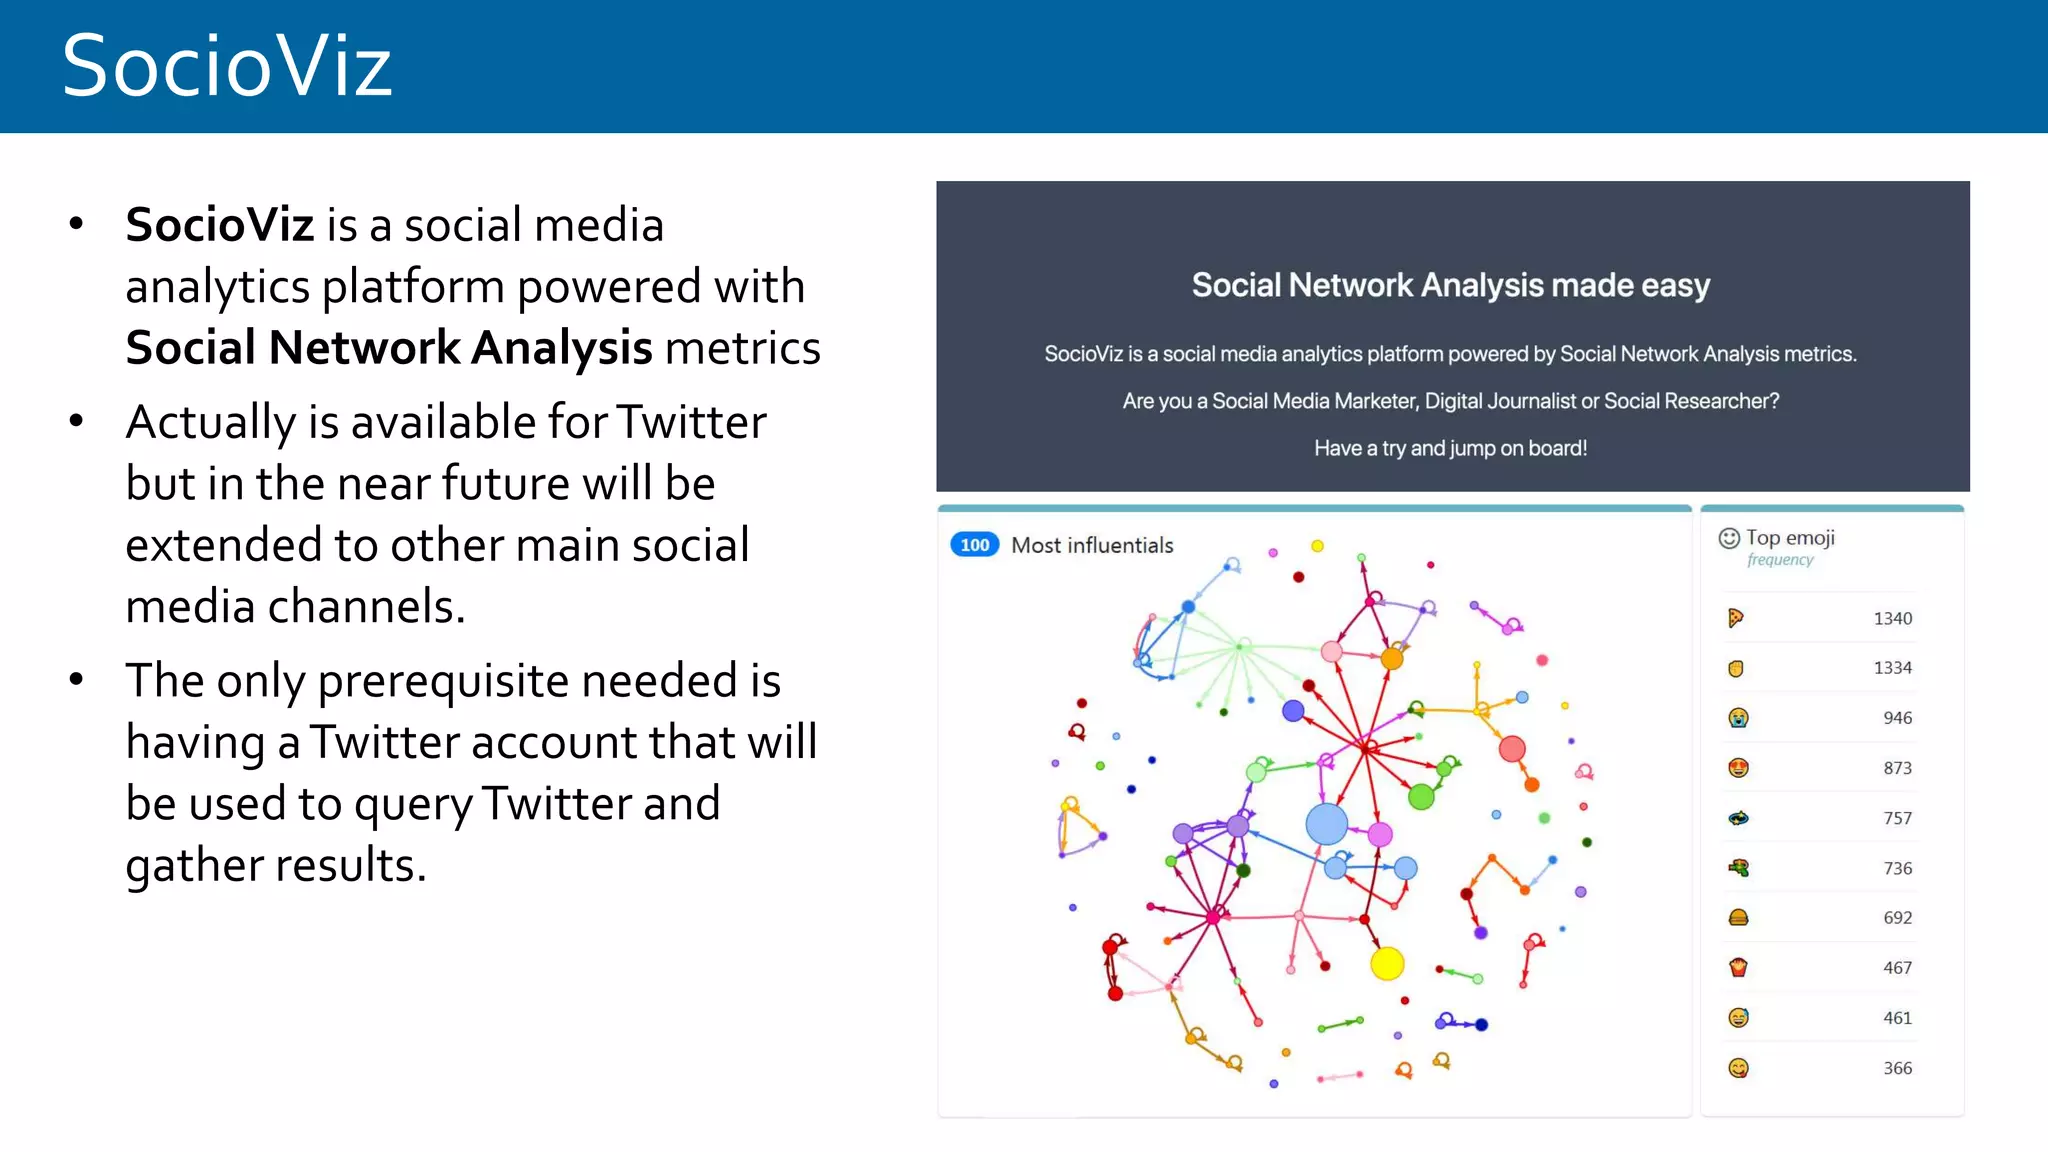
SocioViz.
Social Network Analysis made easy
www.socioviz.net
SocioViz
• SocioViz is a social media
analytics platform powered with
Social Network Analysis metrics
• Actually is available forTwitter
but in the near future will be
extended to other main social
media channels.
• The only prerequisite needed is
having aTwitter account that will
be used to queryTwitter and
gather results.
SocioViz at a glance
There two type of searches:
historical and recurring.
Historical searches (in blue) allows
you to search 1 week in the past
with a maximum of 50.000 tweets
for each query. Recurring searches
(in green) collect tweets in “real-
time” (new tweets are periodically
collected and stored in groups of
100) with a maximum of 50.000
tweets per query.
Recurring searches aren’t available
for free plans and number of
tweets extracted also depends to
subscribed plan.
SocioViz: query syntax
SocioViz: filters
Date range Language
SocioViz: actionable buttons
Upper corners of your
queries contains actionable
buttons
REPORT: go to the detailed search report
PAUSE or STOP: for recurring searches
SCHEDULE: transform an historical search in
a recurring search
DELETE: cancel the query
DOWNLOAD: download a zip file with all
reports up-to-date
upper right corner
Keywords to search
Date range
Result type
Language
Location (not active)
upper left corner
SocioViz: timeline and top hashtags
The stacked area chart represents the volume of post (tweets and retweets) sent.The table represents the top-10 of
most utilized hashtags, sorted by frequency. Hashtags are normalized in lower-case.
SocioViz: tweets detail
The detail of tweets is available scrolling the page or could be downloaded in XLS and CSV format
SocioViz: user statistics
Most active users (tweets sent) in terms and most influential users (number of
mentions/retweets received) are displayed in two tables.
SocioViz: words and emoji
Most used words and emoji are showed in two tables. From a semantic point of view
some words have no informational value and are removed.
SocioViz: words network
Each word is represented with a circle and is connected to another word when there is a co-presence in the same
tweet; different colors represent different cluster of arguments that frequently goes together.
SocioViz: users network
Each user is represented with a circle and is connected to another user when there are interactions between them
(RT or mentions).The nodes size are proportional to the number of RT and mention received, so is a good
indicator of the influence of a particular person in a network of conversations.
SocioViz: emoji network
Each emoji is represented with a circle and is connected to another emoji when there is a co-presence in the same
tweet; different colors represent different cluster of arguments that frequently goes together.
SocioViz: words network
Each hashtag is represented with a circle and is connected to another hashtag when there is a co-presence in the
same tweet; different colors represent different cluster of arguments that frequently goes together.
SocioViz: layouts, parameters and filters
There are three types of
interactions within each
network visualization.
In the upper right corner
menu there are some
menu voices that allows
to export in various
format or filter number
and type of nodes to
visualize.
SocioViz: export and filters menu
Clicking on the upper right corner is possible to access to the
export and filters menu.
PNG (Portable Network Graphics) is a raster graphics file format
that supports lossless data compression.
GML (Graph Modeling Language) is a text file format supporting
network data with a very easy syntax. It is used by Graphlet,
Pajek, yEd, LEDA and NetworkX.
GEXF (Graph Exchange XML Format) started in 2007 at Gephi
project is a language for describing complex networks
structures, their associated data and dynamics.
SocioViz: export and filters menu
Users network: you could filter and focus on Most recents, Most
influentials (in terms of retweets and mentions received) or
most active (in terms of number of tweet sent).
Hashtags network: you could filter and focus on Most recents
hashtags orTop hashtags (in terms of hashtag frequency).
Words network: you could filter and focus on Most recents
words orTop words (in terms of word frequency).
Emoji network: you could filter and focus on Most recents emoji
orTop emoji (in terms of emoji frequency).
SocioViz: export and filters menu
Once the type of visualization is choosen (most recents, most
influentials, most active…) is possible to select the number of
nodes to visualize in two ways:
• clicking on the blue modal on the upper left corner or
• expand the options menù on the bottom (gear icon).
Clicking on the modal the number of visualized nodes
increment by 100 each click.
SocioViz: networks option menu
Clicking on the gear icon the Layout and filter configuration menu appears..
Layout: A network topology is the arrangement of a network, including its nodes and connecting lines.
Using diffent layouts you could emphasize network topology by divisions, complementarity or ranking.
Avoid Overlap: avoid nodes overlapping.
www.socioviz.net
@socioviznet
Have a try and jump on board!

SocioViz : Social Network Analysis made easy

  • 1.
    SocioViz. Social Network Analysismade easy www.socioviz.net
  • 2.
    SocioViz • SocioViz isa social media analytics platform powered with Social Network Analysis metrics • Actually is available forTwitter but in the near future will be extended to other main social media channels. • The only prerequisite needed is having aTwitter account that will be used to queryTwitter and gather results.
  • 3.
    SocioViz at aglance There two type of searches: historical and recurring. Historical searches (in blue) allows you to search 1 week in the past with a maximum of 50.000 tweets for each query. Recurring searches (in green) collect tweets in “real- time” (new tweets are periodically collected and stored in groups of 100) with a maximum of 50.000 tweets per query. Recurring searches aren’t available for free plans and number of tweets extracted also depends to subscribed plan.
  • 4.
  • 5.
  • 6.
    SocioViz: actionable buttons Uppercorners of your queries contains actionable buttons REPORT: go to the detailed search report PAUSE or STOP: for recurring searches SCHEDULE: transform an historical search in a recurring search DELETE: cancel the query DOWNLOAD: download a zip file with all reports up-to-date upper right corner Keywords to search Date range Result type Language Location (not active) upper left corner
  • 7.
    SocioViz: timeline andtop hashtags The stacked area chart represents the volume of post (tweets and retweets) sent.The table represents the top-10 of most utilized hashtags, sorted by frequency. Hashtags are normalized in lower-case.
  • 8.
    SocioViz: tweets detail Thedetail of tweets is available scrolling the page or could be downloaded in XLS and CSV format
  • 9.
    SocioViz: user statistics Mostactive users (tweets sent) in terms and most influential users (number of mentions/retweets received) are displayed in two tables.
  • 10.
    SocioViz: words andemoji Most used words and emoji are showed in two tables. From a semantic point of view some words have no informational value and are removed.
  • 11.
    SocioViz: words network Eachword is represented with a circle and is connected to another word when there is a co-presence in the same tweet; different colors represent different cluster of arguments that frequently goes together.
  • 12.
    SocioViz: users network Eachuser is represented with a circle and is connected to another user when there are interactions between them (RT or mentions).The nodes size are proportional to the number of RT and mention received, so is a good indicator of the influence of a particular person in a network of conversations.
  • 13.
    SocioViz: emoji network Eachemoji is represented with a circle and is connected to another emoji when there is a co-presence in the same tweet; different colors represent different cluster of arguments that frequently goes together.
  • 14.
    SocioViz: words network Eachhashtag is represented with a circle and is connected to another hashtag when there is a co-presence in the same tweet; different colors represent different cluster of arguments that frequently goes together.
  • 15.
    SocioViz: layouts, parametersand filters There are three types of interactions within each network visualization. In the upper right corner menu there are some menu voices that allows to export in various format or filter number and type of nodes to visualize.
  • 16.
    SocioViz: export andfilters menu Clicking on the upper right corner is possible to access to the export and filters menu. PNG (Portable Network Graphics) is a raster graphics file format that supports lossless data compression. GML (Graph Modeling Language) is a text file format supporting network data with a very easy syntax. It is used by Graphlet, Pajek, yEd, LEDA and NetworkX. GEXF (Graph Exchange XML Format) started in 2007 at Gephi project is a language for describing complex networks structures, their associated data and dynamics.
  • 17.
    SocioViz: export andfilters menu Users network: you could filter and focus on Most recents, Most influentials (in terms of retweets and mentions received) or most active (in terms of number of tweet sent). Hashtags network: you could filter and focus on Most recents hashtags orTop hashtags (in terms of hashtag frequency). Words network: you could filter and focus on Most recents words orTop words (in terms of word frequency). Emoji network: you could filter and focus on Most recents emoji orTop emoji (in terms of emoji frequency).
  • 18.
    SocioViz: export andfilters menu Once the type of visualization is choosen (most recents, most influentials, most active…) is possible to select the number of nodes to visualize in two ways: • clicking on the blue modal on the upper left corner or • expand the options menù on the bottom (gear icon). Clicking on the modal the number of visualized nodes increment by 100 each click.
  • 19.
    SocioViz: networks optionmenu Clicking on the gear icon the Layout and filter configuration menu appears.. Layout: A network topology is the arrangement of a network, including its nodes and connecting lines. Using diffent layouts you could emphasize network topology by divisions, complementarity or ranking. Avoid Overlap: avoid nodes overlapping.
  • 20.

Editor's Notes

  • #2 1
  • #3 SocioViz.net is a Twitter analytics platform powered by Social Network Analysis metrics. With SocioViz you could query Twitter conversations, produce network graphs (user interaction and hashtag co-presence) and export to Gephi gexf format. Login with Twitter and scrape the social web Analyze any topic, term or hashtag Identify key influencers, opinions and contents Export data to your favorites Social Network Analysis tool
  • #4 In the Query field you could search for a single or multiple word/hashtag and adding some operators.
  • #5 In the Query field you could search for a single or multiple word/hashtag and adding some operators.
  • #6 By default, specifying any other value, the last 100 tweets are extracted; clicking on From and To fields is possible to search 1 week in the past with a maximum of 5.000 tweets for each query. language field accept any ISO 639-1 code?
  • #8 Distribution of tweets in the selected time-frame and the top hashtags used
  • #9 Each row in the table represent a tweet. The table of tweets is downloadable in XLS format clicking on the upper right arrow icon 
  • #10 Distribution of tweets in the selected time-frame and the top hashtags used