1. Do High School Students Favor Online or In-Person Instruction?
1. Introduction
The novel coronavirus has caused schools of all educational levels across the country
multiple issues regarding methods of providing education, grading, and more. With in-person
instruction being rendered impossible and unrealistic as an option for teaching, many schools
have switched to online instruction. At first, most students seemed ecstatic at the thought of not
having to wake up early anymore, but as time has passed, the few synchronous classes provided
at my high school proved tough to handle. In this study, I will be trying to compare the
preference between online and in-person learning of students at my high school and also examine
the association between the preference of online learning and the current grade level of said
students. I suspect that less high school students will prefer online instruction as opposed to in-
person instruction due to a reduced level of human interaction with learning online. I also suspect
that there is an association between preference of online person instruction and grade level.
Specifically, I think that juniors and seniors will prefer online learning more, as online learning
has made their final years before college applications less stressful.
2. Statistical Questions
The two statistical questions I am investigating are:
Q1: In general, do high school students at my high school prefer the new online instruction less
than the traditional in-person instruction?
Q2: Is there an association between the preference of online learning and the current grade level
of students?
2. 3. Sampling Procedure and Data Display
The best way of obtaining a sample is to obtain a random sample. However, my school
does not provide a list of student’s emails, making it impossible to select a sample. In addition, I
could not conduct an in-person survey on campus using systematic sampling, which could be
treated as a random sample under certain conditions, due to the government’s quarantine
guidelines. The best alternative was to conduct an online survey. With my two questions in mind,
it was necessary to be able to include members from all grade levels in my sample. Using our
school’s virtual learning platform, Schoology, I sent a google form survey with my questions so
that all members of the Upper School could see.
Figure 1: Survey Questions
All students who came across the survey viewed the same two questions. No statistics or
facts regarding the advantages or disadvantages of online or in-person instruction were included
in the questions so as to not induce any bias; students were simply asked to compare their
experiences from both methods of learning and choose which method they preferred and indicate
the level of preference. After 3 days from the initial release date of the survey, I did not count
3. any more responses. In the end, a total of 126 respondents across all grade levels replied to the
survey out of the population of roughly 500 high school students.
For my analysis, I decided to combine the number of people who strongly preferred
online instruction and the number of people who preferred online instruction into one category
named: “# of people who preferred online instruction overall.” It should be noted that there were
no students who filled out the choice “others,” therefore, this grouping is allowed. I also
combined the number of people who strongly preferred in-person instruction and the number of
people who preferred in-person instruction into one category named: “# of people who preferred
in-person instruction overall.” The reasoning behind including the different levels of preference
was for students who were leaning only slightly in favor of one of the two methods of instruction
to have an easier time selecting the option that best fit their preference. Then, the act of
combining the number of people who had a general preference towards one of the methods of
instruction allowed for me to answer the desired statistical question at hand. The raw data is
summarized in the table below, followed by a graphical representation of the data.
Raw Data
Grade Level # of people who prefer
online instruction overall
# of people who prefer in-
person instruction overall
TOTAL
Freshman 6 13 19
Sophomore 18 40 58
Junior 8 17 25
Senior 10 14 24
TOTAL 42 84 126
Table 1: Two-way contingency-table (observed counts)
4. Data Display
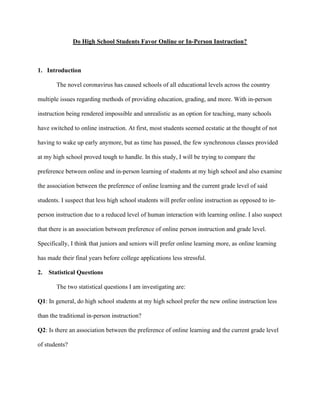
Figure 2: Percentage Distribution of Responses to “What Grade Are You In?”
Figure 3: Segmented bar graph depicting the number of people who preferred online and in-
person instruction by grade
A concern from this sampling method might be that it might not be a random sample.
However, a deeper investigation of the data shows that this is close to a random sample. Non-
randomness comes mainly from selection bias and nonresponse bias. Firstly, there is no selection
5. bias since all high schoolers had access to the survey. Secondly, from Table 1 and figure 2, we
can see that sophomores accounted for nearly half of the responses while only taking up a quarter
of the population. I presume that since I am a sophomore, my sophomore peers responded more
actively than others. Therefore, nonresponse mainly arose from the other three grades. If the
response pattern in sophomores is no different than the response pattern in the other grades, then
nonresponse bias can be safely neglected. To test the significance of the nonresponse bias, I
conducted a test to see if the true proportion of sophomores who preferred online learning and
the true proportion of all the other grades who preferred online learning was the same, with
hypotheses:
𝐻 : 𝑝 = 𝑝
𝐻 : 𝑝 ≠ 𝑝
Where 𝑝 represents the true proportion of sophomores who preferred online learning and
𝑝 represents the true proportion of all the other grades who preferred online learning.
The significance level is 𝛼 = 0.05.
I conducted a two-sample z-test for proportions. In terms of conditions, for the sample of
sophomores, there were 58 × = 18 successes and 58 − 18 = 40 failures. For the other
sample, there were 68 × = 24 successes and 68 − 24 = 44 failures. Due to both samples
having more than 15 successes and failures, the large count condition is met. The resulting test
statistic is:
𝑍 =
𝑝̂ − 𝑝̂
𝑝̂𝑞(
1
𝑛
+
1
𝑛
)
=
18
58
−
24
68
42
126
×
84
126
× (
1
58
+
1
68
)
= −0.5055
With p-value, p = 2(P (Z < -0.5055)) = 0.6132.
6. Since the p-value of 0.6132 is greater than 𝛼 = 0.05, we fail to reject the null hypothesis,
meaning that there is lack of evidence to suggest that the true proportion of sophomores who
prefer online learning is different from the true proportion of all the other grades combined who
prefer online learning. Therefore, there is minimal nonresponse bias, because the response
patterns of the underrepresented non-sophomores are similar to that of the sophomores, who are
the overrepresented ones; the sample I ended up with can be safely treated as a random sample.
4. Data Analysis
To answer the first question, a one-sample z-test will be conducted. Recalling my
predictions, I suspect that less high school students at my high school truly prefer online
instruction as opposed to in-person instruction. The null and alternative hypotheses are stated as
𝐻 : 𝑝 = 0.5
𝐻 : 𝑝 < 0.5
Where 𝑝 represents the true proportion of high school students at my high school who prefer
online instruction. The significance level is 𝛼 = 0.05.
If both the conditions below are met, we may proceed with a test of inference.
Conditions:
(1) The sample was randomly selected. See discussion in section 3.
(2) 𝒏𝒑 ≥ 𝟏𝟓, 𝒏(𝟏 − 𝒑) ≥ 𝟏𝟓, where n represents the sample size and 𝑝̂ represents the
proportion of students within the sample who preferred online instruction. It is necessary to
satisfy this condition as it allows us to assume the sampling distribution of 𝑝̂ be approximately
normal, allowing us to calculate a p-value. After calculation, we have 126 × = 42 successes,
and 126 × 1 − = 84 failures, both of which are above 15. Therefore, this condition is
satisfied.
7. Test Statistic:
𝑍 =
𝑝̂ − 𝑝
𝑝 𝑞 /𝑛
=
42
126
− 0.5
0.5 × 0.5/126
= −3.7417
p-value:
𝑝 = 𝑃(𝑍 < −3.7417) = 0.00009
Moving forward to the second question to examination of the association of preference
between the two methods of instruction, a chi-square test of independence with the following
hypotheses:
𝐻 : There is no association between preference of online instruction and grade level
𝐻 : There is an association between preference of online instruction and grade level
The significance level is set to be 0.05.
Conditions
(1) The sample was randomly selected. See discussion in section 3.
(2) Large Counts Condition. This is satisfied, as the expected counts are all greater all
than 5. All expected counts were rounded to two decimal places as summarized in the following
table.
Grade Level # of people who prefer
online instruction overall
# of people who prefer in-
person instruction overall
TOTAL
Freshman 6.33 12.67 19
Sophomore 19.33 38.67 58
Junior 8.33 16.67 25
Senior 8 16 24
TOTAL 42 84 126
Table 2: Expected Counts in the contingency table
8. Using both the values for the expected counts as well as the observed counts table from
before, a test statistic can be calculated.
Chi-Square Test Statistic
𝜒 =
(𝑜𝑏𝑠 − 𝑒𝑥𝑝)
𝑒𝑥𝑝
𝜒 =
(6 − 6.33)
6.33
+
(18 − 19.33)
19.33
+
(8 − 8.33)
8.33
+
(10 − 8)
8
+
(13 − 12.67)
12.67
+
(40 − 38.67)
38.67
+
(17 − 16.67)
16.67
+
(14 − 16)
16
= 0.9342
Degrees of Freedom: (4 − 1) × (2 − 1) = 3
p-value:
𝑝 = 𝑃 𝜒 > 0.9342 = 0.8172
5. Conclusion
The p-value for the first test of inference was p = 0.00009; since p = 0.00009 < 0.05, we
reject the null hypothesis. Therefore, there is convincing evidence that the true proportion of high
school students at my high school who prefer online instruction is less than 0.5, meaning that in
general, high school students at my high school prefer in-person instruction compared to online
instruction.
Furthermore, for our second test of association regarding the association between
preference of online instruction and grade level, the p-value given from the chi-square statistic
was p = 0.8172; since p = 0.8172 > 0.05, we fail to reject the null hypothesis. Therefore, there is
lack of convincing evidence that suggests that there is an association between preference of
online instruction and grade level, meaning that there is in fact no association at all between
preference of online instruction and grade level.
9. 6. Reflection
I felt that overall, the experiment process went well, as I had a relatively good idea about
how to conduct tests and explain my thought process throughout the experiment. However, I do
recognize that my study is not perfect and that there are some flaws.
I believe that the sampling method that I chose was the thing that could have caused the
most statistical error. I used an online survey, which is technically not a random sampling
method, but as stated before, with the sampling frame not available and the idea of conducting
in-person surveys out of the window, this was essentially the next best method of sampling. As a
result, it is undeniable that there is some amount of voluntary response and nonresponse bias
since people who wanted to voice their opinions were overrepresented while people who do not
check Schoology were underrepresented. If possible, I would ask the administration if they had a
list of all the student’s emails. Then, a more statistically valid sampling method would be to
randomly select a stratified sample with 130 student’s emails from the list and email them the
survey questions; the stratified variable would be the grade level. To do this, I would first
determine the sample size 𝑛 of each grade (𝑖 = 1, 2, 3, 4 for freshmen, sophomores, juniors, and
seniors respectively) based on the grade’s proportion to the total population of high school
students. Continuing forward, I would randomly assign a unique random number from 1 to
however many students there are for each grade. From there, the sample will be filled up with
students who have numbers 1 to 𝑛 in each grade. The problem with this method is that people
might feel less inclined to reply to a personal email with it being not anonymous, especially if
they are unfamiliar with who I am. It was possible that if I had used this sampling method that I
would not have had enough people respond to be able to answer the questions I had in mind. In
10. other words, nonresponse bias still exists. Nonetheless, the stratified sampling method is clearly
the more statistically valid approach, even if the risk of not enough people responding is present.
The conclusion that high school students preferred in-person instruction aligned with my
prediction. I was not particularly surprised by this, as I was constantly surrounded by friends
who complained about the benefits that they had from being able to interact in-person with
teachers were gone. Based on this, I believe that my high school should improve their current
online learning program, because it is possible that the virus may return and force us to go
through online learning again. As for the second chi-square test, I was surprised that there was no
association between preference for online instruction and grade level. I was surprised because I
thought that upperclassmen would enjoy online learning more as this relieves the stress on their
hardest years before college applications. On the other hand, the lack of association between
online learning across all grade levels means that upperclassmen are still passionate about
learning in-person, in speaks a lot of our community. All in all, I was pleasantly satisfied with
the results of this study.