Respond to at least two colleagues by offering critiques of their .docx
Brian Espinoza - Academic Help-Seeking Behavior and the Effects of Socioeconomic Status
1. Brian Espinoza
Academic Help-Seeking at the College Level and the Effects of Socioeconomic Status
About the Study
The importance of a college-level education is not something easily measured. Though
such an education provides monetary assurance to college students after graduation, many of them
are still expected to pursue higher-learning, not only for the economic commodities it provides but
in the hopes that they one day become successful, self-sufficient, high-achieving members of
society. However, as passionate as their dreams may be, certain factors may affect a student’s
ability to make connections, learn certain group skills, and may even inhibit their academic
performance. In fact, certain behavioral responses to academic situations have been revealed to
have been learned as early as the elementary school stage. While observing the help-seeking
behaviors of elementary school children, Calarco has found that children of higher social class
tend to call out for attention more often their lower-class peers who would tend to raise their hands
quietly for several minutes until their teacher would finally notice them (Calarco 2011). These
types of behaviors occur at both extremes of the social class context but are distinct to their
respective class and are a result of a specific class culture. Consistent with Aries’ and Seider’s
analysis, these types of behaviors can, over time, develop into individual character traits. In the
case of lower-class students, many of them develop a very independent work ethic that values
individual hard work and perseverance (Aries and Seider 2005).
Though most of the literature is centered on children, grades K-12, I felt the need to expand
the observations to the collegiate level in order to identify the extent to which these class culture
have affected the help-seeking behavior of college level students. By focusing on college students,
2. the effects that their social status has had on them would be fully matured and developed into
concrete character traits.
Methodology
In order to obtain the data used in this study, a 24-question self-administered survey was
made available to a random sample of college students from across the U.S. It was created using
the Qualtrics survey system and distributed through Amazon’s MechanicalTurk platform which
allows the poster to set special permissions, restricting access to the survey to only those
respondents that meet a certain criteria. In order to keep the respondents within the study’s desired
population, permission was given only to those who were college students over the age of 18. Also,
because MechanicalTurk is a fee-for-service site, each respondent was paid a total of 10 cents for
completing the survey. A total of 54 (n=54) responses were collected from completed surveys and
even though n is greater than the 30 responses normally necessary to establish significance, the
relatively small amount of respondents made analyzing lower, middle, and upper-class differences
quite difficult. After the coding process was complete and respondents had been categorized by
social class, a total of 17 lower-class, 35 middle-class, and 2 upper-class respondents had been
identified. As a response to question 16, “Which class do you most closely identify with?” only
one respondent self-identified as upper-class but the coding method used revealed one more.
In order to best operationalize both socioeconomic status and likelihood of seeking
academic help, the respondents were asked several questions pertaining to each one. Because
socioeconomic status is such an encompassing term which accounts for both social and economic
capital, the survey questions asked a range of topics regarding the average household size growing
3. up, current household size, family’s current and childhood income, parental education level, and
also asked them to self-evaluate their current social class.
In an effort to code these results and obtain a quantifiable measurement, questions with
more than three responses were collapsed into three categories. For example, question 12 asked
“growing up, what was your average household size? (Including yourself)” and the seven
responses ranged from “1” to “7+”. After respondents’ data had been collected, the responses were
broken down based on which values would most likely lead to upper, middle, and lower-class
results. Respondents with smaller families were most likely to have a higher economic freedoms
than those with larger families and because of this, respondents that answered 1 to 3 were coded a
3, a household size of 4 was coded a 2, and anything above 5 was coded a 1. The same procedure
was used with every socioeconomic-related question, coding responses as either a 1 with
respondents identified as lower-class, 2 with middle-class and 3 with upper-class. After coding
every response, the values obtained from questions pertaining to socioeconomic status were
averaged in order to obtain a socioeconomic index that would best identify a respondent anywhere
on the 1 to 3 scale. The same procedure was later used to identify respondents that were either
“likely”, “neutral”, or “unlikely” to participate in academic help seeking behaviors. Questions
measuring the likelihood of participation created a likelihood index. Once a socioeconomic and
likelihood index had been obtained for every respondent, the two indexes were compared to each
other on a two-way table. The socioeconomic index became the dependent variable while the
likelihood index was observed as the independent variable.
Some of the strengths to using an index to classify respondents was that it allowed for a
consolidated and unbiased analysis of the socioeconomic situation and likelihood predisposition
of the respondent in either situation. Also, one of the positive aspects of having used an online
4. platform to distribute the survey was that it allowed for a rapid collection of data for a population
with a high geographic dispersion. However, despite the ability to reach a broader population
throughout the U.S., a weakness in this method is that respondents were still limited to those who
use the MechanicalTurk platform which means that the responses are most clearly a representation
of college students, over 18, who also use MechanicalTurk to complete surveys rather than simply
college students over 18.
The survey also asked standard demographics questions and also asked respondents control
questions pertaining to working hours, employment, financial independence and shyness. Because
these factors may also shape their ability, and thus, their likelihood of seeking academic help, they
were all considered in the final tabulation. However, having only collected a total of 54 responses,
the controls reduced our counts and response rates across social class down to numbers where
extrapolation of significance was impossible.
Findings
The originating bivariate hypothesis guiding this study was that with increased social class
one would see an increasing likelihood of help-seeking behavior. Social class, being both a
subjective and objective term, was measured using an indexing technique that scored several
factors based on the particular effect a certain range would have on socioeconomic outcomes. This
method operationalized current and past family sizes, current and past income levels, social class
identification, and parental education levels.
The factors of socioeconomic status that were operationalized were in an effort to obtain
the clearest and most calculating analysis of the participants’ social class. Concluding this survey
is a copy of the survey given to the respondents. Questions 12 to 18 were used in the
5. operationalization of socioeconomic status and were also considered in the socioeconomic index
concluded based on the methodology explained in the previous section. Furthermore, the reason
for considering these specific factors conjunctively was that they oftentimes work in conjunction
with one another. Household size can affect the accommodations that income can provide the
family while parental education levels can be an indicator of how much academic advice parents
are able to provide their children.
The factors regarding the likelihood of seeking academic help were measured by
accounting for several factors also. By asking the respondents to evaluate their perceived level of
academic help-seeking interactions, I hoped to shift their likelihood index in a direction that
represents their personally held beliefs about seeking help. But also, in order to get a less
prejudiced and more specific response, the subsequent questions also used a Likert scale to
evaluate the respondents’ likelihood of seeking academic help through the means of “email[ing] a
professor or teaching assistant”, “attend[ing] office hours”, “stay[ing] after class to speak to a
professor or teaching assistant”,”acquir[ing] a tutor or enroll[ing] in an equivalent tutoring
program”, or “talk[ing] to an academic counselor”. The Likert responses were eventually collapsed
to “likely”, “neutral”, and “unlikely” categories and were coded as such before making their way
to a two-way table for analysis.
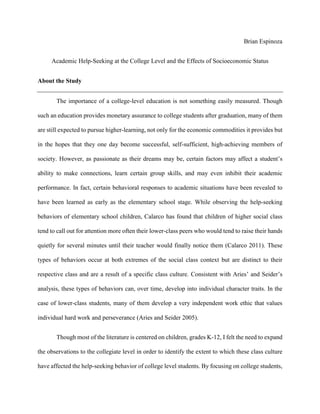
The following table and bar-graph show the results acquired after considering both
variables. The graph shows the extreme underrepresentation of the upper class in our data. This
may be partly be attributed to the social class of the population exposed to this survey through the
MechanicalTurk platform. The incentive for taking this survey was 10 cents and though there are
tasks that pay upwards of $10, it may be unlikely that it would sufficient incentive for upper-class
college students to go through the registration process and spend their time taking surveys.
6. If the focus on the upper-class were removed and the analysis relied solely on the trend
created as class status increases, a noteworthy difference between lower class and middle class
were be highlighted. By considering only the respondents that were determined by the likelihood
index to fall under the “likely” category, a difference of 9.75% is detected between middle and
lower class only. One can make predictions about the possible outcomes of the upper class group
however, it would be impossible to establish any certain conclusions without first obtaining more
respondents.
Exclusively using this 9.75% difference to evaluate the hypothesis would be extremely
naïve and almost foolish. That statistic simply reveals that among this particular group of
Lower Class Middle Class Upper Class
Likely 10 24 2
Neutral 7 10
Unlikely 1
10
24
2
7
10
1
0
5
10
15
20
25
30
LikelihoodCount Help-Seeking Likelihoods and Class Status
Likely
Neutral
Unlikely
7. respondents, those college students who were classified as middle-class were more likely to engage
in academic-help seeking behavior than those classified as lower-class. Taking a look at the data
table once more, we see that certain criteria did not even have one respondent. Additionally, even
attempting to use a Chi-Square test with degrees of freedom 4 (df = 4), would prove impossible
given that we must have an expected count of one or more for every observation and no more than
20% of the expected counts should be less than 5. Simply because there is a 2-point correlation
between lower class likelihood and upper class likelihood would not signify causality and
concluding anything else from this data would simply be a disservice to the efforts of this study.
As mentioned earlier, this study originally controlled for shyness. Using a Likert scale,
respondents were asked to self-identify with a shyness level from 0 to 10 where 0 was “not shy at
all” and 10 was “extremely shy”. After applying this control, the sample size was reduced to 23
(n = 23). The likelihood count that a lower-class college student in our sample who was also not
shy would seek academic help was 5 and middle-class was 10. By adding the control, upper-class
respondents were unaccounted for altogether. However, it would still may be of interest to note
that among our very small sample, Middle-class students were 33.33% more likely to seek help
than lower-class students.
Concluding Thoughts
Overall, I believe this study to have been a successful first look into the effects that social
class culture may have on academic help-seeking behavior. Aside from one non-exclusivity error
found in survey questions 14 and 15 that may have slightly affected the results, the overarching
reach of this study may serve to provide an inaugural scope into this field. Given that most of the
literature in this field look at the K-12 experience of children with respect to their social class, the
8. effects of those experiences after having moved on to higher-level learning institutions had not
been analyzed to this extent.
In effect, social class context can have a tremendous impact on a student’s ability to
overcome obstacles past the not-so-simple task of paying for college itself. Having a high
socioeconomic status not only means having high income but having stability, an educated pool
of resources found intrinsically within your social context, and having access to not only the
resources offered to mainstream America but having the opportunity to interact with the upper
echelons of society as well. The upbringing and surrounding behaviors one is exposed to
throughout childhood is extraordinarily linked to one’s academic success but that is not to say that
only those of higher social class are successful. In fact, people have been shown to develop
personal behaviors and attitudes towards academia that incorporate identifying factors from their
social class. Furthermore, this study does not intend to portray success as being measured only at
the collegiate level; people can learn the skills necessary to become successful without going to
college and that would make an excellent co-study to the one observed in this study. However, in
order to analyze that group, we would have to first find a population of “successful” people that
never went to college and try to extrapolate any correlation between their personalities and the
tenets of their class culture.
One other consideration for the data collected in this study is that the survey itself was
conducted between the hours of 7PM and 2AM on a Friday night which means that the responses
may not reflect college students that have to work jobs at night or even middle-aged parents that
work during the day and go to class at night. In order to have increased the effectiveness of this
study, it would have been advisable to publish this survey on different days and at different times
in order to collect various samples of the college student population. However, due to budgeting
9. restrictions, this could not be done. Furthermore, it is because of these limitations and surveying
methods that it would be incorrect to assume generalizability in this study. Nevertheless, the door
for this social study is now open and eagerly awaits further expansion, examination, and research.
10. Works Cited
Aries, Elizabeth and Maynard Seider. 2005. “The Interactive Relationship Between Class
Identity and the College Experience: The Case of Lower Income Students.” Qualitative
Sociology 28(4):419–43. Retrieved April 29, 2015
(http://link.springer.com/10.1007/s11133-005-8366-1).
Calarco, J. M. 2011. “‘I Need Help!’ Social Class and Children’s Help-Seeking in Elementary
School.” American Sociological Review 76(6):862–82. Retrieved May 14, 2015
(http://asr.sagepub.com/content/76/6/862.short).
11. Help-Seeking Behavioral Study – Survey Questions
Q1 Requirements: Must be a current college or university student. Must be 18 years or older If you
do not meet either or both of those requirements, exit now; you will not be given credit for completing
this survey.
Q2 Anonymity Statement We want to assure you that your responses are completely anonymous.
Responses to anonymous surveys cannot be traced back to the respondent. No personally identifiable
information is captured. Additionally, your responses are combined with those of many others and
summarized in a report to further protect your anonymity. Reminder This is an at-will survey and you
may stop and exit at any time.
Q3 Which gender do you most closely identify with?
Male
Female
Other
Decline to answer
Q4 What is your age?
18-25
26-40
41-55
56-65
65+
Q5 Which ethnicity do you most closely identify with?
American Indian or Alaska Native
Asian
Black or African American
White
Hispanic or Latino
Non-Hispanic
Other
12. Q6 What type of institution are you currently attending?
For-profit College
Liberal Arts College
Public 2-Year College
Public 4-Year College/University
Private 2-Year College
Private 4-Year College/University
Q7 On a scale of 0 to 10, how shy would you say you are? (0 being "not shy at all" and 10 being
"extremely shy")
0
1
2
3
4
5
6
7
8
9
10
Q8 Are you currently employed?
Yes
No
Q9 On average, how many hours per week do you work at your job?
0 hours
1-5 hours
6-10 hours
11-15 hours
16-22 hours
23-30 hours
31-39 hours
40+
13. Q10 Would you say that you pay for approximately 60% or more of your personal expenses? Expenses
include but are not limited to housing, food, net tuition after financial aid, gas, insurance, utilities, and
other personal expenses.
Yes
No
I don't know
Q11 Do your parents currently claim you as a dependent on their taxes?
Yes
No
I don't know
Q12 Growing up, what was your average household size? (Including yourself)
1
2
3
4
5
6
7+
Q13 What is your current household size? (Including yourself)
1
2
3
4
5
6
7+
14. Q14 Growing up, what would you say was your family's annual income?
$0 to $13,000
$13,001 to $30,000
$30,001 to $50,000
$50,000 to $70,000
$70,001 to $90,000
$90,001 to $120,000
$120,001 to $150,000
$150,001 to $200,000
Q15 Which bracket most clearly identifies with your family's current annual income?
$0 to $13,000
$13,001 to $30,000
$30,001 to $50,000
$50,000 to $70,000
$70,001 to $90,000
$90,001 to $120,000
$120,001 to $150,000
$150,001 to $200,000
Q16 Which class do you most closely identify with?
Lower Class
Middle Class
Upper Class
Q17 What is the highest education level or degree your FATHER has achieved?
Less than Middle School
Middle School
Some High School
High School/GED
Some College
Bachelor's Degree
Master's Degree
Advanced Graduate work or Ph.D
Not Applicable / I don't know
15. Q18 What is the highest education level or degree your MOTHER has achieved?
Less than Middle School
Middle School
Some High School
High School/GED
Some College
Bachelor's Degree
Master's Degree
Advanced Graduate work or Ph.D
Not Applicable / I don't know
Q19 What "collar" type job does your FATHER do?
"Blue-Collar" (working class, performs manual labor and earns an hourly wage)
"White-Collar" (salaried professional)
Not Applicable
Q20 What "collar" type job does your MOTHER do?
"Blue-Collar" (working class, performs manual labor and earns an hourly wage)
"White-Collar" (salaried professional)
Not Applicable
Q21 How likely are you to participate in one or more of the following with the intent of seeking answers
or academic help?
Email a professor or teaching assistant
Attend office hours
Stay after class to speak to a professor or teaching assistant
Acquire a tutor or enroll in an equivalent tutoring program
Talk to an academic counselor
Very Unlikely
Unlikely
Somewhat Unlikely
Undecided
Somewhat Likely
Likely
Very Likely
16. Q22 How likely are you to engage in the following with the intent of seeking answers or academic help?
Very
Unlikely
Unlikely
Somewhat
Unlikely
Undecided
Somewhat
Likely
Likely
Very
Likely
Email a
professor
or teaching
assistant
Attend
office
hours
Speak to a
professor
or teaching
assistant
Acquire a
tutor or
enroll in an
equivalent
tutoring
program
Talk to an
academic
counselor