Michigan Model for Health K 5 Revised Update Training 08 09
Common Threads Survey Manuscript
1. Laura Ruiz
Teacher Survey for Nutrition Knowledge and Attitudes:
Testing for Validity and Reliability
Abstract
Objective
The purpose of this study is to create and validate a survey intended to collect nutrition
knowledge & attitudes of U.S. teachers.
Methods
The survey was developed to gather information covering six themes of nutrition
knowledge and attitudes of U.S. teachers. Testing of the survey involved two waves
and cognitive testing of three respondents in the first wave of testing. Wave one of
testing involved a convenience sample of teachers and non-teachers and wave two of
testing involved teachers of a school district in Texas. A reliability test was performed
using Cronbach’s Alpha. Validity testing was done using a Wilcoxon rank-sum test.
Results
Wave one of testing involved 24 respondents. Wave two of testing involved 70
responses from teachers and 78 non-teaching school staff. A Cronbach’s Alpha score
of α=0.41 indicates low reliability of nutrition knowledge questions. However, validity
was found in the nutrition knowledge question with teachers scoring higher after
nutrition education through employer or worksite wellness (P=0.011 and P=0.005
respectively).
Conclusions
This study indicates valid survey with low reliability. Additional editing and testing is
needed to determine reliability of nutrition knowledge questions.
2. Laura Ruiz
Introduction
Obesity rates in the United States have been steadily climbing over the past 15 years.
This includes obesity seen in youth. Children ages 2-19 years saw an obesity rate at
17% in 2014.1 This is especially concerning because children who are obese are much
more likely to remain obese into adulthood.2,3 With the adult obesity rate being 36.5%
in 2014, prevention strategies are needed more than ever.1 While it is important to
emphasize a healthy lifestyle at home, it is also crucial to teach obesity prevention
activities in school. Many studies can be found on looking at family and environmental
factors in relation to childhood obesity; however, few studies4-6 look at teacher health in
comparison. Children spend many hours in the classroom and teachers have a
substantial effect on a child’s life. Improving teacher health can have greater effects in
the classroom environment when trying to prevent childhood obesity.4
It is important for educators to have a strong base in nutrition and health in order to
teach effective obesity prevention strategies. Teachers who do not have proper
nutrition education cannot be expected to effectively teach nutrition in the classroom.
The lack of nutrition education may also carry over to a teacher’s nutrition habits, of
which can be observed by students. Many teachers may not have recent or any formal
training in nutrition. The purpose of this study is to create and validate a survey
intended to collect nutrition knowledge and attitudes of U.S. teachers. This survey will
be used in further studies with the intention to prevent childhood obesity.
Methods
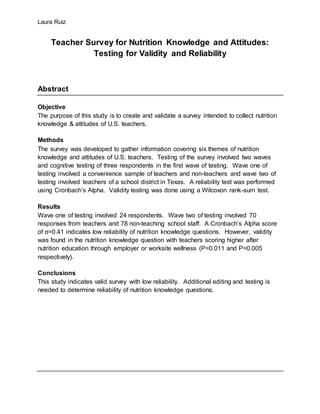
Survey questions were developed from six themes based on the desired nutrition
knowledge from teachers. From those themes, twenty-one sub-themes were developed
to further categorize questions. The themes and sub-themes are illustrated in Figure 1.
Survey themes and sub-themes were developed after looking at previous literature to
determine gaps in the collection of teacher health and nutrition knowledge. Past
surveys were discovered of teachers’ nutrition knowledge on the Food Pyramid and
MyPlate.7-8, 12 From these surveys, gaps were found among the themes Teaching
Efficacy, Attitudes & Practices, Role Modeling, and Perceived Health of Students. Many
questions used in this survey were taken from surveys previously tested for validity and
reliability.7-13 On the final survey, 17 original questions were developed to ensure all
themes were represented. Sub-themes that contain only original questions are
Previous Nutrition Education, Barriers to Nutrition Education, Perceived Health of
Current Diet, Desire to Change Diet, Foods Eaten in Front of Students, and Perception
of Students’ Nutrition Knowledge.
3. Laura Ruiz
The initial survey contained 148 questions that covered each of the sub-themes in the
survey design. Each survey question was then analyzed and discusses to determine its
appropriateness for the survey, if the question is repeated at all among the other
questions, and for comprehension. The survey was then edited to 48 questions; 13
questions regarding Nutrition Knowledge, 8 questions regarding Teaching Efficacy, 9
questions regarding Attitudes & Practices, 5 questions regarding Perceived Health of
Students, 3 questions regarding Role Modeling, and 10 questions regarding
Demographics.
Figure 1. Six themes of survey questions with Sub -Themes listed below.
The first wave of testing the survey involved a convenience sample of teachers and
non-teachers recruited over social media. Respondents were able to click a link which
took them to the survey in Google Forms format. All respondents’ survey submissions
were anonymous and there was no way to connect information provided in the survey to
any respondent. From those responses, three respondents agreed to participate in
cognitive testing. Cognitive testing is done to ensure quality and clarity of questions by
allowing a certain number of respondents to discuss questions in an open-type
interview.14,15 The cognitive testing interviews were organized into six subjects: Think
Aloud/General, Comprehension, Retrieval, Confidence, Difficulty, and Answer
Appropriateness. The Think Aloud/General, Comprehension, and Retrieval subjects
were asked as open ended questions. The Confidence and Difficulty questions were
answered on a Likert-type scale and the Answer Appropriateness questions were
answered as yes or no with the possibility of additional discussion. Figure 2 shows the
cognitive testing subjects along with the questions asked. Survey questions 1-12 went
through all six subjects of cognitive testing. Survey questions 13-48 went through the
Nutrition
Knowledge
Dietary & School
Health Guidelines
MyPlate
Knowledge of
Access to Nutrtiion
Information
Teaching Efficacy
Previous Nutrition
Education
History of Teaching
Nutrition in the
Classroom
Barriers to
Nutrition
Education
Perceived
Importance of
Nutrition
Education
Attitudes&
Practices
Types and
Frequency of
Foods Eaten
Perceived Health
of Current Diet
Desire to Change
Diet
PerceivedHealth
of Students
Perception of
Students' Nutrition
Knowledge
Perception of
Parents' Nutrition
Knowledge
Perception of
Students' Health
Status
Students'
Nutritional Needs
at Home
Role Modeling
Perceived Health
Status
Foods Eaten in
Front of Students
Foods Provided to
Students
Demographics
Age, Race,
Ethnicity, Gender
Subject & Grade
Level Taught/
Number of Years
Teaching
Highest Level of
Education
Obtained
Health Information
4. Laura Ruiz
Think Aloud/General, Comprehension, and Answer Appropriateness subjects of
cognitive testing. A total of two cognitive tests were done. The first had two
respondents of the survey, and the second only had one respondent.
Figure 2. Cognitive testing subjects with subjectquestions below.
Each cognitive testing interviewee’s answer were put into one of numerical categories
based on their response. For the Think Aloud/General question, responses were
categorized as: (1) positive response, (2) neutral response, or (3) negative response.
Key words were observed that assisted with judgement in categorization of answers
such as “good question, bad question, I don’t like this question, etc.” There were three
categories of which the interviewee’s responses to the Comprehension question were
placed in: (1) no confusion, (2) minor confusion, (3) major confusion. Interviewee’s
answers to the Retrieval question answers were also placed into three categories: (1)
easy retrieval, (2) moderate retrieval, (3) difficult retrieval. The Confidence and Difficulty
questions were answered by the respondents on a scale rating from one to five. The
interviewee’s answers in the last category, Answer Appropriateness, were placed into
three categories: (1) yes, (2) somewhat, and (3) no.
Wave two of testing consisted of a sample of teachers from an independent school
district in Texas. Consent was given from the superintendent of the school district. The
link to the survey was sent by email to the superintendent who then sent the link to all
teachers in the school district. The school district consists of five elementary schools
(grades Pre-Kindergarten-4th), one intermediate school (grades 5th-6th), one junior high
(grades 7th-8th), and one high school (grades 9th-12th). Teachers were given a week and
five days to complete the survey and all submissions were anonymous. Figure 3 shows
the version of the survey used for wave two testing. Results from the cognitive test and
wave two survey were transferred into Microsoft Excel16 so the data could be viewed for
errors. The data was then analyzed using SAS17. Tests for internal consistency of
nutrition knowledge questions were done using Cronbach’s Alpha with the level of
Think
Aloud/General
•Do you have any
comments or
concerns with
this question?
Comprehension
•Is there anything
about this
question thatis
confusing?
Retrieval
•How did you
come up with
your answer?
•What was your
thinking
process?
Confidence
•On a scaleof1 to
5, with 1 being
not confident
and 5 being very
confident,how
confident are
you in your
answer tothis
question?
Difficulty
•On a scaleof1 to
5, with 1 being
very difficultand
5 being very
easy, how
difficult or easy
did you find this
question?
Answer
Appropriateness
•Do you feel the
answer choices
or answerformat
to this question
was
appropriate?
5. Laura Ruiz
internal consistency set at α=0.70. Tests for validity of nutrition knowledge questions
were done with a Wilcoxon rank-sum test with significance set at P<0.05.
Results
Wave one of testing yielded 23 respondents. The respondents consisted of 65%
females, 26% males, 9% did not answer, 78% are of White/Caucasian race, 22% are
Hispanic or Latino, 13% are 18-24 years, 52% are 25-34 years,13% are 35-44 years,
4% are 45-54 years, and 18% are 55-64 years. There were 4 respondents who
identified as having teaching experience, with 2 identifying currently teaching 5th grade.
The average score of respondents on the nutrition knowledge section of the survey was
72% with the range of scores being 42% to 92%. The average score of respondents
claiming they have not had any nutrition training was 81% while those who have
claimed to have some type of nutrition training had an average score 69%.
Interviewees of the cognitive testing consisted of two males and one female.
Interviewees’ professions are a curriculum developer of a school district, an utility
company employee with previous teaching experience, and a university student
studying to be a teacher. The Think Aloud/General subject averages are 1.67-2.33.
Survey questions 48, 43, and 22 had the highest scores indicating a more negative
response. The Comprehension subject averages are 1-1.67. Survey questions 2 and
43 had the highest scores indicating more confusion. The Retrieval subject averages
are 1.00-2.67. Survey questions 3 and 7 had the highest scores indicating more
difficulty in answer retrieval. The Confidence subject averages are 2.00-5.00. Survey
question 7 had the lowest score indicating less confidence in answer choice. The
Difficulty subject averages are 2.00-5.00. Survey question again had the lowest score
indicating a more difficult question to answer. The Answer Appropriateness subject
averages are 1.00-1.33. Questions 4, 5, 9, 31, 34, 38, 44, and 47 had the highest
scores indicating less appropriateness of answer choices or answer format. After the
wave one of testing and the cognitive testing interview, seven questions or the answer
choices or formats of those questions were changed.
Wave two of testing yielded a total of 148 respondents. Of these responses, 2 were
blank and were deleted from the dataset. Another response provided inappropriate
responses such as a height of 7 feet, an impossible choice for gender, and chose every
box for race/ethnicity. Due to these responses, the record was deleted from the
dataset. For the weight category, one respondent wrote “na” and another respondent
wrote “idk.” These results were not indicative of a weight in pounds and the variable in
that record was deleted to be blank. One respondent answered “yes” for the gender
category and that variable in the record was deleted to be blank. For the dataset
6. Laura Ruiz
specific of teachers, records were not included if they included two or more survey
answers as “Not Applicable/I am not a teacher”.
Teachers made up 70 responses and non-teaching staff made up 78 responses. The
school district consists of 309 teachers, providing a teacher response rate of 22.7%. Of
the teachers who responded, 80% are female, 13% are male, and 7% did not answer
the gender question. The average score of teachers on the nutrition knowledge section
of the survey was 70% with the range of scores being 17% to 100%. The average
score of respondents claiming they have not had any nutrition training was 71% while
those who have claimed to have some type of nutrition training had an average score
69%. Table 1 displays the distribution of certain variables by averages score on the
nutrition knowledge questions and by average BMI.
Table 1. Distribution of Teachers by Average Nutrition Knowledge Score and Average BMI
Variable Average Score of
Nutrition Knowledge
Questions
Mean (SD)
Average BMI
Mean (SD)
Years Teaching Less than 5 years 0.68 (0.11) 26.82 (3.88)
5-9 years 0.66 (0.09) 28.74 (8.82)
10-14 0.66 (0.18) 27.28 (6.29)
15-19 0.65 (0.12) 28.34 (7.06)
20 or more 0.77 (0.14) 28.51 (5.00)
Participation in
Wellness programs
No, I have not
participated
0.70 (0.11) 26.78 (7.70)
Yes, I participated
once
0.63 (0.22) 30.47 (8.38)
Yes, I participated
several times
0.69 (0.13) 27.77 (5.28)
Yes, I participate often 0.79 (0.11) 28.45 (3.73)
Number of Times
Fruit was Consumed
in Last Week
0 Times 0.72 (0.05) 29.60 (10.05)
1-3 Times 0.69 (0.12) 29.10 (6.87)
4-6 Times 0.75 (0.18) 27.22 (5.02)
7-9 Times 0.65 (0.14) 28.35 (5.30)
10 or More Times 0.69 (0.12) 21.36 (0.56)
Gender Male 0.67 (0.23) 26.58 (4.19)
Female 0.72 (0.12) 28.13 (6.46)
Age 18-24 Years 0.46 (0.41) 24.65 (0.63)
25-34 Years 0.67 (0.11) 26.19 (3.56)
35-44 Years 0.65 (0.11) 28.47 (8.54)
45-54 Years 0.74 (0.12) 28.32 (5.34)
55-64 Years 0.74 (0.16) 29.30 (7.04)
Race/Ethnicity White/Caucasian 0.71 (0.12) 27.32 (5.70)
Hispanic/Latino 0.69 (0.09) 28.22 (5.41)
Multi-Race/Ethnicity 0.57 (0.27) 31.69 (11.13)
Cronbach’s Alpha was used to test for internal consistency of the questions testing
nutrition knowledge. It was determined the nutrition knowledge questions did not reach
7. Laura Ruiz
the level for internal consistency (Cronbach α=0.41). With the removal of 4 questions in
the nutrition knowledge section, a higher level for internal consistency was reached, but
was still not determined to be consistent (Cronbach α=0.56).
A Shapiro-Wilk test was run to test for the normality of Nutrition Knowledge score data.
A score of p=0.0002 was found, indicating the distribution is not normal. From this
finding, it was decided the Wilcoxon rank-sum test is appropriate for this data. The
Wilcoxon rank-sum test provided p-values for the average nutritional knowledge score
of teachers compared to types of nutrition education they have received. Statistically
significant differences in nutrition knowledge scores were found for teachers who had
previous nutrition education with worksite wellness (p=0.005) and with their employer
(p=0.011). Teachers who received any nutrition education (p=0.980), nutrition
education with a college or university (p=0.747), nutrition education with a community
organization (p=0.422), or any other nutrition education (0.985) did not have statistically
significance in difference of scores. Table 2 displays these results.
Table 2. Average Nutrition Knowledge Score of Teachers with Different Types of Nutrition Education
Training
Variable Mean (SD) 95% CI P
Any Nutrition Education 0.71 (0.12) 0.67 0.74 0.980
College or University Coursework 0.70 (0.14) 0.64 0.76 0.747
Worksite Wellness 0.76 (0.14) 0.70 0.81 0.005*
Employer 0.78 (0.16) 0.70 0.87 0.011*
Community Organization 0.73 (0.13) 0.64 0.83 0.422
Other Nutrition Education 0.69 (0.10) 0.46 0.93 0.985
CI, Confidence Interval; * denotes statistically significant result when p<0.05.
Discussion
This study is intended to present the validity and reliability of a survey developed to test
and collect information about teacher health and nutrition knowledge. The questions in
this survey were derived from a variety of other surveys along with original questions
intended to measure gaps in existing literature. This survey is intended to be used in a
variety of projects in the future.
The reliability of nutrition knowledge questions in this survey is questionable due to the
Cronbach’s score of 0.41. However, a recent study has shown that Cronbach’s Alpha
may be unreliable and there are other tests that may be preferred.18 A different test of
reliability should be done along with additional changes to the survey. Validity of the
nutritional knowledge portion was found to be good with nutritional knowledge scores
found significant in teachers who have had previous nutrition education with worksite
wellness and with their employer. Teachers did not have significantly higher nutrition
knowledge scores with previous nutrition education in college or university coursework,
8. Laura Ruiz
community organization, or other. This may be due to the quality and amount of time
that has passed since they have taken those nutrition education courses. This hold
especially true since 70% of the teachers in this survey have 10 or more years of
teaching experience.
While few resources have been found regarding teacher’s health and nutrition, a similar
study was done in California to show validity and reliability of a survey.8 However, this
survey is meant to collect information on nutritional knowledge of adults, not specifically
teachers. This study has a Cronbach’s Alpha for internal consistency as α=0.91.
Several questions from that survey were used for the survey developed described in
this study.
The primary limitation of this study is the sample population that took this survey. The
teachers are a part of one school district in Texas, of which may not be representative
of the U.S. population. There is also a possible selection bias because those who took
the survey may be more likely interested in the subject of nutrition. Another limitation is
a possible recall bias. All information collected is assumed true by the survey takers,
and that leaves the option for error or untruthfulness from the survey taker. Lastly, the
tool used to disseminate the surveys by email leaves the leeway of one person taking
the survey multiple times. This could lead to repeated entries or different data from the
same person.
Conclusion
Validity was confirmed in the survey but continued testing and changes to the survey
are needed to confirm reliability. This survey is intended to be used across the U.S. and
should be able to represent a diverse teacher population. With proper changes, this
survey tool has the potential to collect a wide array of information that can be used to
improve the health of teacher’s and their students.
9. Laura Ruiz
Figure 3. Survey used in Wave Two Testing.
1. Which of these isn’t usually a whole grain?8
a. Popcorn
b. Oatmeal
c. Flour tortillas
d. Brown rice
e. Not sure
2. Which of these should you look for on a label to
tell if a loaf of bread is whole wheat?8
a. 100% wheat
b. Stone-ground wheat
c. Cracked wheat
d. Whole wheat is first in the ingredient list
e. Not sure
3. Do you agree with the following statement?
There is more protein in a glass of whole milk
than in a glass of skimmed milk.9
a. Agree
b. Disagree
c. Not sure
4. Choose the TWO proteins with the least amount
of fat.13
a. Ground Beef
b. White Fish
c. Bacon
d. Black Beans
e. Bologna
5. Why should you eat lean meat and poultry?8
a. They have more vitamins
b. To keep saturated fat low
c. To save money
d. They have more fiber
e. Not sure
6. How are oils like olive and canola oil different
from solid fats like butter and shortening?8
a. Oils are usually lower in saturated fat
b. Oils raise LDL (bad) cholesterol
c. Oils are usually higher in saturated fat
d. Oils are always hydrogenated
e. Not sure
7. Which of the following foods is highest in
saturated fat?
a. Peanuts
b. Skim milk
c. Olive oil
d. Red meats
e. Avocados
8. Which food has more total fat in a serving size of
4 ounces?8
a. Fried Chicken
b. Salmon Fillet
c. They both have the same
d. Not sure
9. What is the daily amount of vegetables an adult
should eat?8
a. 1 to 2 cups each day
b. 2 to 3 cups each day
c. 5 to 6 cups each day
d. 6 to 7 cups each day
e. Not sure
10. Do health experts recommend that people should
be eating more, the same amount, or less of
vegetables?9
a. More
b. Same
c. Less
d. Not Sure
11. Do health experts recommend that people should
be eating more, the same amount, or less of
sugary foods?9
a. More
b. Same
c. Less
d. Not Sure
10. Laura Ruiz
12. Do health experts recommend that people should
be eating more, the same amount, or less of salty
foods?9
a. More
b. Same
c. Less
d. Not Sure
13. How much information has yourschool provided
you with on nutrition education in the past
year?10
a. More than I want
b. As much as I want
c. Less than I want
d. None
14. Have you ever received training on nutrition
education in the following settings?
a. College or University Coursework
b. Employed School or School District
c. Worksite Wellness
d. Community Organization
e. Common Threads’ Healthy Teacher
Training
f. Other_______________________
g. I have never received training on nutrition
education.
15. During this schoolyear, did you teach any of the
following nutrition and dietary behavior topics to
your students? (Markall that apply)7
a. Benefits of healthy eating
b. Benefits of drinking plenty of water
c. Benefits of eating breakfast every day
d. Using food labels
e. Eating more fruits, vegetables,and whole
grain products
f. Choosing foods, snacks,and beverages
that are low in added sugars
g. Other_______________________
h. None of the above
16. How strongly do you agree with the following
statement? I find it easy to incorporate nutrition
lessons into my curriculum.
a. Strongly agree
b. Agree
c. Undecided
d. Disagree
e. Strongly disagree
17. How strongly do you agree with the following
statement? I feel that my schoolor schooldistrict
is supportive of nutrition education in the
classroom.
a. Strongly agree
b. Agree
c. Undecided
d. Disagree
e. Strongly disagree
18. How strongly do you agree with the following
statement? I have easy access to teaching
materials or lessons on nutrition education for
my classroom
a. Strongly agree
b. Agree
c. Undecided
d. Disagree
e. Strongly disagree
19. How important do you believe it is to teach
students about nutrition as part of the school
curriculum?12
a. Very Important
b. Important
c. Moderately Important
d. Slightly Important
e. Not Important
20. How important is the subject of nutrition
compared to othersubjects you teach (such as
math, English, science, etc.)?12
a. More Important
b. Same Importance
c. Not as Important
11. Laura Ruiz
21. How confident are you that you can change your
students’nutritionalknowledge?12
a. Very Confident
b. Confident
c. Moderately Confident
d. Slightly Confident
e. Not Confident
22. Are you on a special diet?9
a. Yes, a low carb diet
b. Yes, a low fat diet
c. Yes, a low calorie diet
d. Yes, another
diet_______________________
e. I am not on a special diet
23. On average, how long each weekday do you
have to eat lunch?
a. I don’t eat lunch
b. Less than 15 minutes
c. 15-29 minutes
d. 30-44 minutes
e. 45-59 minutes
f. 60 or more minutes
24. During the past week, how many times did you
eat fruit? Include fresh, canned,or frozen fruit.10
a. 0 Times
b. 1-3 Times
c. 4-6 Times
d. 7-9 Times
e. 10 or More Times
25. During the past week, how many times did you
have vegetables to eat other than potatoes?
Include fresh, canned,or frozen fruit.10
a. 0 Times
b. 1-3 Times
c. 4-6 Times
d. 7-9 Times
e. 10 or more Times
26. In general, how healthy is youroverall diet?
Would you say:
a. Excellent
b. Very good
c. Good
d. Fair
e. Poor
27. Does your schoolor schooldistrict provide
wellness programs or wellness incentives for
teachers? (Can include online resources, stress
management classes,physical activity
opportunities,etc.)
a. Yes
b. No
c. Don’t Know
28. If yes, have you participated in a wellness
program provided?
a. Yes, I participated once
b. Yes, I participated several times
c. Yes, I participate often
d. No, I have not participated
29. In the past,year have you attempted to:
a. Gain Weight
b. Lose Weight
c. Keep the same Weight
d. I don’t weigh myself
30. When you hear or read a new recommendation
about nutrition, are you more likely to:10
a. Change food habits according to new
recommendation
b. Wait to get more information
c. Ignore the new recommendation
31. In general, would you say yourhealth is:10
a. Excellent
b. Very good
c. Good
d. Fair
e. Poor
12. Laura Ruiz
32. During the past 12 months, how many times did
you go to a doctor, nurse or other health care
provider to get care for yourself?10
a. None
b. 1 time
c. 2 times
d. 3 times
e. 4 times
f. 5-9 times
g. 10 or more times
33. In the past week, what type of foods or drinks
have you consumed in front of your students?
a. Vegetables
b. Fruits
c. Sugary foods (candy, cookies, etc.)
d. Salty foods (chips, crackers, etc.)
e. Soda or sports drinks
f. Coffee or tea
g. Water
h. I have not consumed food or drinks in
front of my students
34. Do you believe your students’nutrition
knowledge is:
a. Excellent
b. Very Good
c. Good
d. Fair
e. Poor
35. Which of these bodies below do you think a 4th
grade boy should look like?11
a. 1
b. 2
c. 3
d. 4
e. 5
f. 6
g. 7
36. Which of these bodies do you think a 4th grade
girl should look like?11
a. 1
b. 2
c. 3
d. 4
e. 5
f. 6
g. 7
37. On average, do you believe your students weigh:
a. Too much
b. The right amount
c. Too little (or not enough)
38. In your neighborhood,do you have easy access
to: (mark all that apply)11
a. Walking or bike paths (sidewalks,
crosswalks, etc.)
b. Availability of safe parks, playgrounds,
community centers
c. Supermarkets or grocery stores that offer
healthy food
13. Laura Ruiz
39. How many consecutive years have you been
teaching?
a. Less than 5 years
b. 5-9 years
c. 10-14 years
d. 15-19 years
e. 20 or more years
40. What grade level are you currently teaching?
a. Pre-K
b. Kindergarten
c. 1st Grade
d. 2nd Grade
e. 3rd Grade
f. 4th Grade
g. 5th Grade
h. 6th Grade
i. 7th Grade
j. 8th Grade
41. What subject are you currently teaching?
a. Pre-K
b. Kindergarten
c. General Elementary Education
d. Math
e. English
f. Social Studies
g. Science
h. Physical Education
i. Art
j. Foreign Language
k. Other_____________________
42. What is the highest grade or level of schoolyou
have finished?8
a. Less than 8th grade
b. 8th through 11th grade
c. High schooldiploma or GED
d. Vocational or technical training
e. Some college
f. Associate’s degree
g. Bachelor’s degree
h. Postgraduate
43. At the end of the month after paying for
mortgage, rent, bills, groceries, necessities,etc.,
how much money are you able to put aside?
Your best estimate is fine.
a. Nothing
b. $99 or less
c. $100 to $249
d. $250 to $499
e. $500 to $999
f. $1,000 or More
44. What is your gender?
_________________________________
45. How would you describe yourself? (Mark all that
apply)
a. Native American or Alaska Native
b. Asian or Asian American
c. Black/African American
d. Hispanic or Latino
e. Native Hawaiian or other Pacific Islander
f. White/Caucasian
g. Other _____________________
46. How old are you?
a. 18-24 years
b. 25-34 years
c. 35-44 years
d. 45-54 years
e. 55-64 years
f. 65-74 years
g. More than 75 years
47. About how tall are you without shoes?
______ Feet ______ Inches
48. About how much do you weigh?
______ Pounds
14. Laura Ruiz
References
1. Ogden CL, Carroll MD, Fryar CD, Flegal KM. Prevalence of Obesity Among Adults and Youth: United
States, 2011-2014. NCHS Data Brief. 2015;(219):1-8.
2. Whitaker RC, Wright JA, Pepe MS, Seidel KD, Dietz WH. Predicting obesity in young adulthood from
childhood and parental obesity. N Engl J Med.1997;337 :869– 873
3. Barlow SE and the Expert Committee. Expert committee recommendations regarding the prevention,
assessment, and treatment of child and adolescent overweight and obesity: summary report.
Pediatrics 2007;120 Supplement December 2007:S164—S192.
4. Esquivel M, Nigg C, Fialkowski M, Braun K, Li F, Novotny R. Influence of teachers' personal health
behaviors on operationalizing obesity prevention policy in Head Start preschools: A project of the
Children's Healthy Living Program (CHL). Journal Of Nutrition Education And Behavior [serial online].
May 2016;48(5):318-325. Available from: PsycINFO, Ipswich, MA. Accessed August 31, 2016.
5. Jones A, Zidenberg-Cherr S. Exploring nutrition education resources and barriers, and nutrition
knowledge in teachers in California.Journal Of Nutrition Education And Behavior [serial online]. March
2015;47(2):162-169. Available from: PsycINFO, Ipswich, MA. Accessed August 31, 2016.
6. Kinsler J, Slusser W, Toller Erausquin J, Chan Le T, Prelip M. Nutrition Knowledge and Self-Efficacy
Among Classroom Teachers From a Large Urban School District in Los Angeles County. Californian
Journal Of Health Promotion [serial online]. July 2012;10(1):117-124. Available from: CINAHL
Complete, Ipswich, MA. Accessed August 31, 2016.
7. Adolescent and School Health: Profiles Questionnaires Teacher Questionnaire 2016. Centers for
Disease Control and Prevention.
http://www.cdc.gov/healthyyouth/data/profiles/pdf/2016/questionnairet.pdf. Updated September 5,
2016. Accessed September 12, 2016.
8. Jones A, Zidenberg-Cherr S, Wooten Swanson P, et al. Reliability and validity of nutrition knowledge
questionnaire for adults. Journal Of Nutrition Education And Behavior [serial online]. January 1,
2015;47(1):69-74. Available from: Scopus®, Ipswich, MA. Accessed September 7, 2016.
9. Parmenter K, Wardle J. Development of a general nutrition knowledge questionnaire for adults.
European Journal Of Clinical Nutrition [serial online]. April 1999;53(4):298-308. Available from:
MEDLINE Complete, Ipswich, MA. Accessed September 7, 2016.
10. D. Cantor, J. Covell, T. Davis, I. Park, L. Rizzo. Health Information National Trends Survey 2005
(HINTS 2005): Final Report. National Cancer Institute, Bethesda, MD (2005).
11. Ranjit N, Wilkinson AV, Lytle LM, Evans AE, Saxton D, Hoelscher DM. Socioeconomic inequalities in
children’s diet: the role of the home food environment. The International Journal of Behavioral
Nutrition and Physical Activity. 2015;12(Suppl 1):S4. doi:10.1186/1479-5868-12-S1-S4.
12. Hall E, Chai W, Albrecht J. A Qualitative Phenomenological Exploration of Teachers' Experience With
Nutrition Education. American Journal Of Health Education [serial online]. May 2016;47(3):136-148.
Available from: CINAHL Complete, Ipswich, MA. Accessed September 21, 2016.
13. Common Threads Small Bites Student Pre-Survey. Common Threads.
14. Appendix 4: Cognitive Testing Interview Guide. Center for Disease Control and Prevention Website.
1-8. Accessed November 9, 2016.
15. Debbie C. Pretesting Survey Instruments: An Overview of Cognitive Methods. Quality of Life
Research [serial online]. 2003:229. Available from: JSTOR Journals, Ipswich, MA. Accessed
November 9, 2016.
16. Excel. Microsoft; 2016.
17. SAS. SAS Institute Inc. Verson 9.4. 2012.
18. Trizano-Hermosilla I, Alvarado J. Best Alternatives to Cronbach's Alpha Reliability in Realistic
Conditions: Congeneric and Asymmetrical Measurements. Frontiers In Psychology [serial online].
15. Laura Ruiz
May 26, 2016;:1-8. Available from: Academic Search Ultimate, Ipswich, MA. Accessed December 7,
2016.