Recommended

Recommended
More Related Content
What's hot
What's hot (20)
Similar to Oral Presentation.pptx
Similar to Oral Presentation.pptx (20)
More from AdinaGeorgiana7
More from AdinaGeorgiana7 (20)
Recently uploaded
Recently uploaded (20)
Oral Presentation.pptx
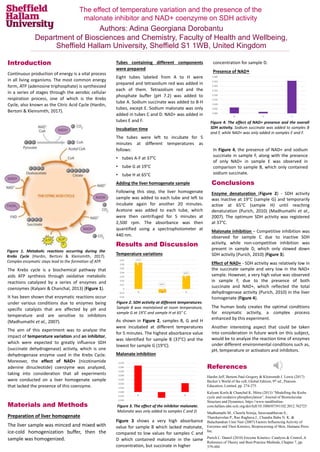
- 1. Department of Biosciences Introduction Continuous production of energy is a vital process in all living organisms. The most common energy form, ATP (adenosine triphosphate) is synthesized in a series of stages through the aerobic cellular respiration process, one of which is the Krebs Cycle, also known as the Citric Acid Cycle (Hardin, Bertoni & Kleinsmith, 2017). The Krebs cycle is a biochemical pathway that aids ATP synthesis through oxidative metabolic reactions catalyzed by a series of enzymes and coenzymes (Kalyani & Chanchal, 2013) (Figure 1). It has been shown that enzymatic reactions occur under various conditions due to enzymes being specific catalysts that are affected by pH and temperature and are sensitive to inhibitors (Madhumathi et al., 2007). The aim of this experiment was to analyze the impact of temperature variation and an inhibitor, which were expected to greatly influence SDH (succinate dehydrogenase) activity, which is one dehydrogenase enzyme used in the Krebs Cycle. Moreover, the effect of NAD+ (nicotinamide adenine dinucleotide) coenzyme was analyzed, taking into consideration that all experiments were conducted on a liver homogenate sample that lacked the presence of this coenzyme. Materials and Methods Preparation of liver homogenate The liver sample was minced and mixed with ice-cold homogenization buffer, then the sample was homogenized. Tubes containing different components were prepared Eight tubes labeled from A to H were prepared and tetrazolium red was added in each of them. Tetrazolium red and the phosphate buffer (pH 7.2) was added to tube A. Sodium succinate was added to B-H tubes, except E. Sodium malonate was only added in tubes C and D. NAD+ was added in tubes E and F. Incubation time The tubes were left to incubate for 5 minutes at different temperatures as follows: • tubes A-F at 37°C • tube G at 19°C • tube H at 65°C Adding the liver homogenate sample Following this step, the liver homogenate sample was added to each tube and left to incubate again for another 20 minutes. Acetone was added to each tube, which were then centrifuged for 5 minutes at 2,500 rpm. The absorbance was then quantified using a spectrophotometer at 440 nm. Results and Discussion Temperature variations As shown in Figure 2, samples B, G and H were incubated at different temperatures for 5 minutes. The highest absorbance value was identified for sample B (37°C) and the lowest for sample G (19°C). Malonate inhibition Figure 3 shows a very high absorbance value for sample B which lacked malonate, compared to low values for samples C and D which contained malonate in the same concentration, but succinate in higher Authors: Adina Georgiana Dorobantu Department of Biosciences and Chemistry, Faculty of Health and Wellbeing, Sheffield Hallam University, Sheffield S1 1WB, United Kingdom The effect of temperature variation and the presence of the malonate inhibitor and NAD+ coenzyme on SDH activity concentration for sample D. Presence of NAD+ In Figure 4, the presence of NAD+ and sodium succinate in sample F, along with the presence of only NAD+ in sample E was observed in comparison to sample B, which only contained sodium succinate. Conclusions Enzyme denaturation (Figure 2) - SDH activity was inactive at 19°C (sample G) and temporarily active at 65°C (sample H) until reaching denaturation (Purich, 2010) (Madhumathi et al., 2007). The optimum SDH activity was registered at 37°C. Malonate inhibition – Competitive inhibition was observed for sample C due to inactive SDH activity, while non-competitive inhibition was present in sample D, which only slowed down SDH activity (Purich, 2010) (Figure 3). Effect of NAD+ - SDH activity was relatively low in the succinate sample and very low in the NAD+ sample. However, a very high value was observed in sample F, due to the presence of both succinate and NAD+, which reflected the total dehydrogenase activity (Purich, 2010) in the liver homogenate (Figure 4). The human body creates the optimal conditions for enzymatic activity, a complex process enhanced by this experiment. Another interesting aspect that could be taken into consideration in future work on this subject, would be to analyze the reaction time of enzymes under different environmental conditions such as, pH, temperature or activators and inhibitors. References Hardin Jeff, Bertoni Paul Gregory & Kleinsmith J. Lewis (2017) Becker’s World of the cell, Global Edition, 9th ed., Pearson Education, Limited, pp. 274-275 Kalyani Korla & Chanchal K. Mitra (2013) “Modelling the Krebs cycle and oxidative phosphorylation”, Journal of Biomolecular Structure and Dynamics; https://www-tandfonline- com.hallam.idm.oclc.org/doi/full/10.1080/07391102.2012.762723 Madhumathi M., Cheerla Srinija, Saravanabhavan S., Thanikaivelan P., Rao Raghava J., Chandra Babu N. K. & Balachandran Unni Nair (2007) Factors Influencing Activity of Enzymes and Their Kinetics, Bioprocessing of Skin, Humana Press Inc. Purich L. Daniel (2010) Enzyme Kinetics: Catalysis & Control, A Reference of Theory and Best-Practice Methods, Chapter 7, pp. 379-484 Figure 1. Metabolic reactions occurring during the Krebs Cycle (Hardin, Bertoni & Kleinsmith, 2017). Complex enzymatic steps lead to the formation of ATP. 37°C 19°C 65°C -0.02 -0.01 0 0.01 0.02 0.03 0.04 0.05 0.06 0.07 B G H Figure 2. SDH activity at different temperatures. Sample B was maintained at room temperature, sample G at 19°C and sample H at 65° C. -0.020 -0.010 0.000 0.010 0.020 0.030 0.040 0.050 0.060 0.070 B C D Figure 3. The effect of the inhibitor malonate. Malonate was only added to samples C and D. 0.000 0.050 0.100 0.150 0.200 0.250 0.300 0.350 0.400 B E F Figure 4. The effect of NAD+ presence and the overall SDH activity. Sodium succinate was added to samples B and F, while NAD+ was only added in samples E and F.