2005 Carbon Dioxide Forecast for Alarm, NT, Canada
•
0 likes•25 views

Time series analysis and forecasting of carbon dioxide counts in Alarm, Northern Territories for the year 2005, projected from climate data from prior years.

Recommended
More Related Content
What's hot
What's hot (9)
Recently uploaded
Recently uploaded (20)
2005 Carbon Dioxide Forecast for Alarm, NT, Canada
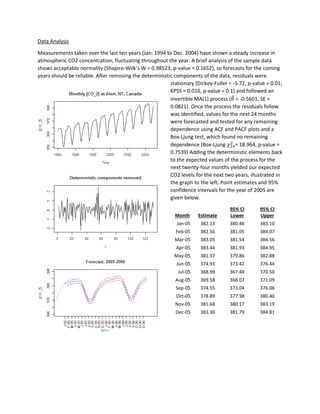
- 1. Data Analysis Measurements taken over the last ten years (Jan. 1994 to Dec. 2004) have shown a steady increase in atmospheric CO2 concentration, fluctuating throughout the year. A brief analysis of the sample data shows acceptable normality (Shapiro-Wilk’s W = 0.98523, p-value = 0.1652), so forecasts for the coming years should be reliable. After removing the deterministic components of the data, residuals were stationary (Dickey-Fuller = -5.72, p-value = 0.01; KPSS = 0.016, p-value = 0.1) and followed an invertible MA(1) process (𝜃̂ = -0.5601, SE = 0.0821). Once the process the residuals follow was identified, values for the next 24 months were forecasted and tested for any remaining dependence using ACF and PACF plots and a Box-Ljung test, which found no remaining dependence (Box-Ljung 𝜒24 2 = 18.964, p-value = 0.7539) Adding the deterministic elements back to the expected values of the process for the next twenty-four months yielded our expected CO2 levels for the next two years, illustrated in the graph to the left. Point estimates and 95% confidence intervals for the year of 2005 are given below. Month Estimate 95% CI Lower 95% CI Upper Jan-05 382.13 380.46 383.10 Feb-05 382.56 381.05 384.07 Mar-05 383.05 381.54 384.56 Apr-05 383.44 381.93 384.95 May-05 381.37 379.86 382.88 Jun-05 374.93 373.42 376.44 Jul-05 368.99 367.48 370.50 Aug-05 369.58 368.07 371.09 Sep-05 374.55 373.04 376.06 Oct-05 378.89 377.38 380.40 Nov-05 381.68 380.17 383.19 Dec-05 383.30 381.79 384.81