1. Modeling CMIP5 Data to Reliably Predict Climate Change in South Texas
Nina Culver advised by Dr. Kartik Venkataraman
Department of Mathematics and Department of Engineering at Tarleton State University
Abstract
‘
CMIP5 (Coupled Model Inter-comparison Project), founded
by the World Climate Research Program (WCRP), provides
numerous models on past climate as well as predicted climate
change. Using the monthly temperature data, the aim of this
project is to predict what combination of models best fits the
observed temperature of the past fifty years in the South Texas
region. Using trend analysis as well as other data mining tech-
niques the research aims to be able to accurately predict the
future trend in climate change for the South Texas region. Pro-
viding information for this region can assist future planning,
in order to optimize every day life for the future and prepare
for the upcoming uncertainties involving climate change.
Background
‘
The South Texas region is rich in agriculture and minerals.
With a changing climate, the main industries of this region
can quickly change. These impacts in climate change can affect
precipitation as well as crop growth which could limit many of
the industries in South Texas. This project aims to predict
the changes in temperature over the next century in order to
prepare for the changes that may occur and understand how
the region will change.
Fig. 1: is an image of the region chosen for the study.
The area chosen is shown in the red box of figure 1, this region
is large and diverse, spanning most of the southern tip of Texas.
Therefore a problem occurs when attempting to assign a model
to this region, it is believed that this problem can be solved
by employing data mining and statistical trends to the data
in order to better understand it and provide reliable ensemble
predictions of climate changes in this region.
Data
‘
The data retrieved is from the CMIP5 project, this data is the
observed average monthly temperature for fifty years as well
as the average monthly temperature based on what the thirty-
four models predicted. The data set spans the region of South
Texas ranging by 1
8
th
of a degree from Corpus Christi on the
east to Laredo on the west, and south to Brownsville. As can
be seen in figure 1, this region spans a large area that has hosts
different terrains and climates.
Data Cont.
Fig. 2: depicts the descrepencies between the original data (last
image) and the models on May, 1961.
The temperatures are then stored in a three dimensional pat-
tern consisting of a point based on latitude, longitude, and
time. The observed values are wildly different than the val-
ues provided in the models, though, because the models are
created at a global scale.
As seen in figure 2, the models all portray a different series
of temperature that the bottom-right plot, the observed data.
Due to the discrepancies of the models being created at a global
level it is important to consider the strengths and weaknesses
of each one.
Statistical Methods
‘
Methods used to understand the data were Mann Kendall tests
as well as linear modeling. Using linear modeling, it was found
that the data is fairly normalized and thus applicable to linear
regression. The linear modeling also provided other tests, such
as a Fisher’s Statistic, the results to this test gave a p-value
that was significant, 0.0000003, and a statistic of 45,630 on the
thirty-seven variables.
A Mann Kendall test showed that the data had no significant
trend over the fifty year period, which was alarming due to
climate change being generally accepted as a positive trend.
As can be seen in figure 3, this trend is not extremely signifi-
cant due to the warm temperatures in the 1950’s. The Mann
Kendall test on this data provided a p-value of 0.725 which
means that the trend (of 0.035) is not significant. Although,
doing the same test on the last thirty years of the data the
p-value is 0.00002 with a trend of 0.676, thus while all fifty
years does not provide a trend there is a significant one of over
half a degree in a three decades.
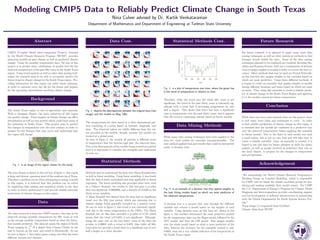
Statistical Methods Cont.
Fig. 3: is a plot of temperature over time, where the green line
is the trend of temperature in relation to time.
Therefore, while the trend over the whole fifty years is not
significant, the trend in the past thirty years is extremely sig-
nificant with a trend that is increasing temperature by over
half a degree. This shows that there has been a significant
raise in temperature over the past thirty years, and it appears
that the trend is continuing onward based on future models.
Data Mining Methods
‘
While many data mining techniques have been applied to the
data set, most results are currently incomprehensible. The
only method applied that gave results that could be interpreted
easily, is decision trees.
Fig. 4: is an example of a decision tree that applies weights to
the best fitting models based on which are most predictive of
the observed temperatures.
A decision tree is a process that runs through the different
variable and returns a model based on the weights of each
variable. Using decision trees on this data set, shown in the
figure 4, this method determined the most predictive models
for the temperature data was the Hages model, followed by the
ACC model, and then the GIS model. This assigns weights
over the whole model based on what is most predictive of the
data, however the accuracy for the ensemble created is only
0.0001, thus not a very reliable indicator of the temperature in
the South Texas region.
Future Research
‘
For future research, it is planned to apply many more data
mining techniques as well as other statistical methods to find
stronger trends within the data. Some of the data mining
techniques planned to be employed are Gradient Boosting Ma-
chines and Random Forests, both use a combination of decision
trees to assign weights to models in order to receive the best ac-
curacy. Other methods that may be used are Neural Networks,
as this function also assigns weights to the variables based on
which are most predictive. Using these different methods, it
is hoped to create an ensemble that applies weights to models
during different locations and times based on which are most
accurate. Thus, using this ensemble to create a reliable predic-
tor of climate change in the South Texas Region and applying
it to the models created for future temperature.
Conclusion
‘
While there has been some research done on this project, there
is still many more ideas and techniques to cover. In order
to find reliable predictions of climate change in this region, it
is essential that the models are combined in a predictive way
over the observed temperatures before applying the ensemble
to future models. Due to the flaws in each model over such
a small region, this is not an easy task and will take time to
create a reliable ensemble. Once an ensemble is created, it is
hoped to use this data for future planners in order for policy
makers, as well as people involved in industries that rely on
the local climate, to prepare for the changes in temperature
and precipitation.
Acknowledgement
‘
“We acknowledge the World Climate Research Programme’s
Working Group on Coupled Modelling, which is responsible
for CMIP, and we thank the climate modeling groups for pro-
ducing and making available their model output. For CMIP
the U.S. Department of Energy’s Program for Climate Model
Diagnosis and Intercomparison provides coordinating support
and led development of software infrastructure in partnership
with the Global Organization for Earth System Science Por-
tals."
Texas image (1) originated from GeoMart
Climate Data from WCRP