Download to read offline


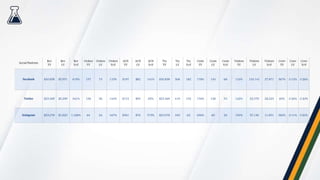


The document highlights challenges in marketing attribution, emphasizing a lack of understanding, data access issues, and the need for tailored models. It showcases a marketing department's approach to tracking performance by implementing URL parameters for digital ads, allowing them to attribute marketing spend effectively. The results show a significant increase in online revenue and return on ad spend, despite a decrease in digital ad spend, underscoring the importance of re-evaluating attribution methodologies.


![[Workshop] Paid Search Landing Page Optimization](https://cdn.slidesharecdn.com/ss_thumbnails/workshoppaidlandingpageoptimizationwithtylergirsberger-171012225810-thumbnail.jpg?width=640&height=640&fit=bounds)
![[Webinar] Do This, Not That: Design for Non-Designers](https://cdn.slidesharecdn.com/ss_thumbnails/webinardothisnotthat-designfornon-designerswithmaggiecall-170914033336-thumbnail.jpg?width=640&height=640&fit=bounds)
![[Workshop] CRO Basics: Principles of High-Converting Pages (No A/B Testing Re...](https://cdn.slidesharecdn.com/ss_thumbnails/workshopchristina-170814191923-thumbnail.jpg?width=640&height=640&fit=bounds)
![[Webinar] Heat Mapping and Turning User Metrics into Actionable CRO Data](https://cdn.slidesharecdn.com/ss_thumbnails/webinarheatmappingandturningusermetricsintoactionablecrodata-170712223506-thumbnail.jpg?width=640&height=640&fit=bounds)
![[Webinar] Rank Zero: Beating Your Competition with Featured Snippets](https://cdn.slidesharecdn.com/ss_thumbnails/webinarbeatingyourcompetitionwithfeaturedsnippets-170613202204-thumbnail.jpg?width=640&height=640&fit=bounds)

![[Webinar] Blocking Spam Efficiently in Google Analytics](https://cdn.slidesharecdn.com/ss_thumbnails/webinarspamtrafficbybarrettdastrup-170510011525-thumbnail.jpg?width=640&height=640&fit=bounds)
![[Workshop] Turning Paid Traffic Into Paying Customers](https://cdn.slidesharecdn.com/ss_thumbnails/workshoppaidtrafficbyericfarmer-170417172746-thumbnail.jpg?width=640&height=640&fit=bounds)
![[Webinar] SEO Metrics That Matter (and Those That Do Not)](https://cdn.slidesharecdn.com/ss_thumbnails/webinarseometricsbypjhowland-170411205238-thumbnail.jpg?width=640&height=640&fit=bounds)
![[Webinar] Advanced Google Analytics](https://cdn.slidesharecdn.com/ss_thumbnails/webinargoogleanalyticsbychristinasanders-170328183539-thumbnail.jpg?width=640&height=640&fit=bounds)
![[Webinar] Advanced Keyword Research](https://cdn.slidesharecdn.com/ss_thumbnails/webinaradvancedkeywordresearchbypaxtongray-170315203410-thumbnail.jpg?width=640&height=640&fit=bounds)
![[Workshop] Compounding SEO Wins](https://cdn.slidesharecdn.com/ss_thumbnails/workshopcompoundingseowinsbypjhowland-170314212112-thumbnail.jpg?width=640&height=640&fit=bounds)


