Download as PDF, PPTX

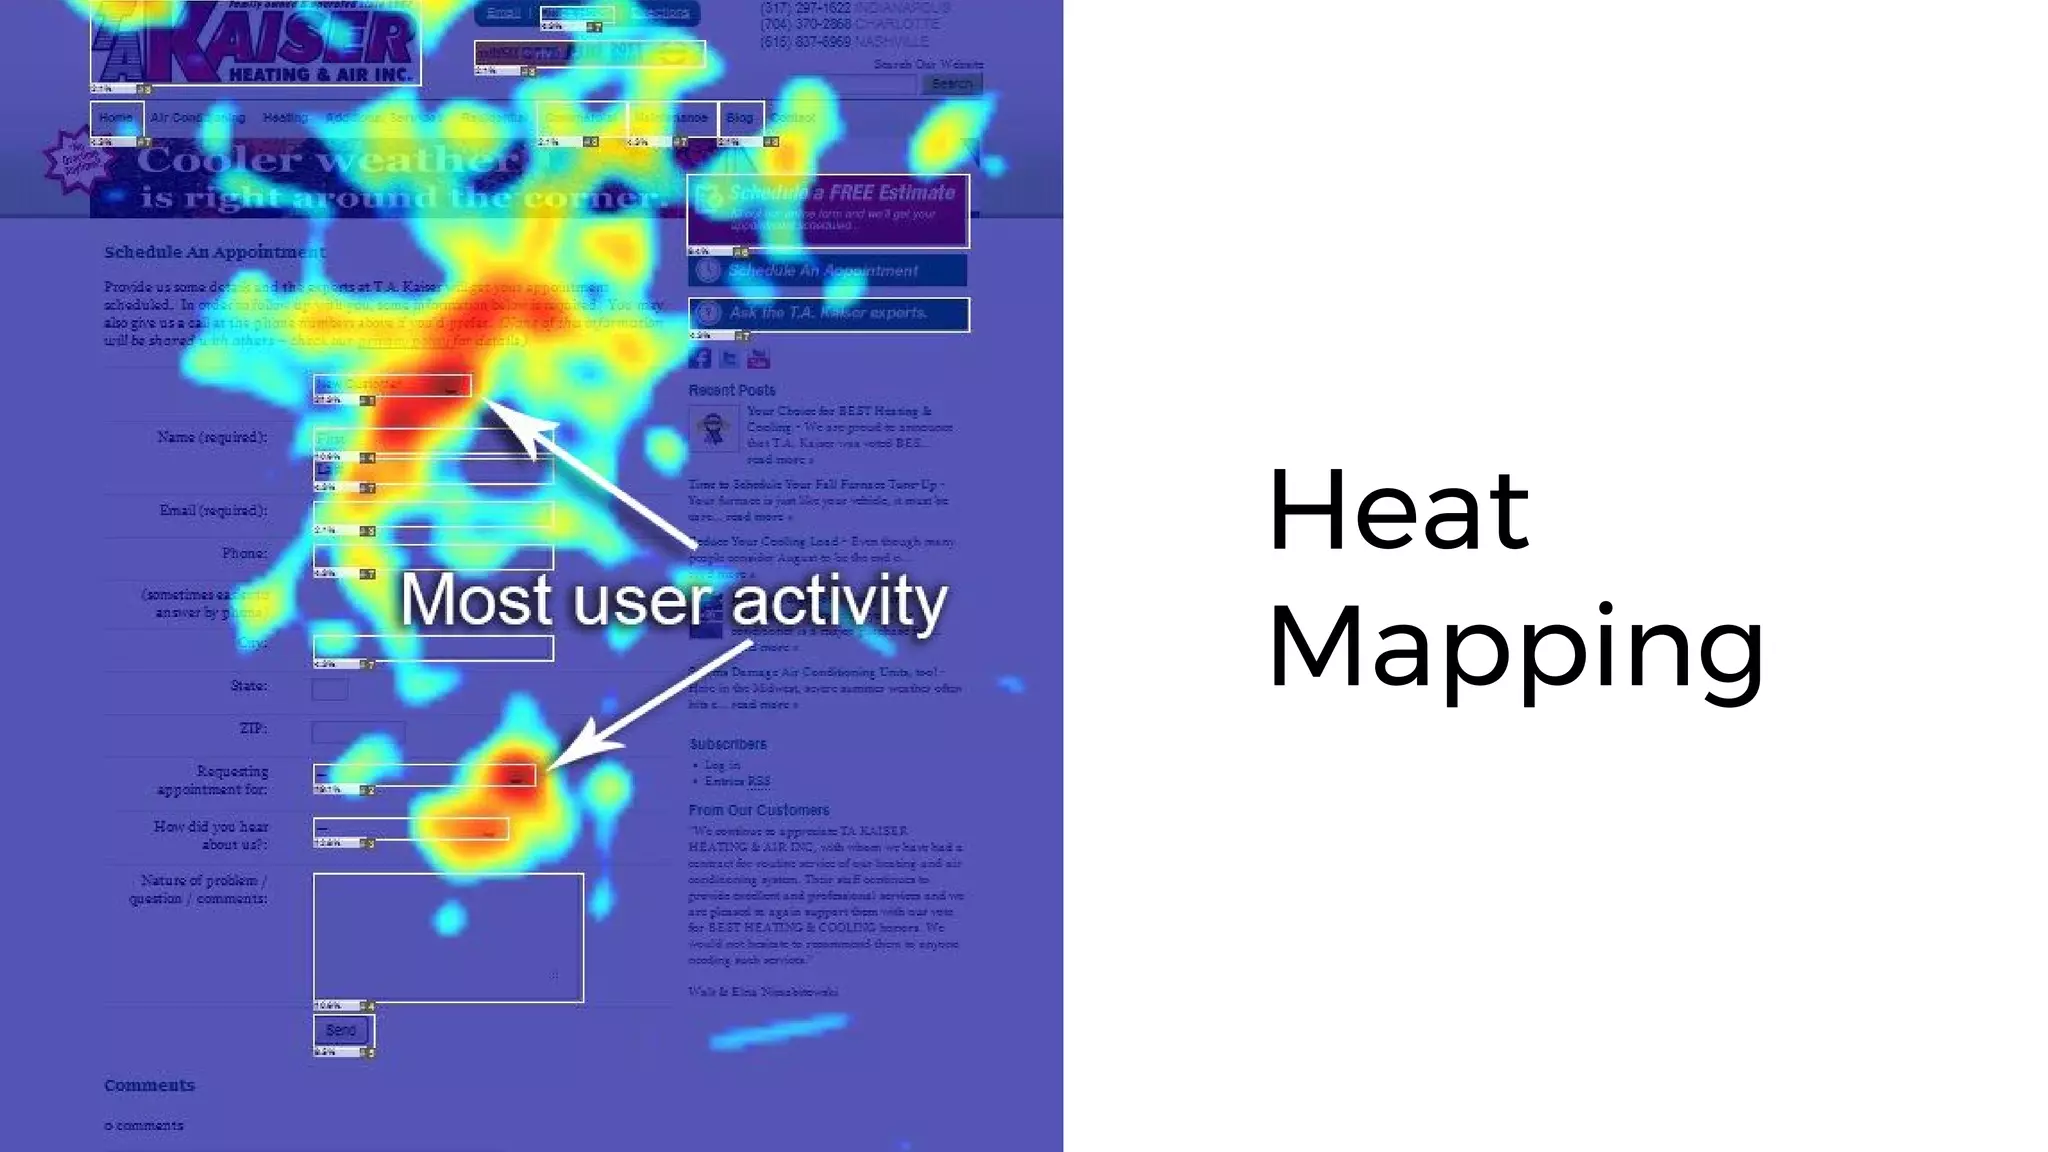
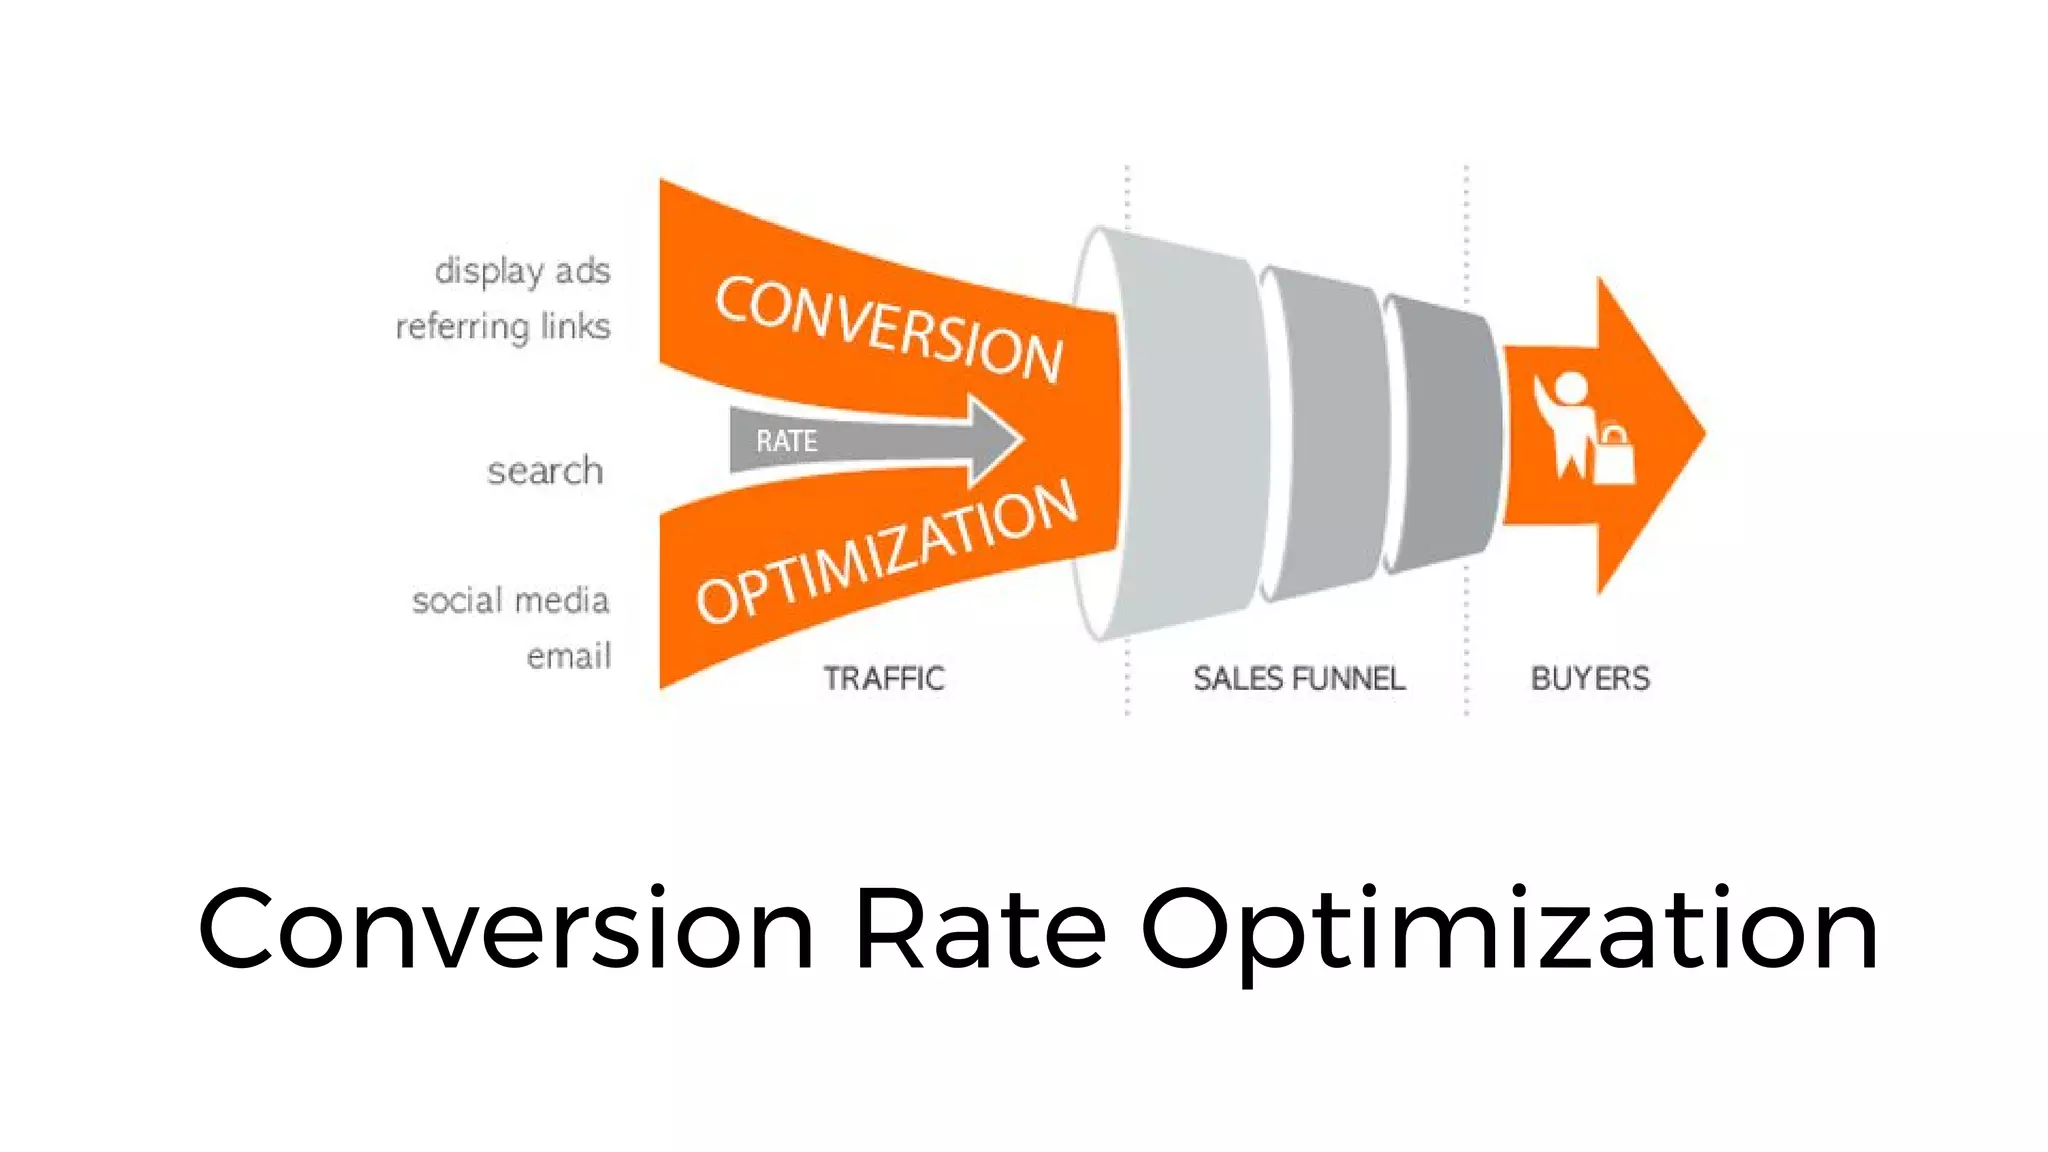


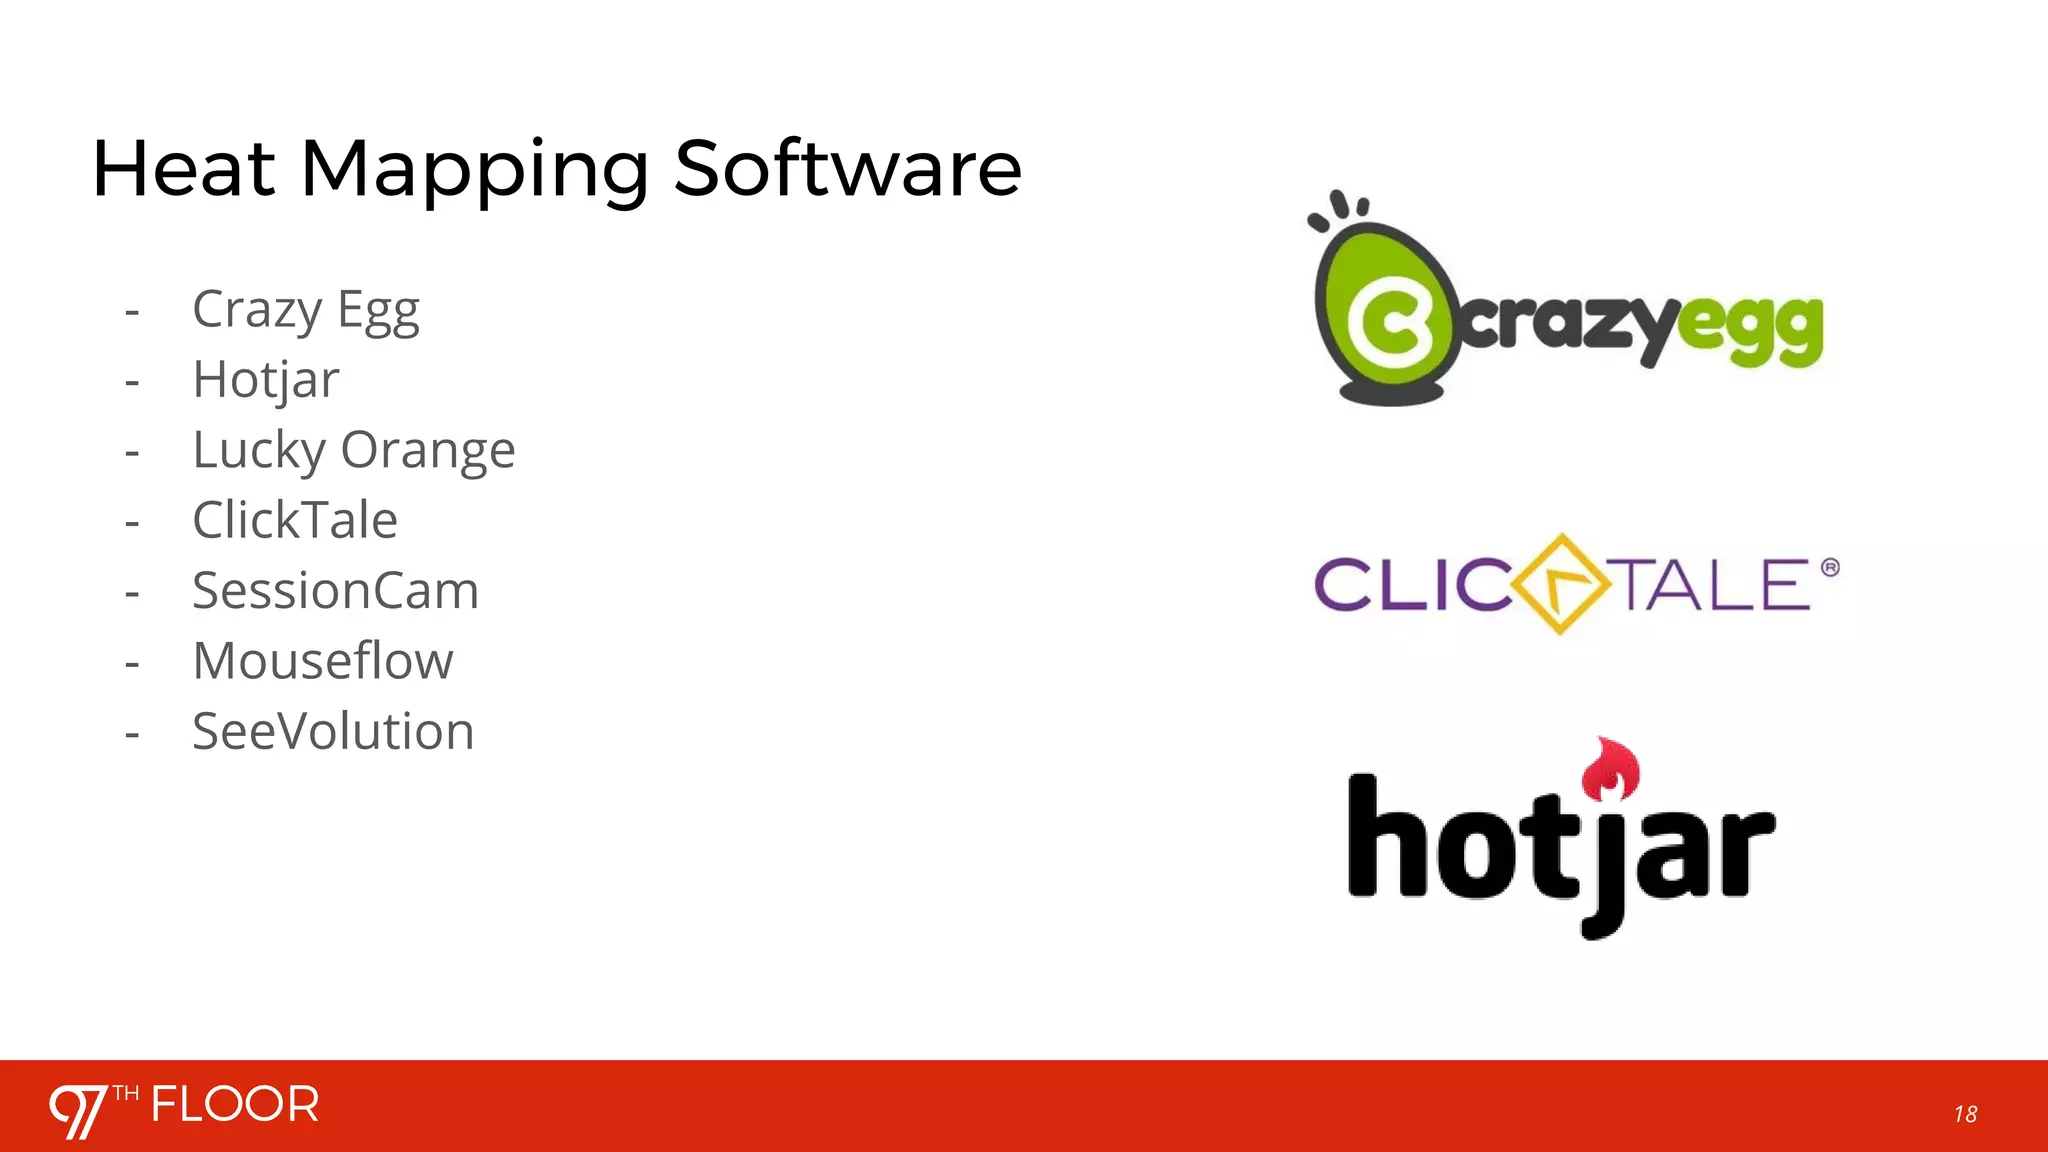
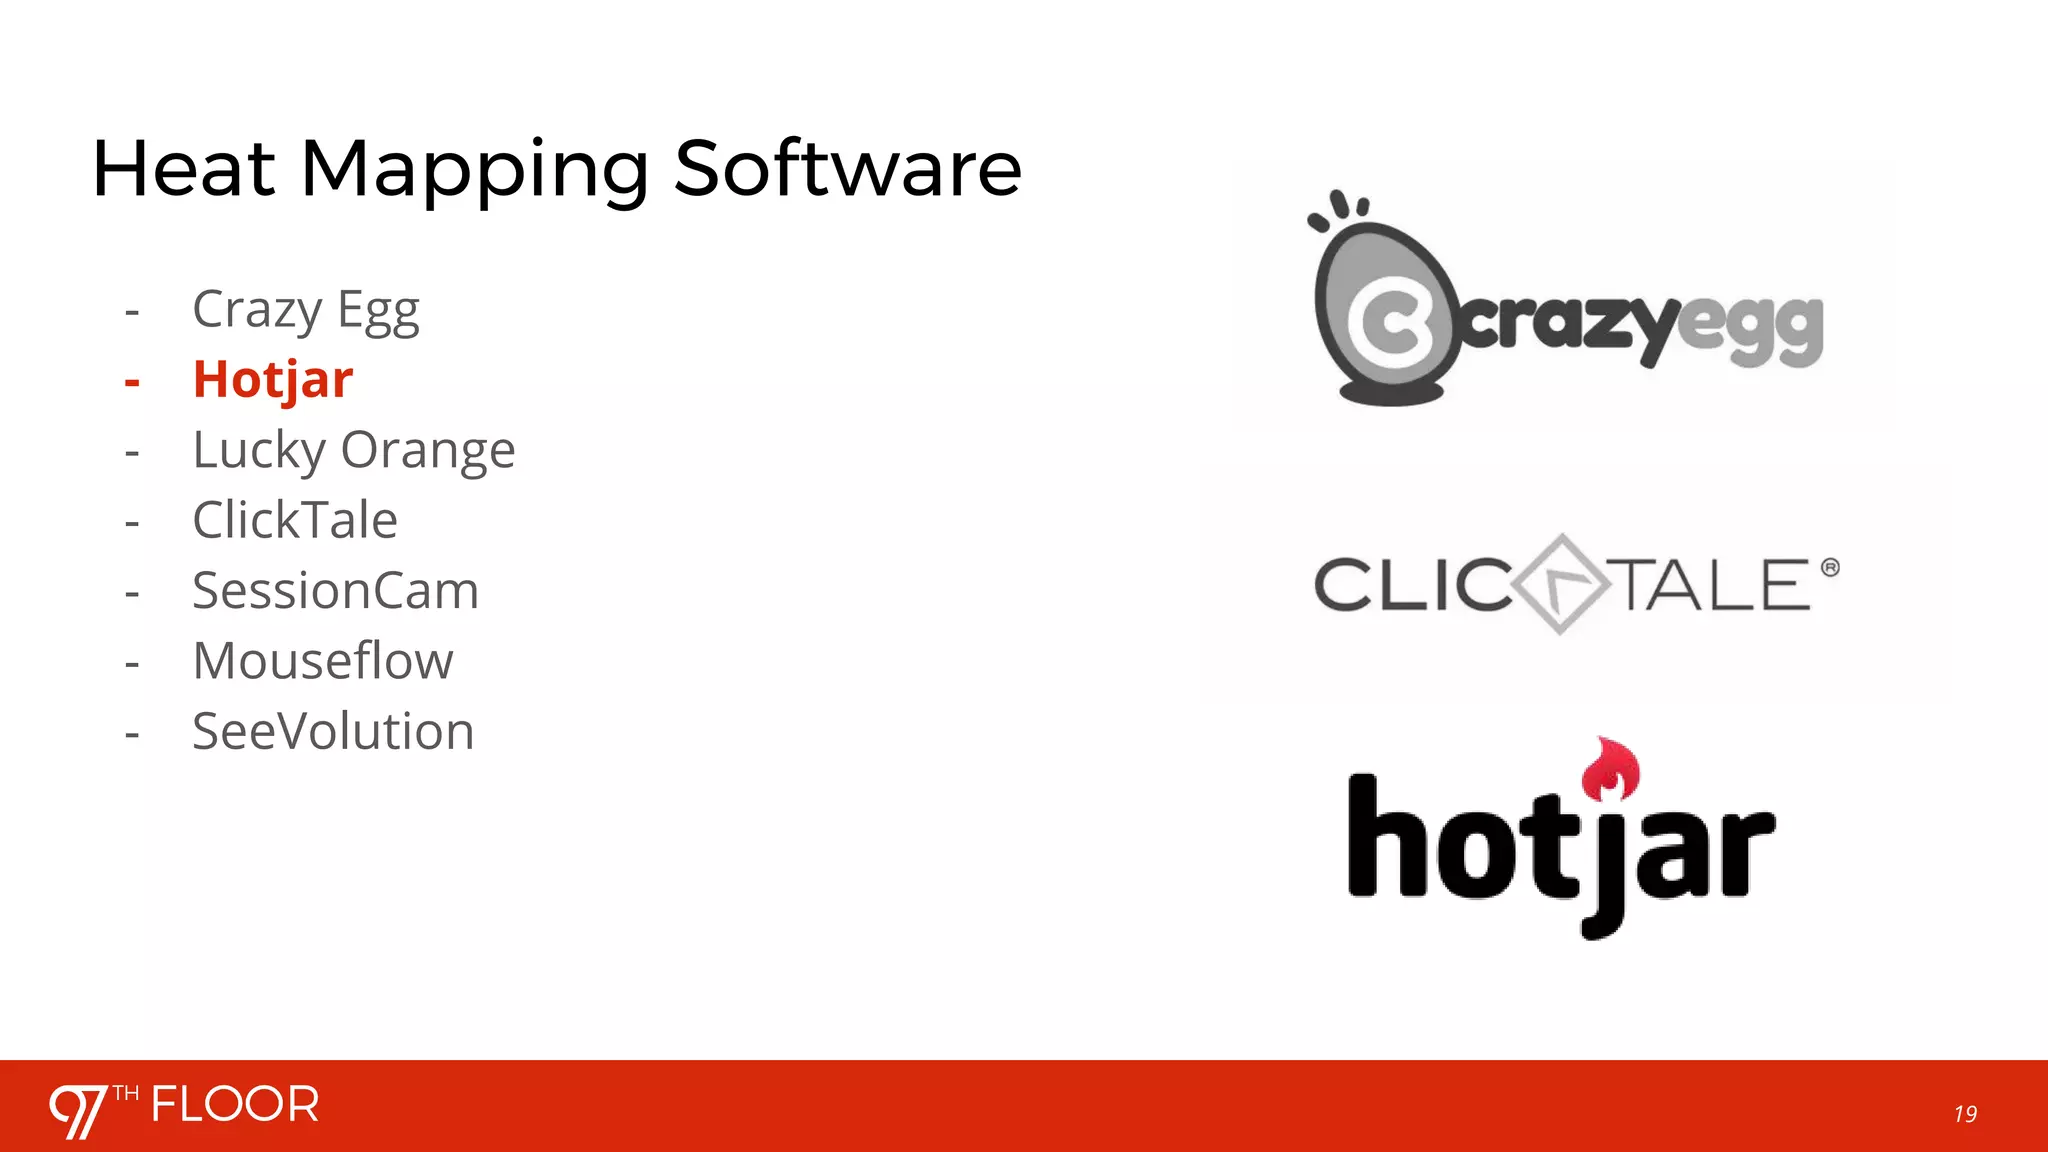
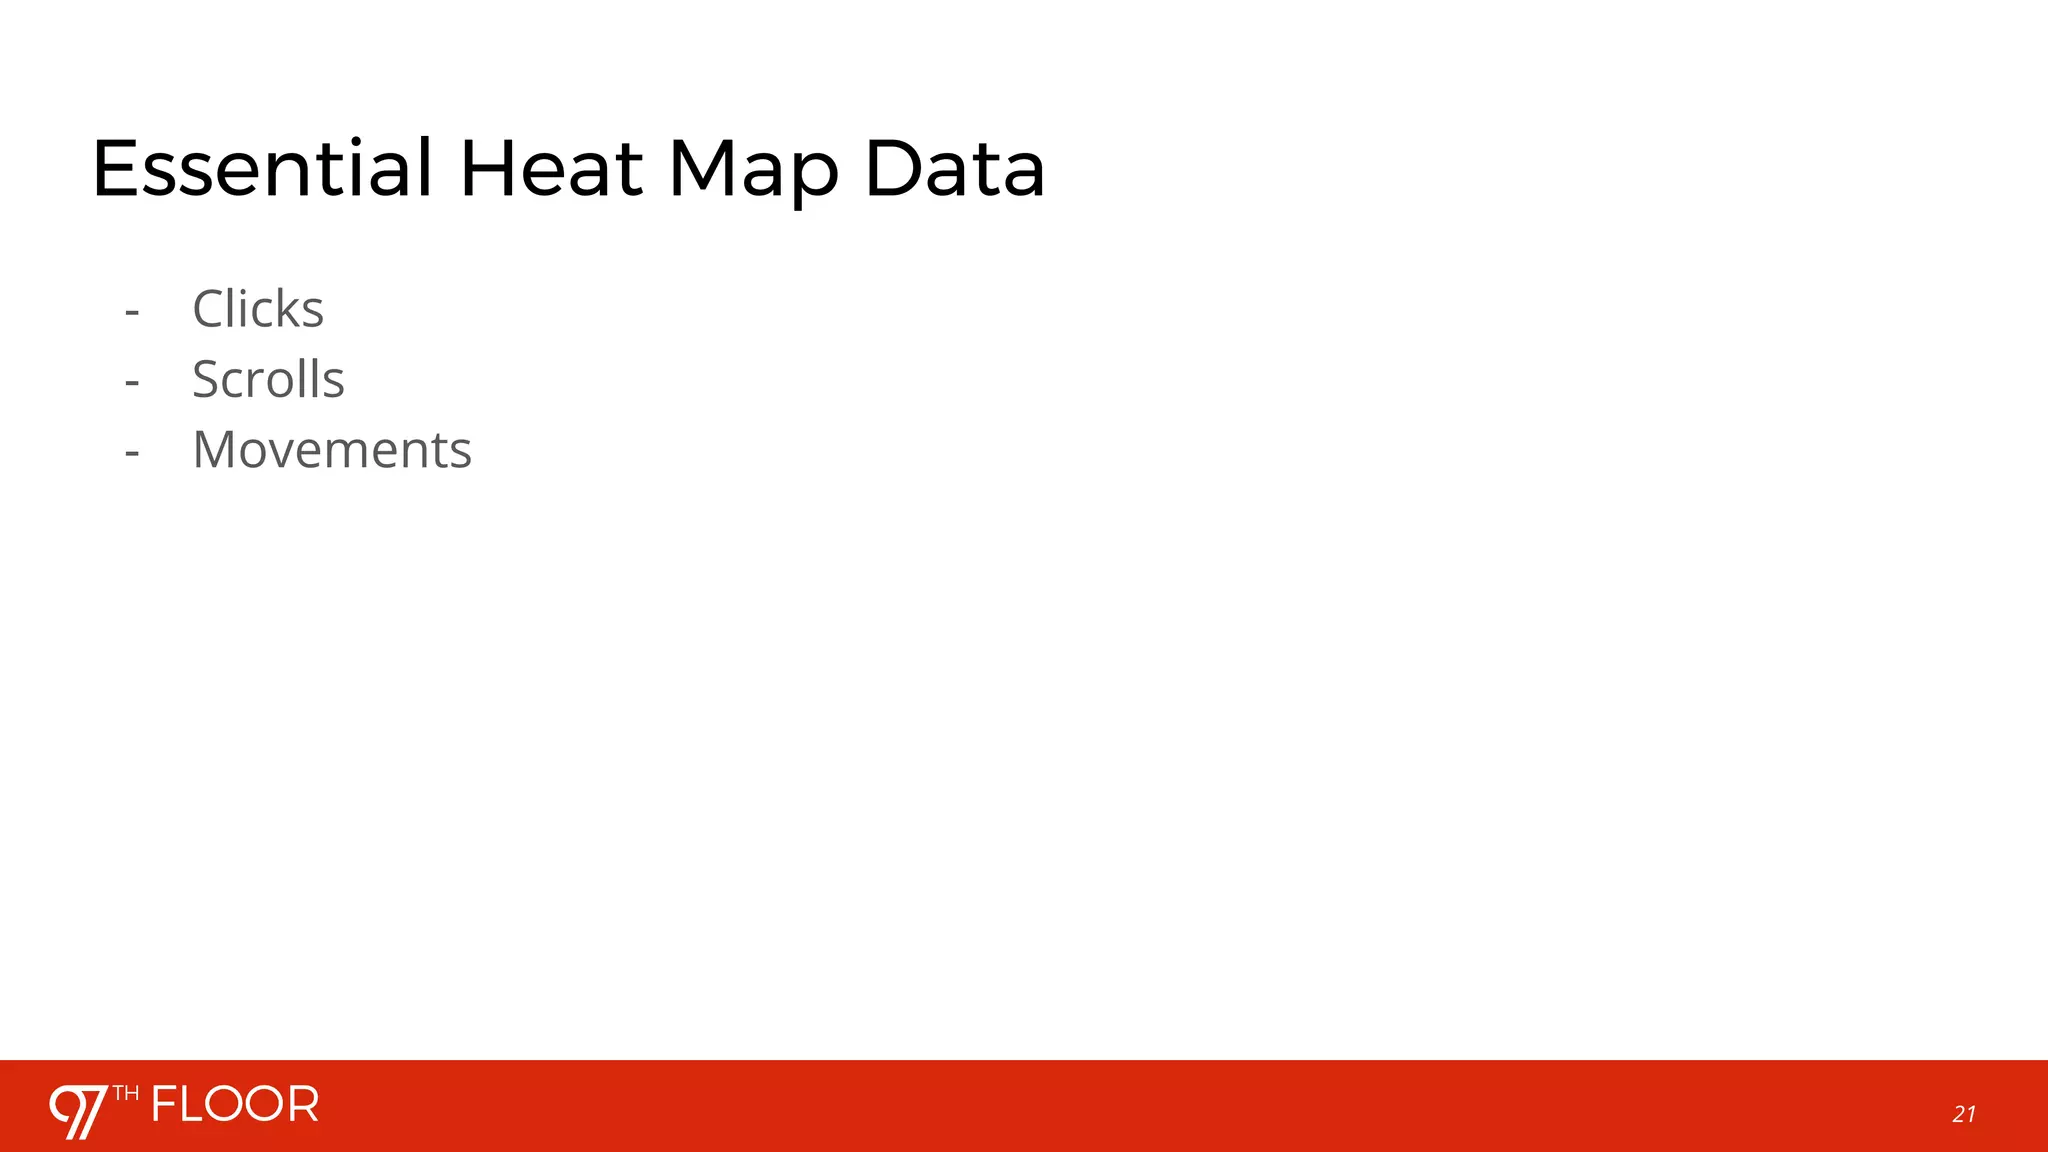

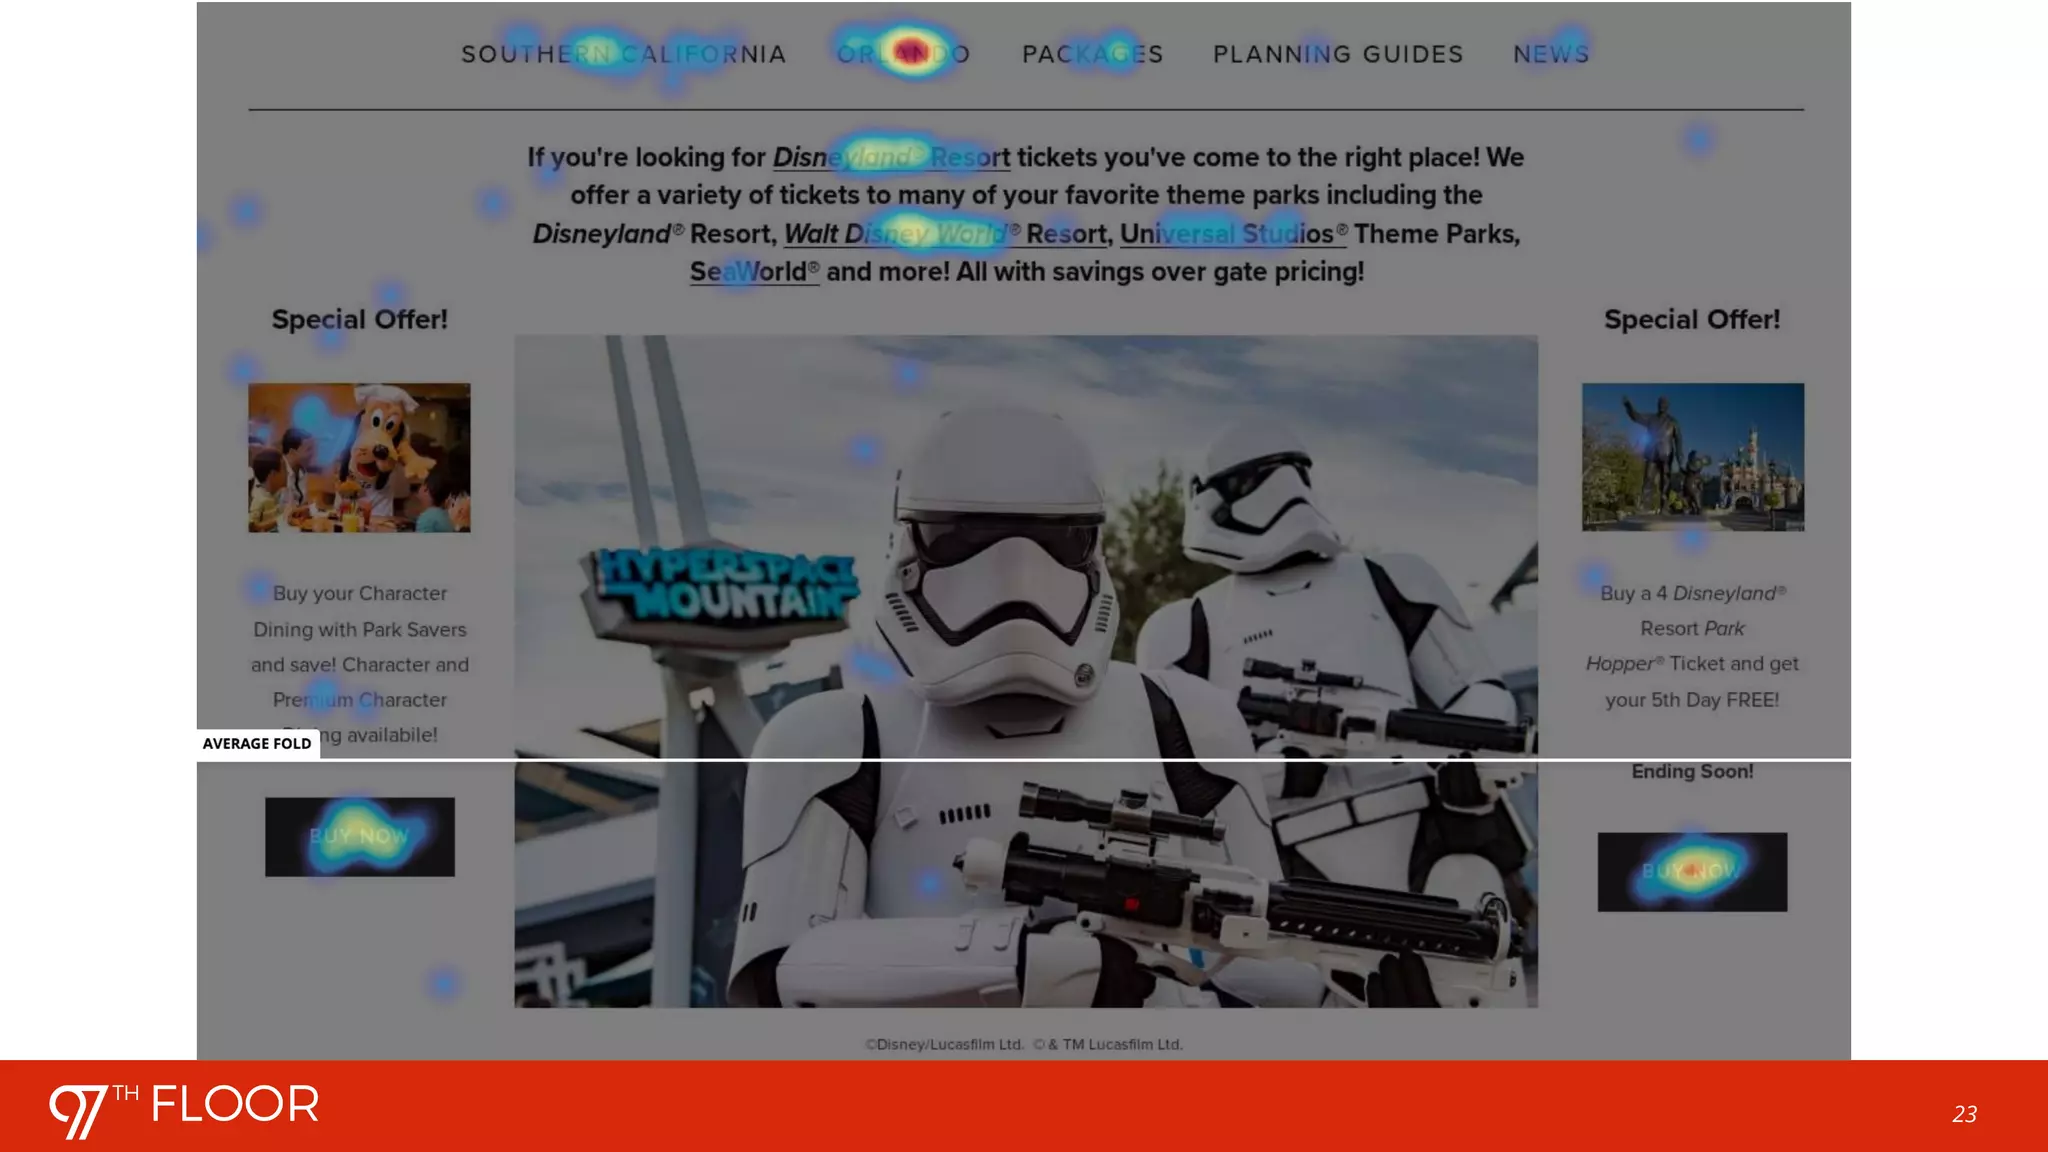

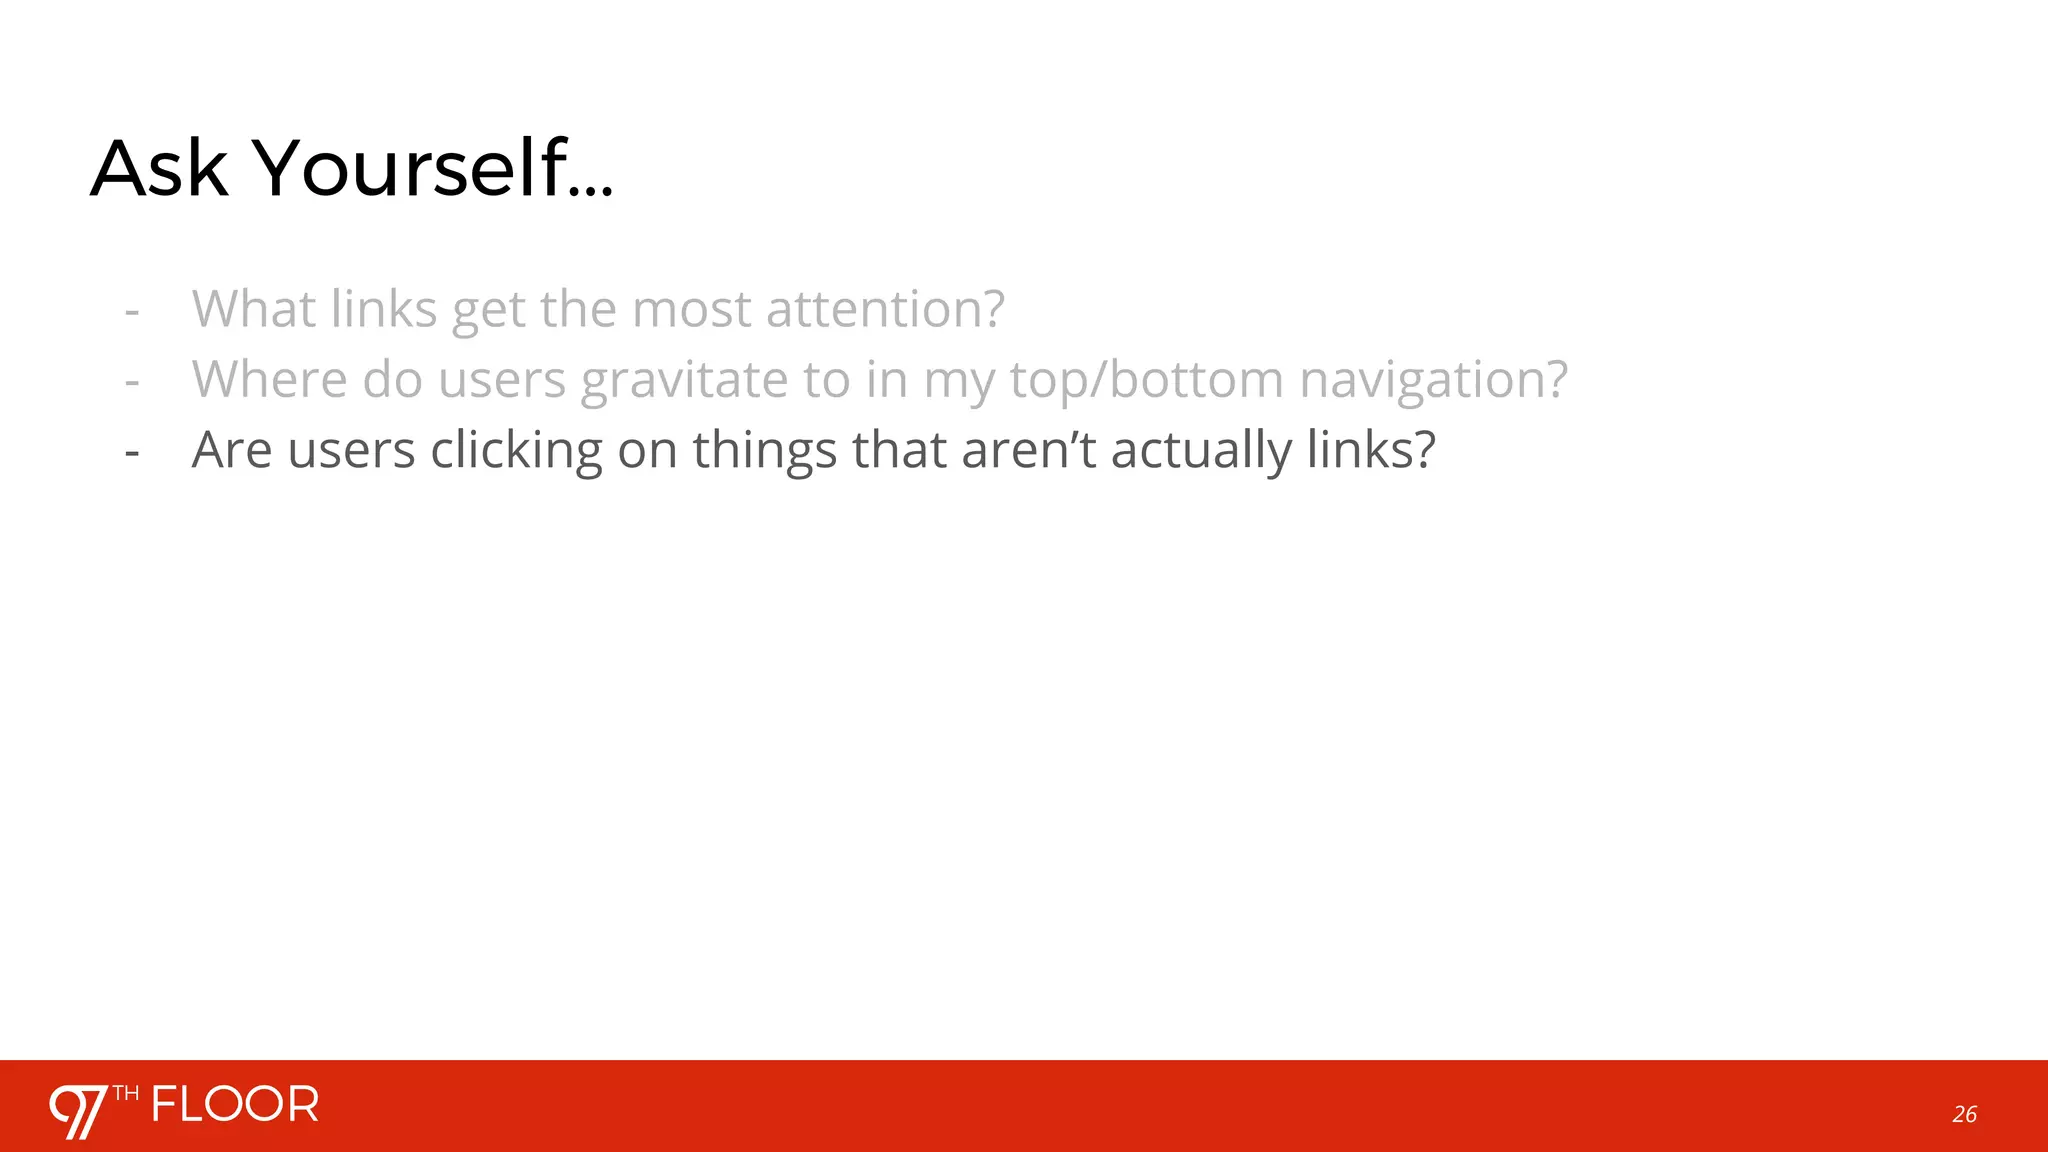
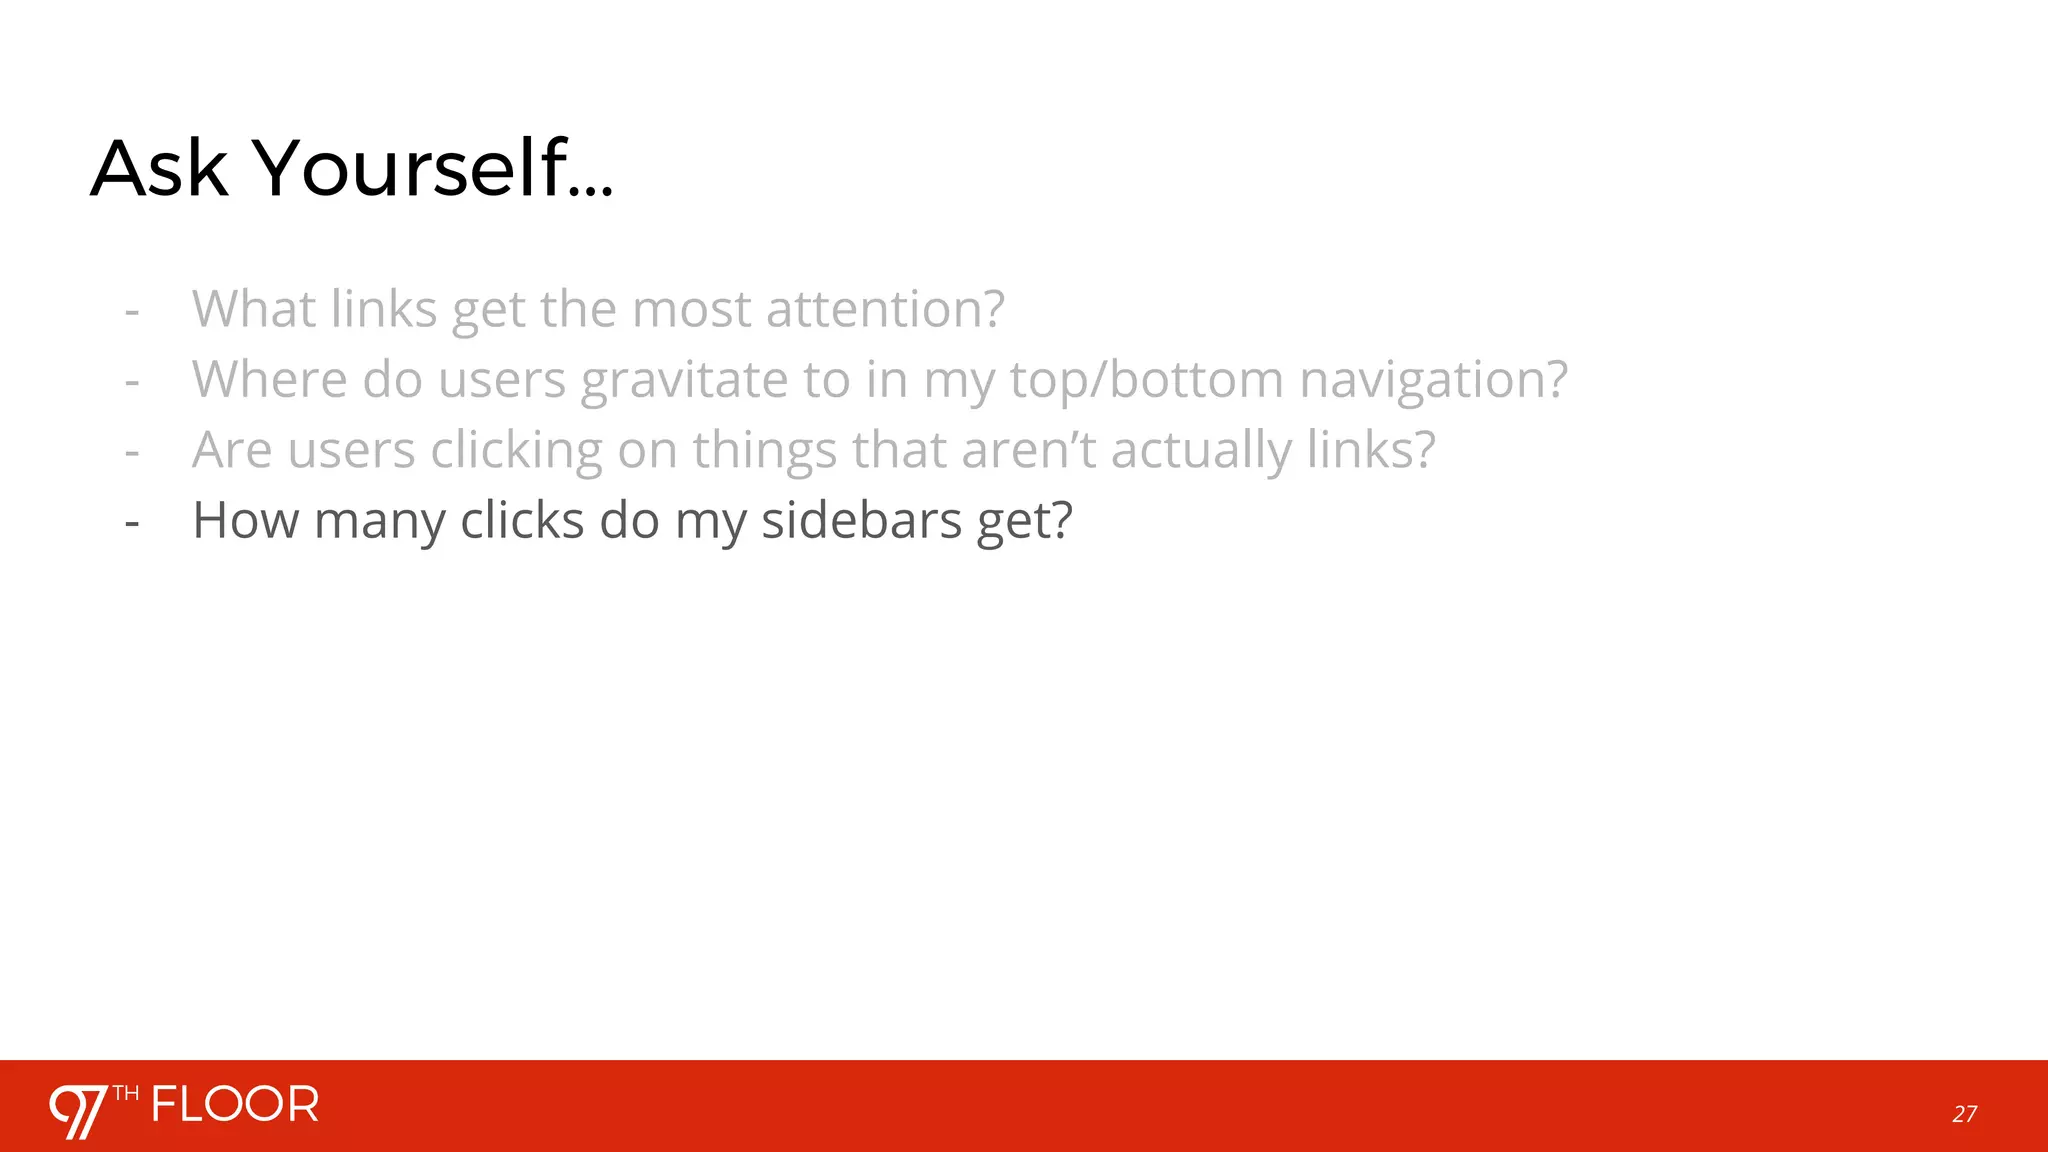
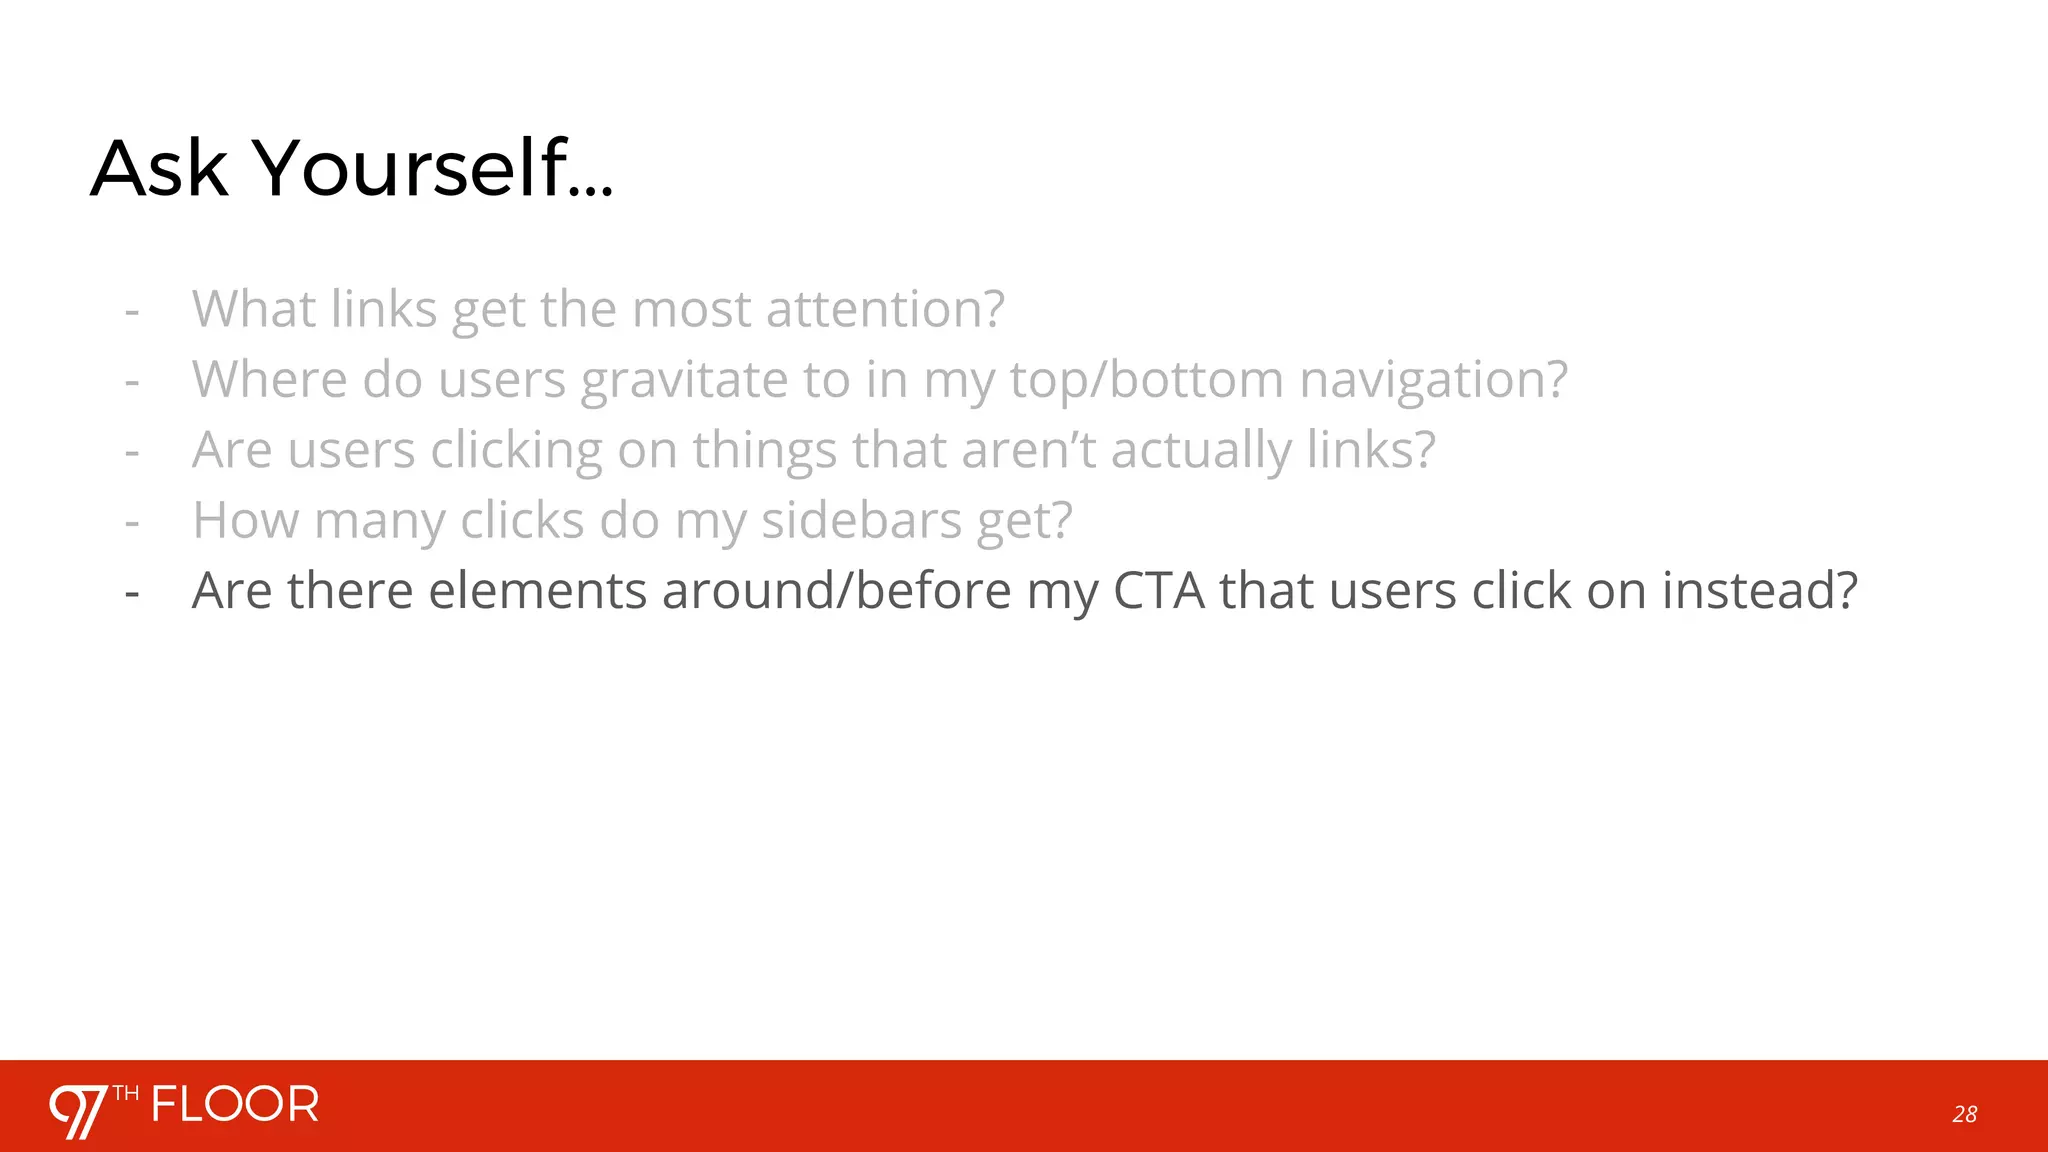
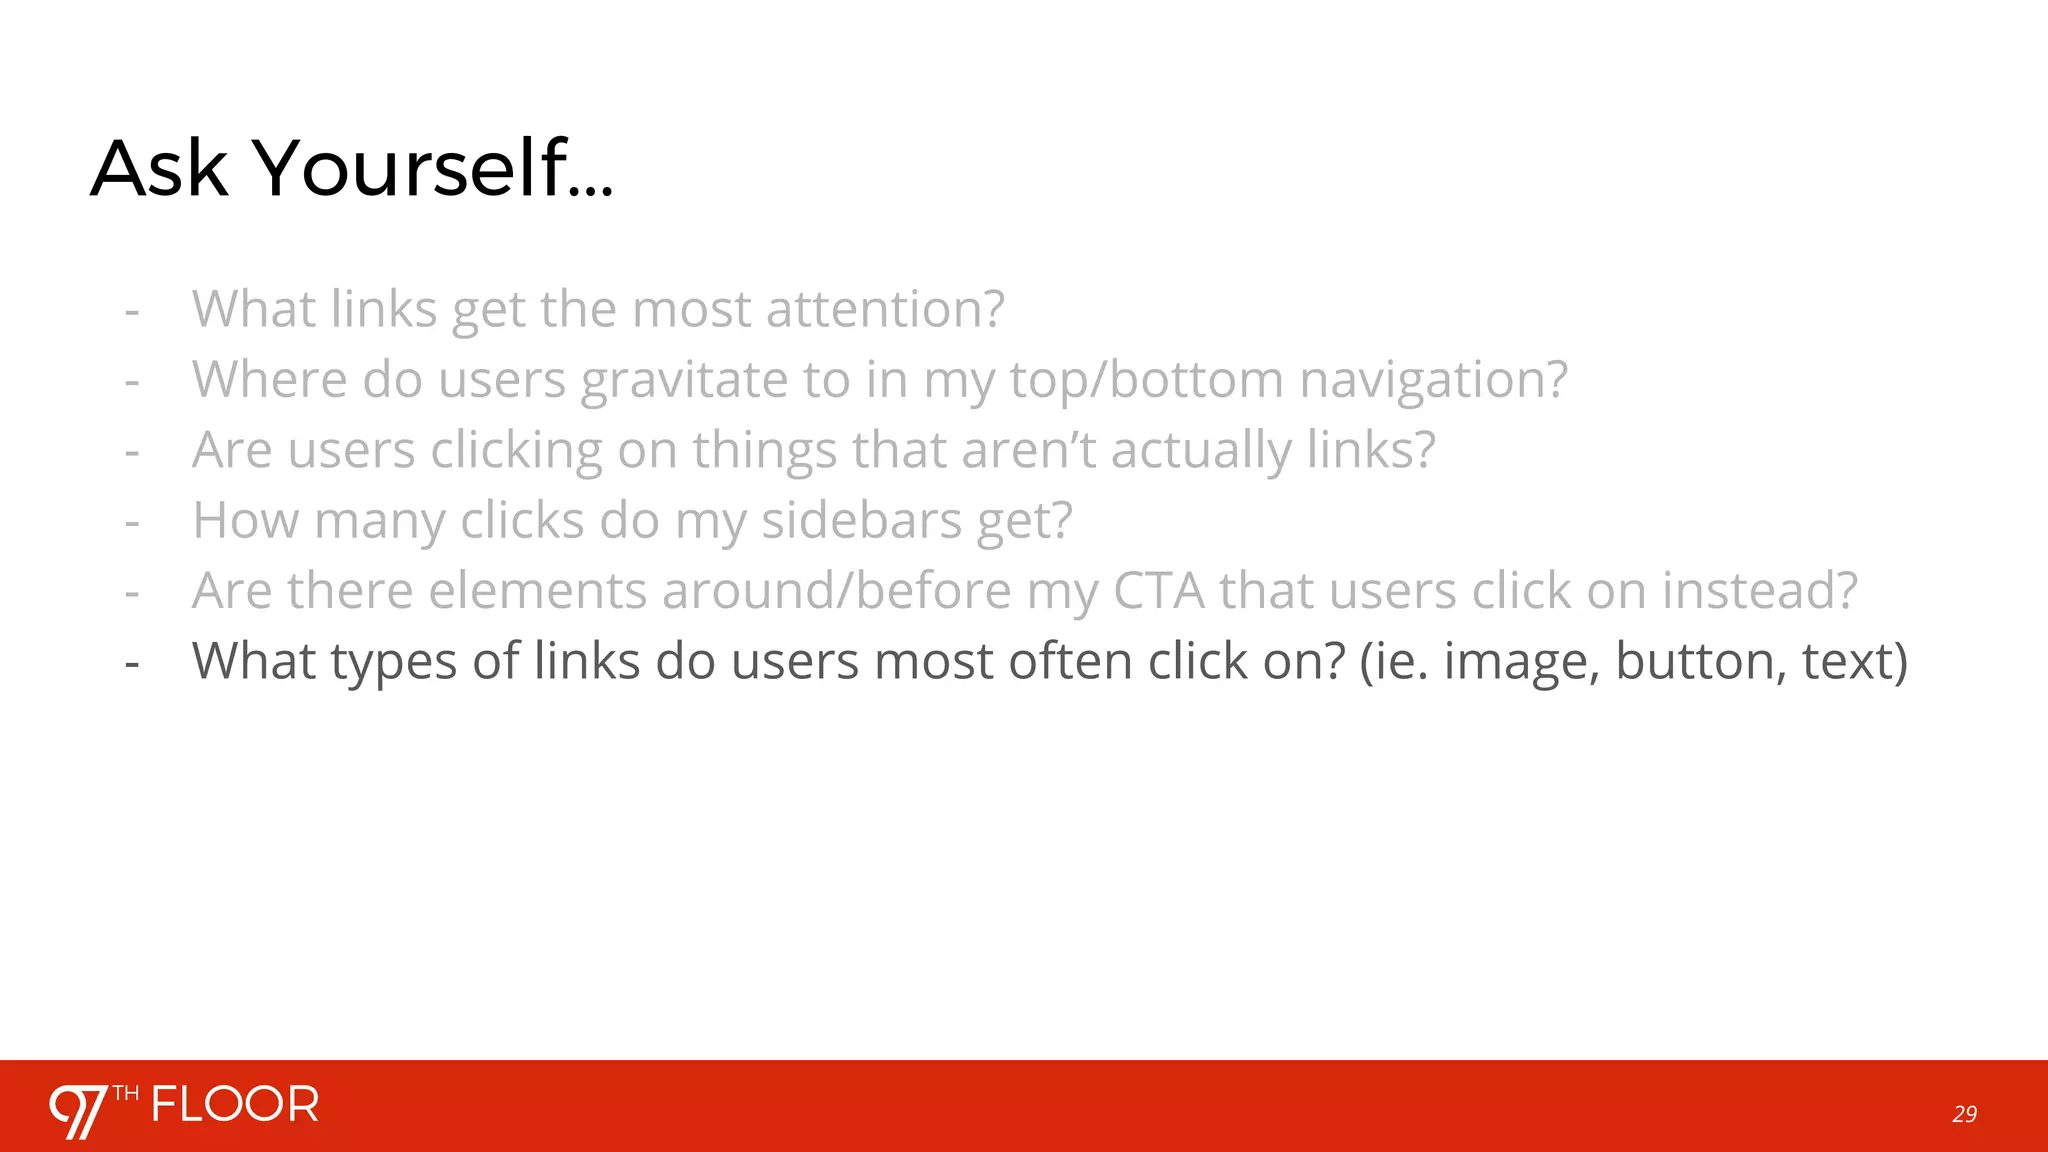

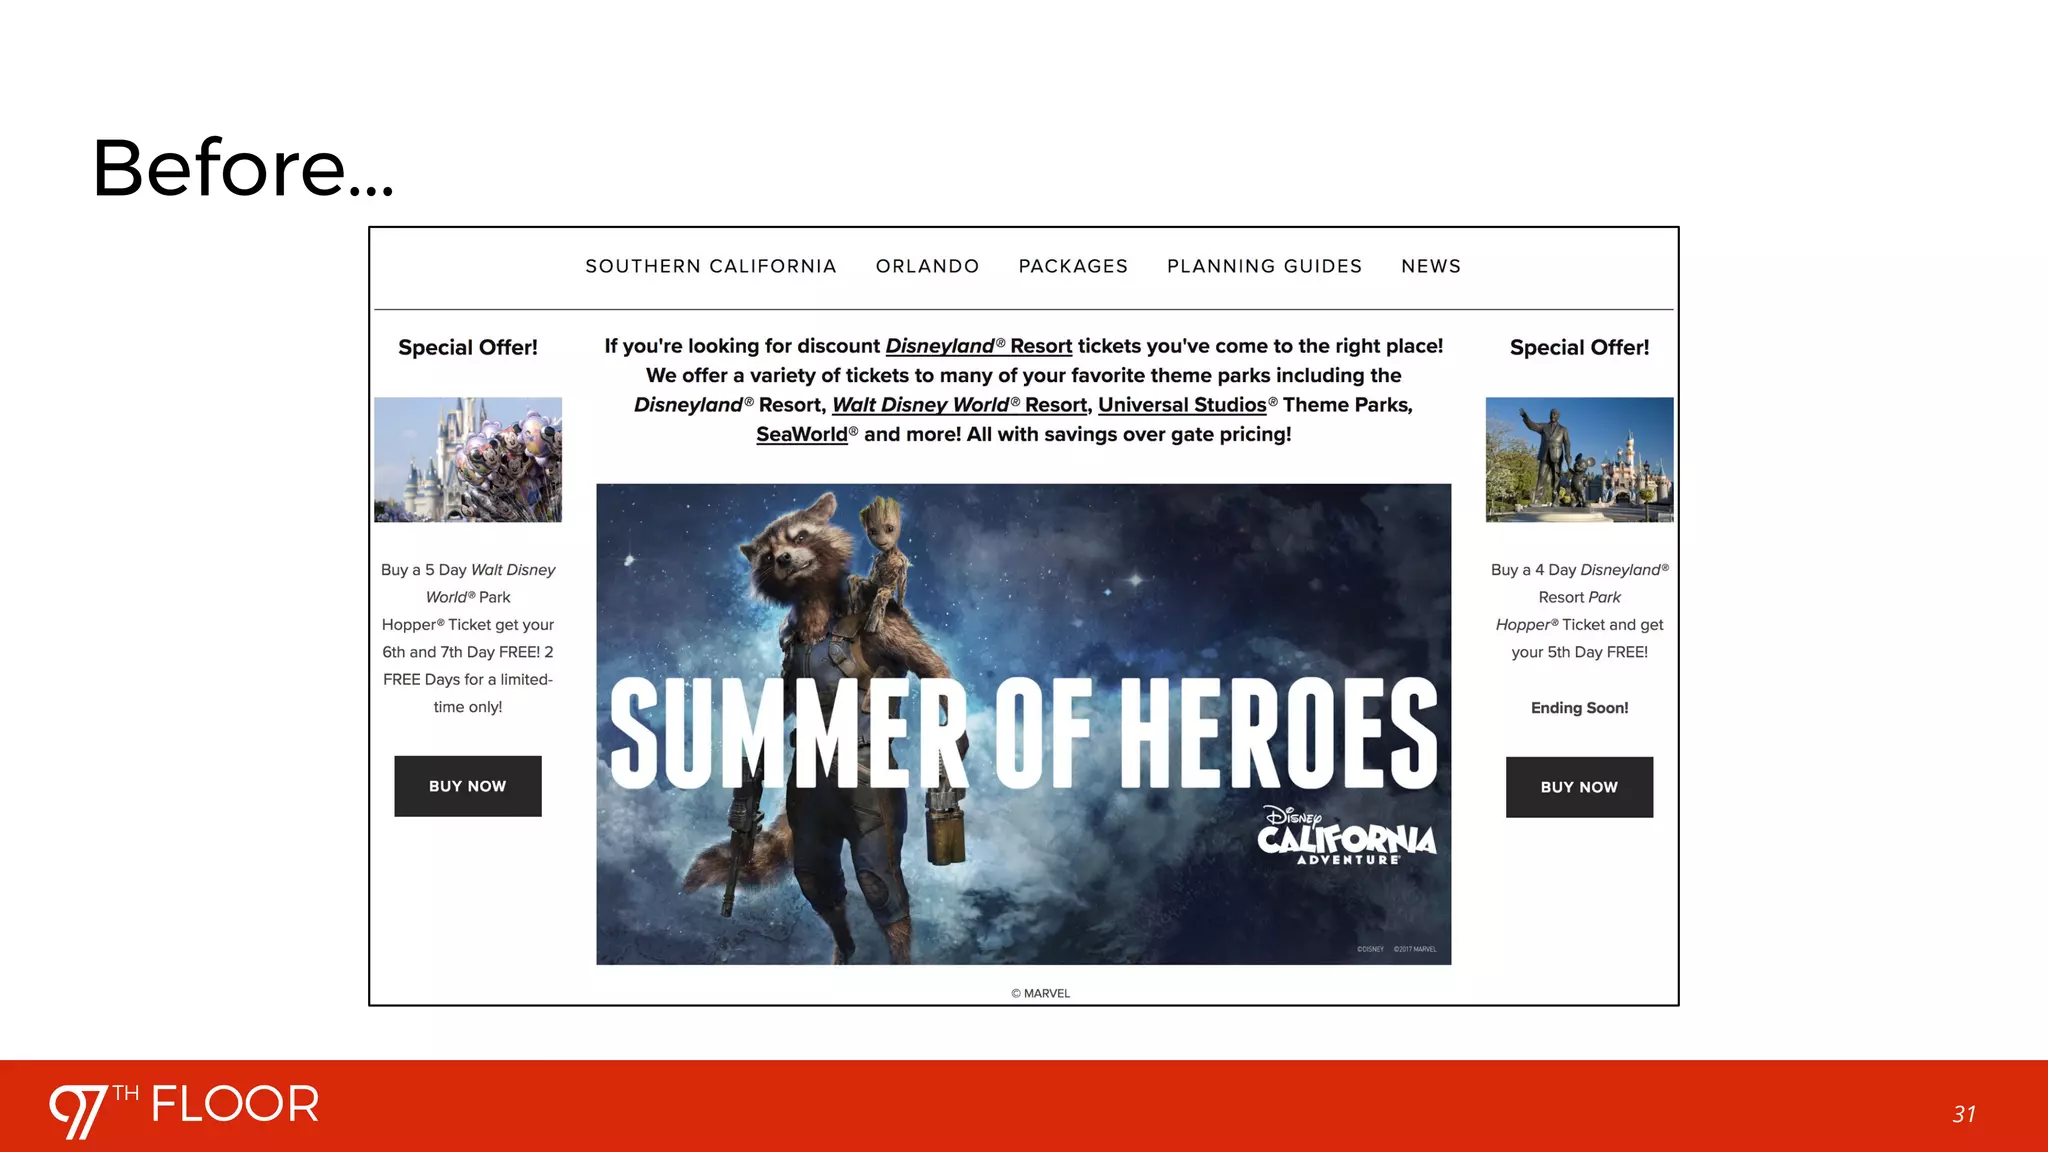
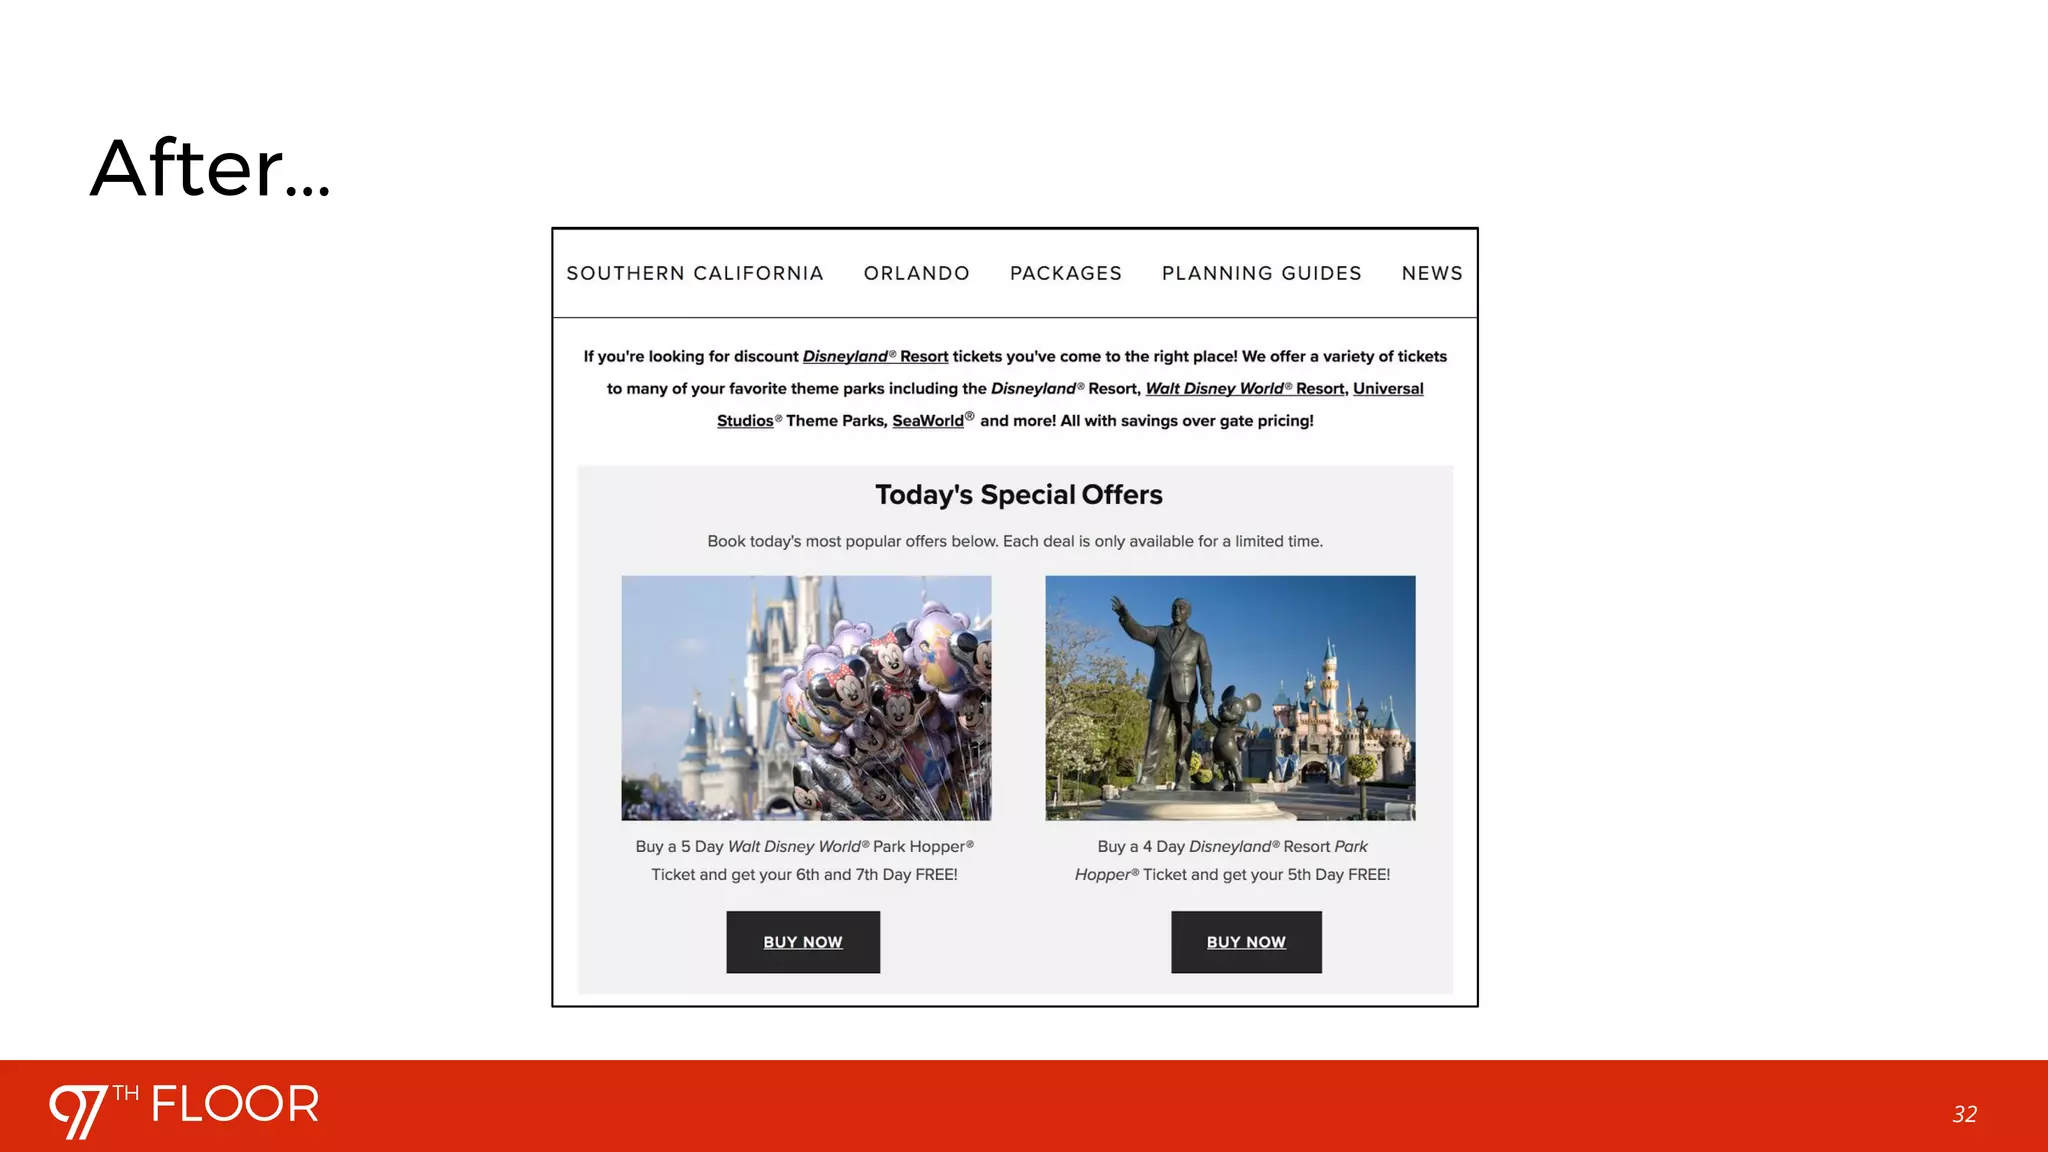

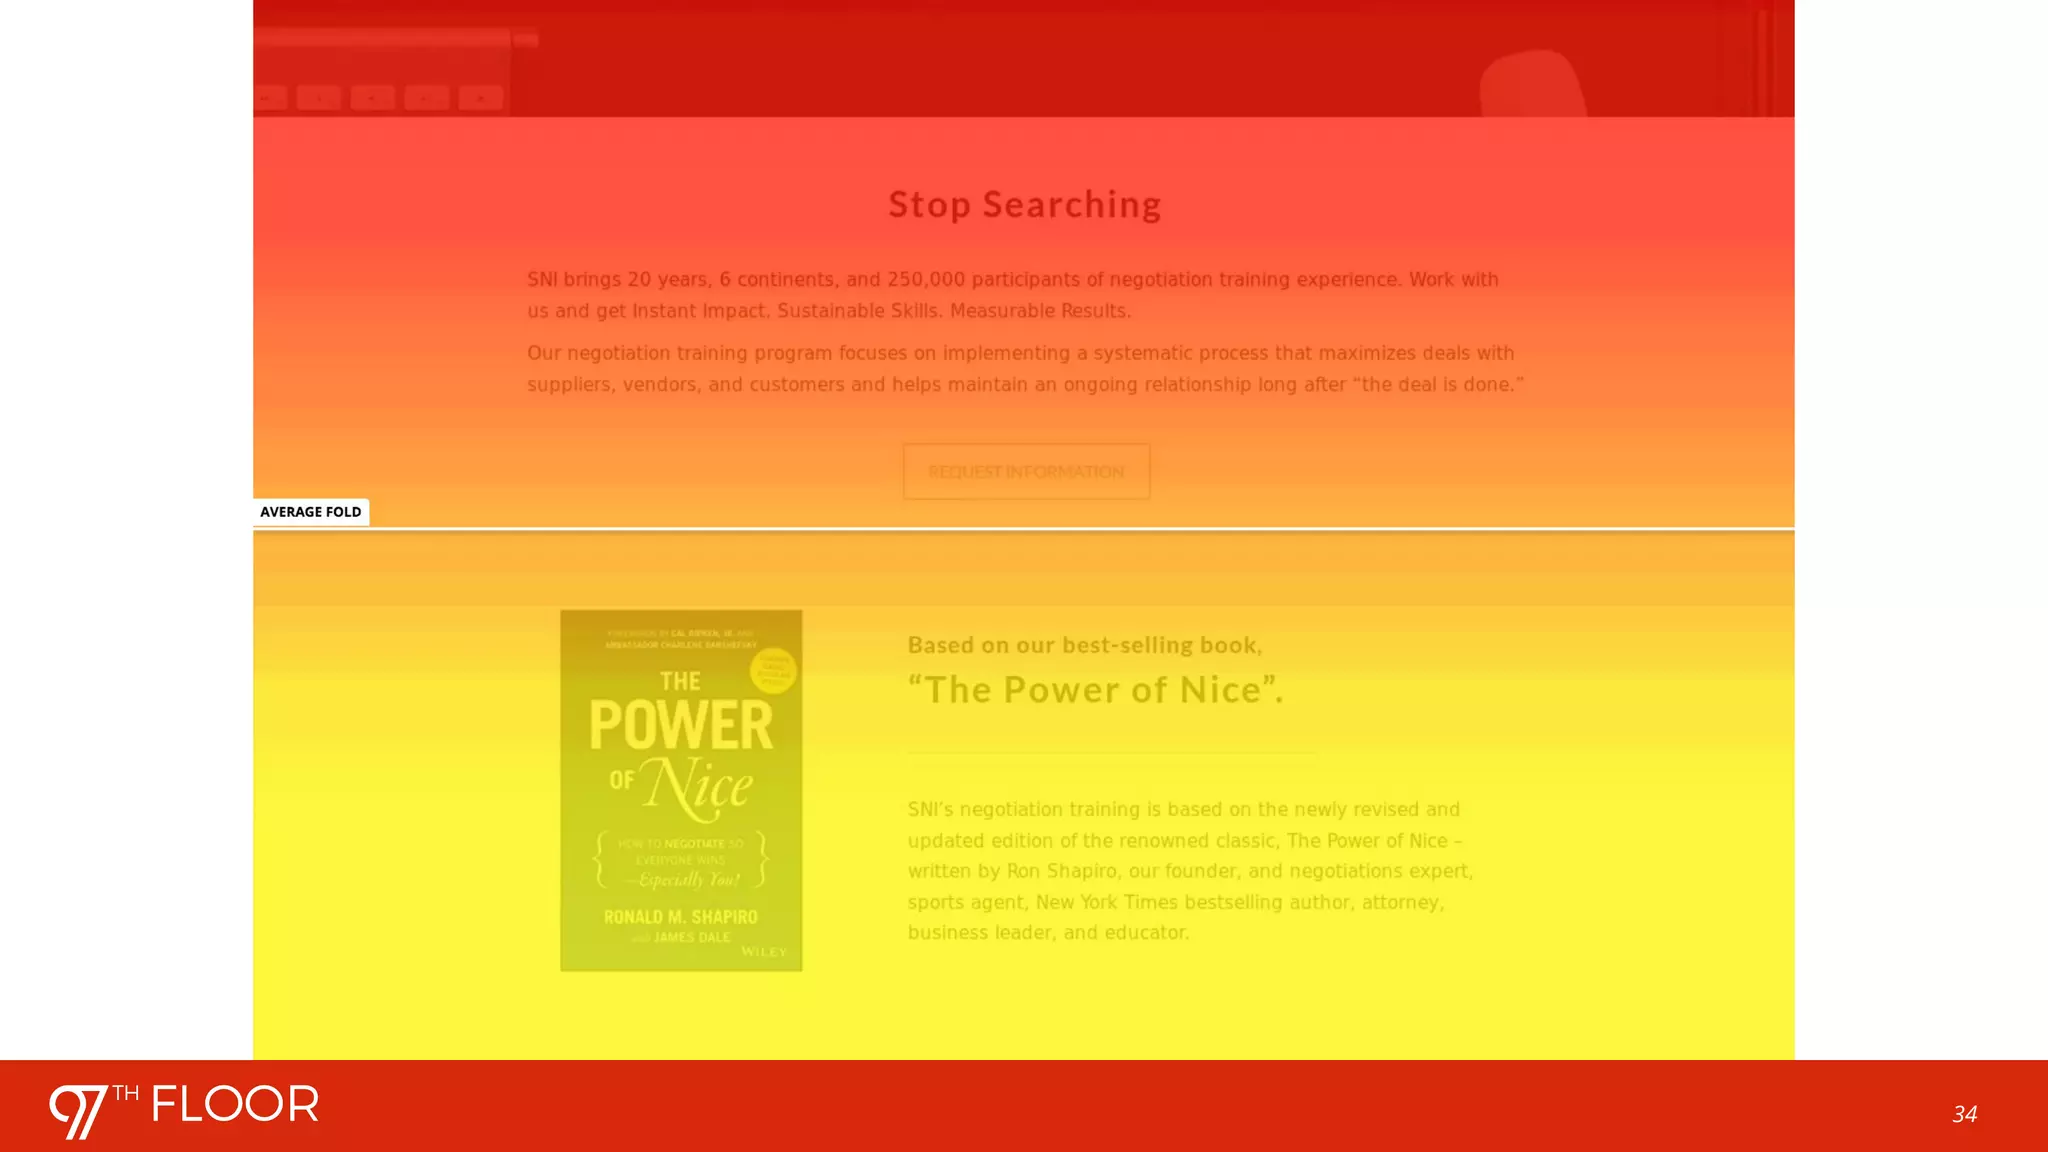
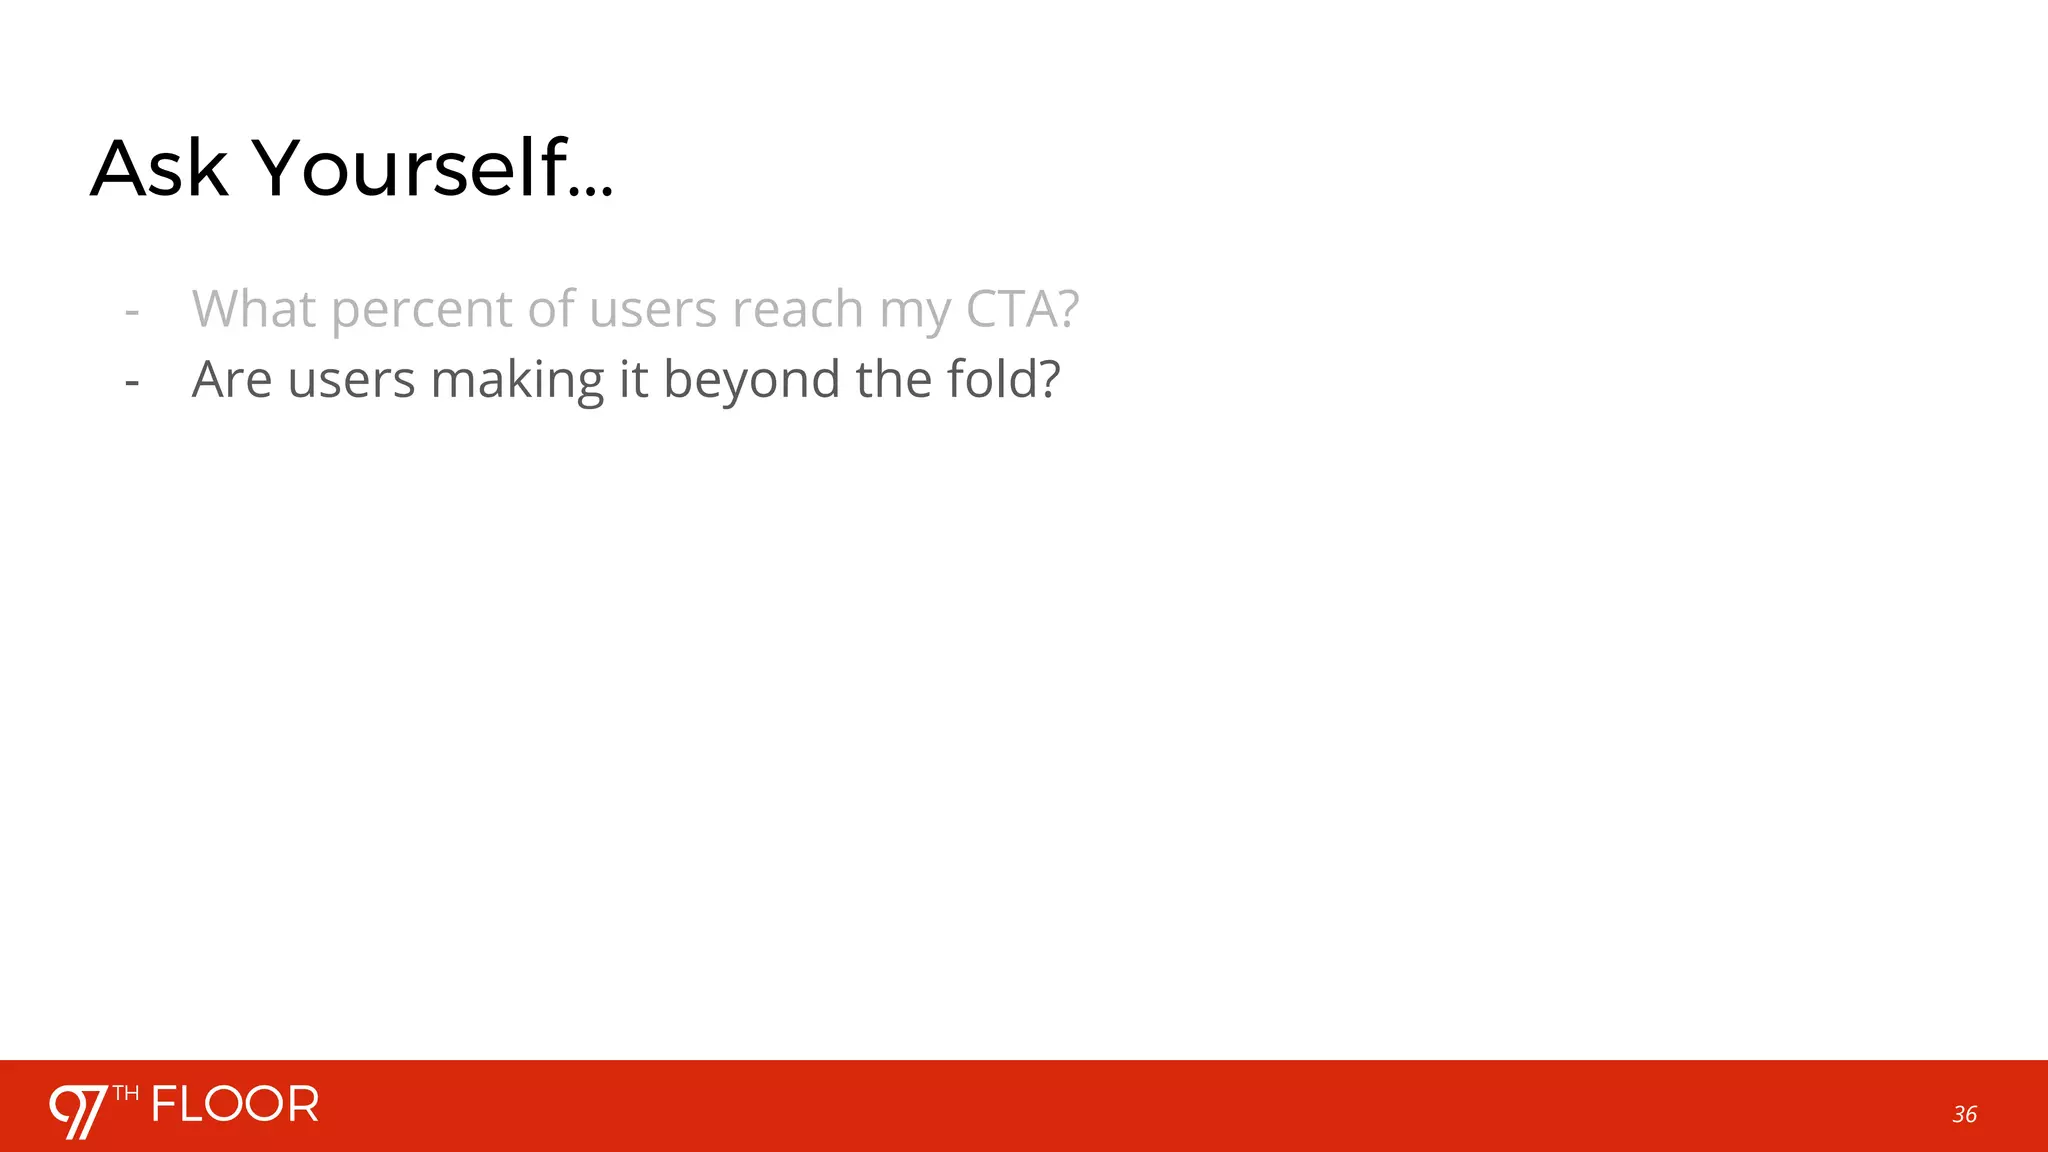
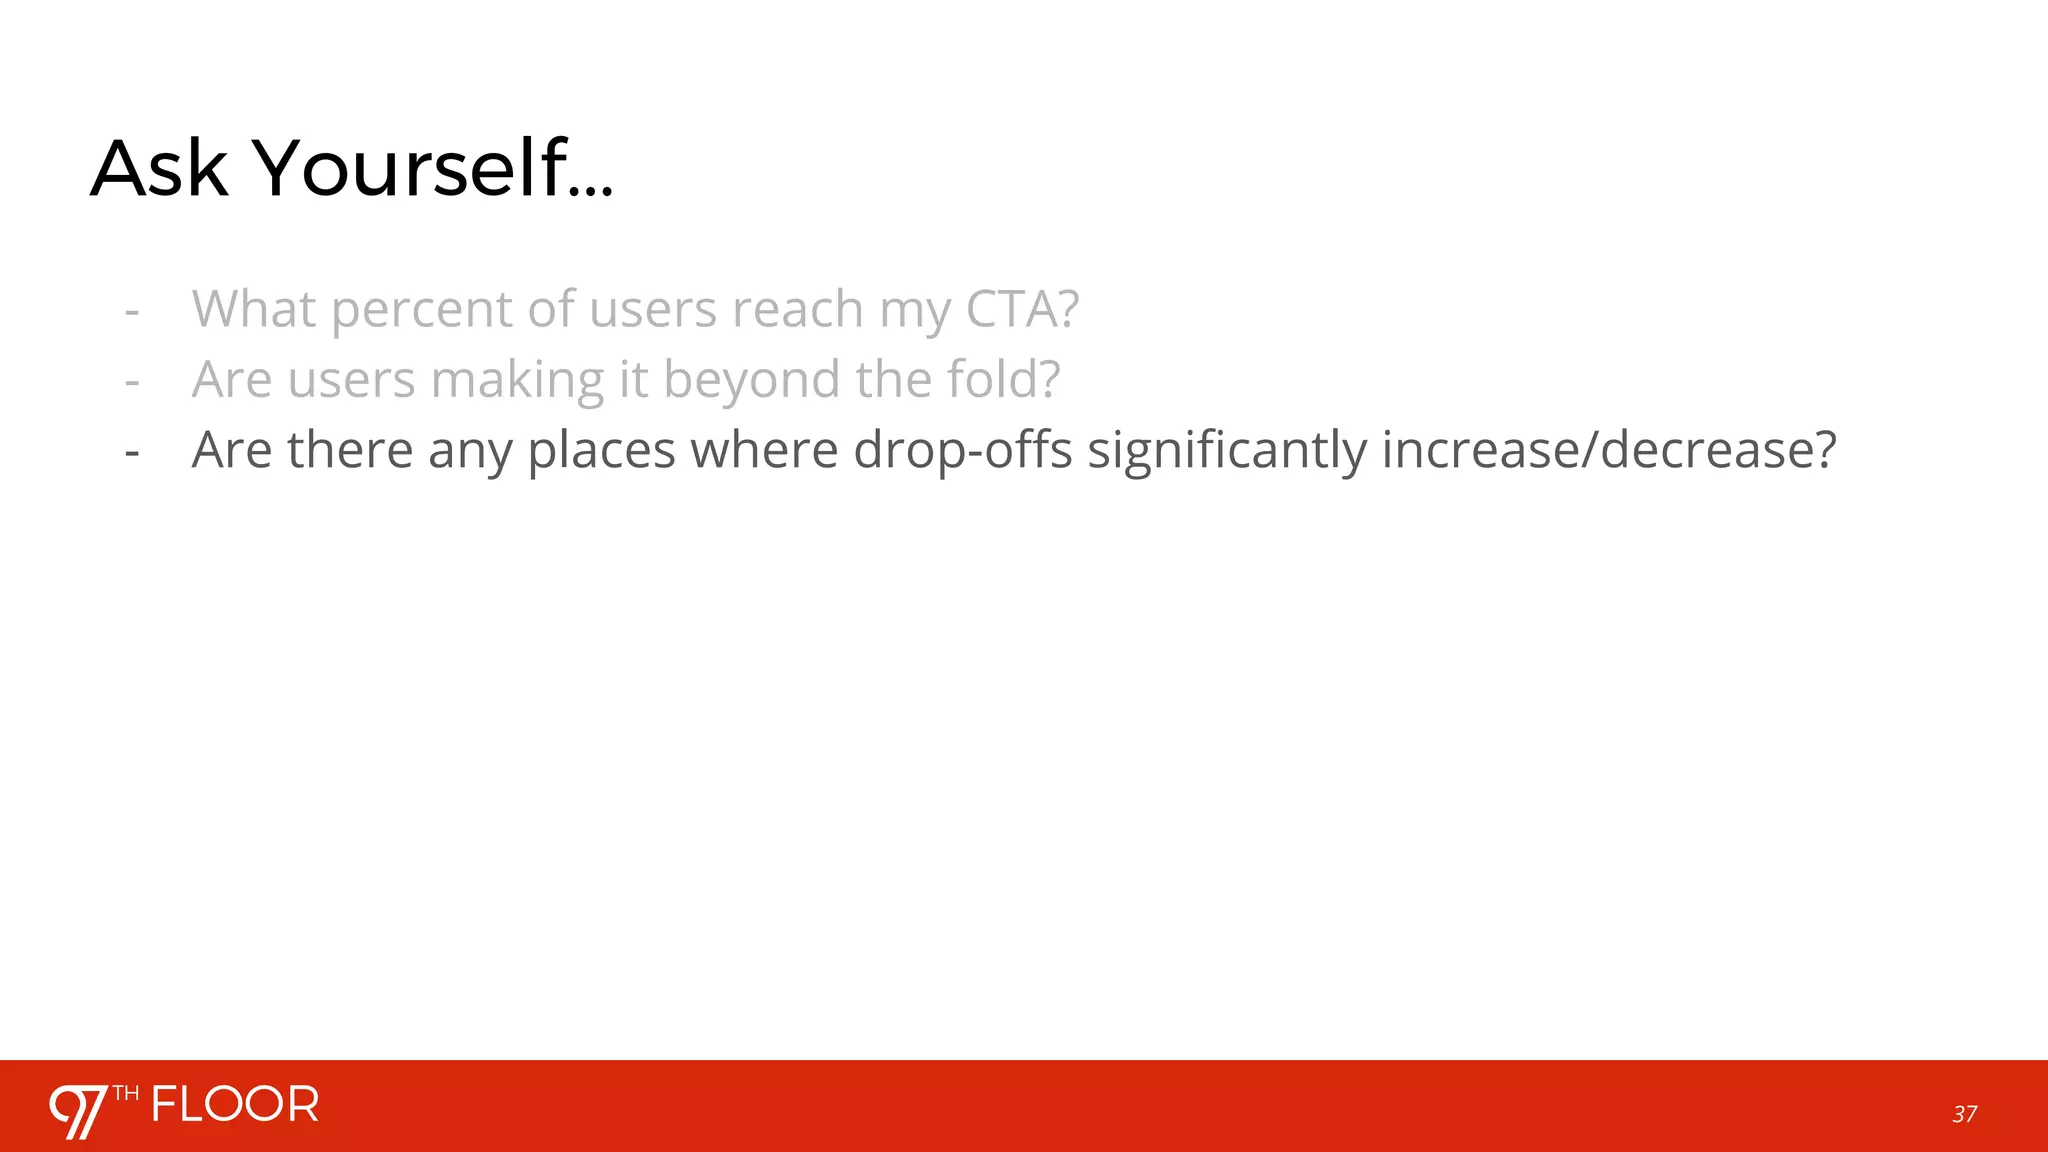
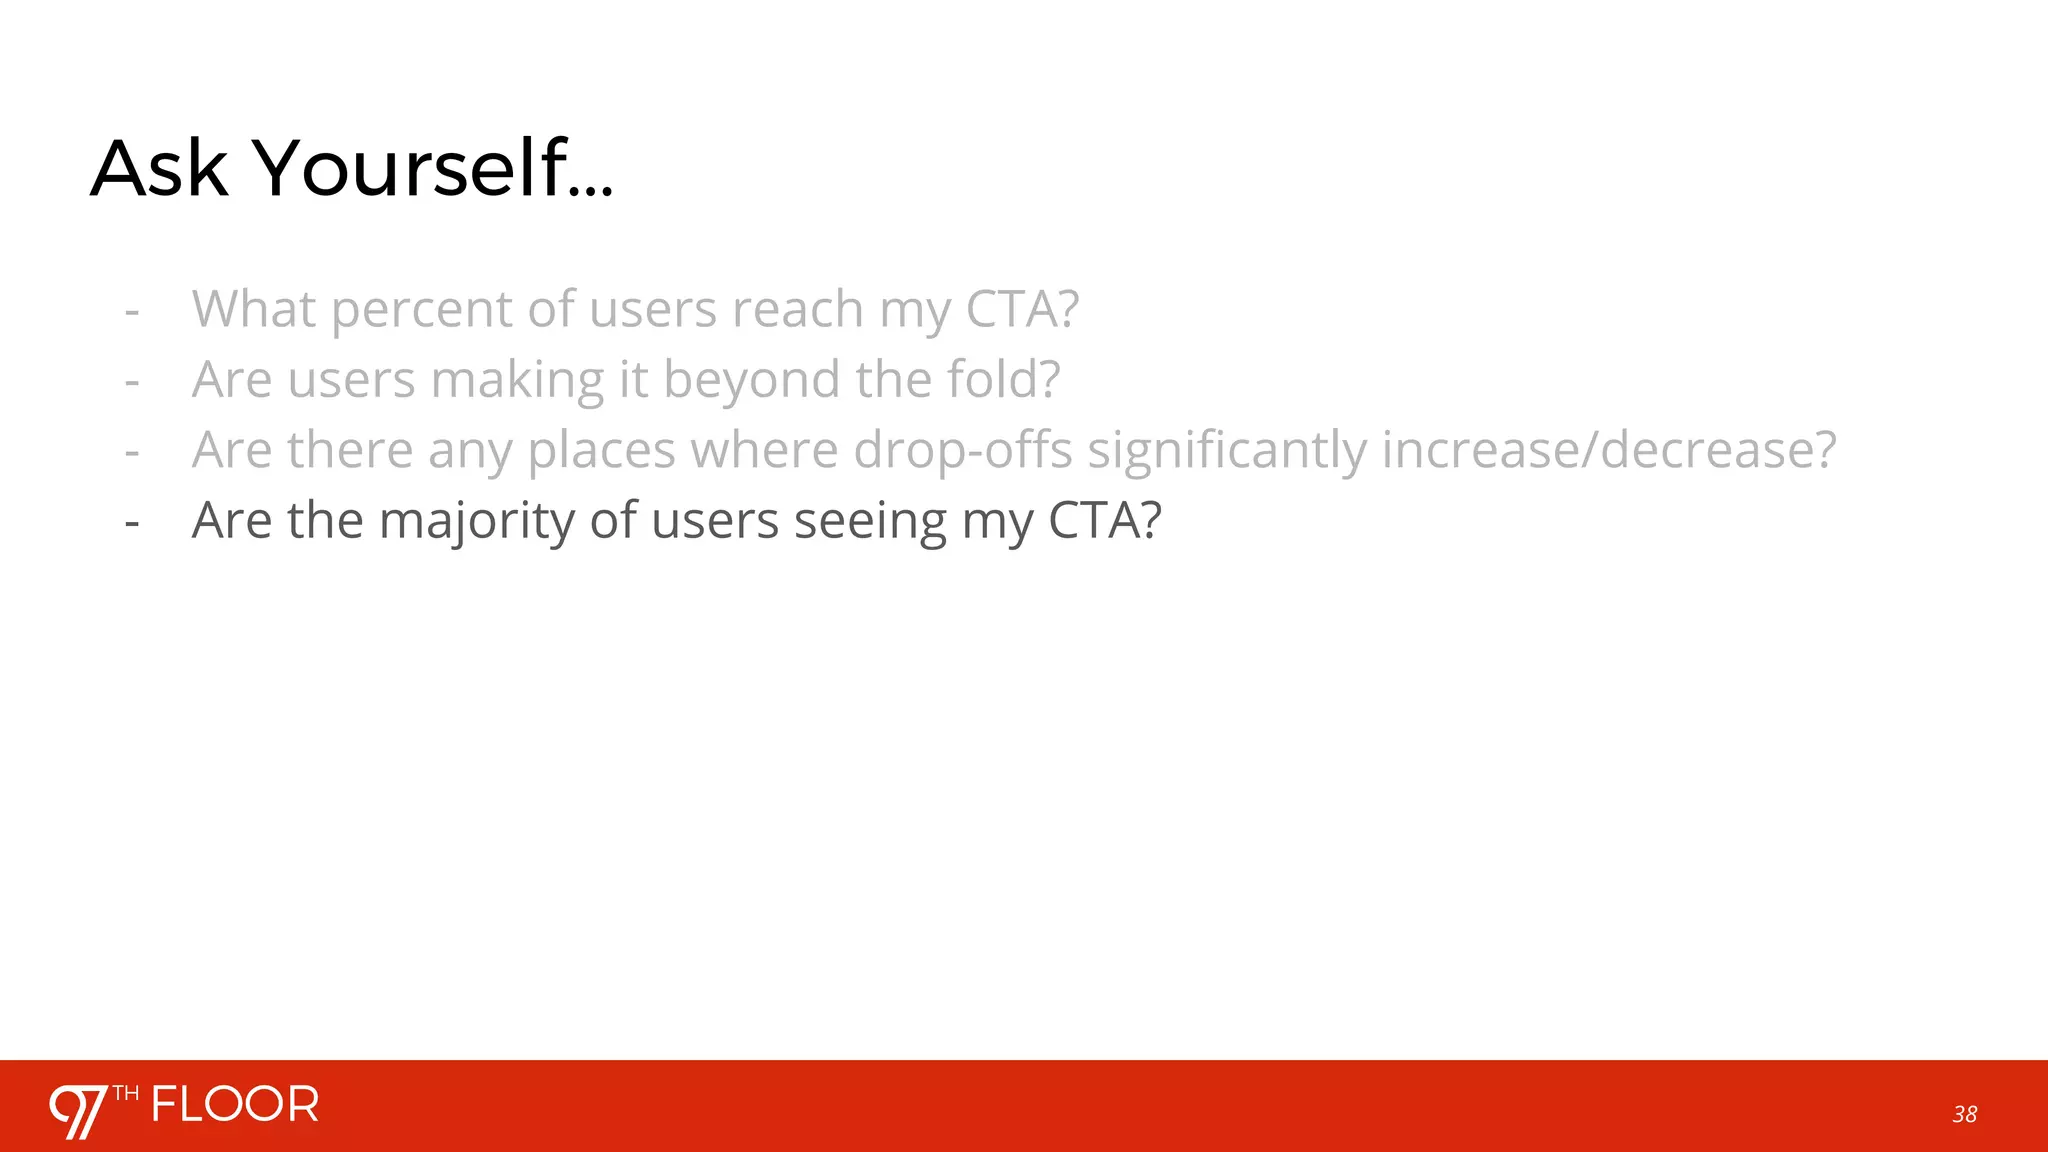
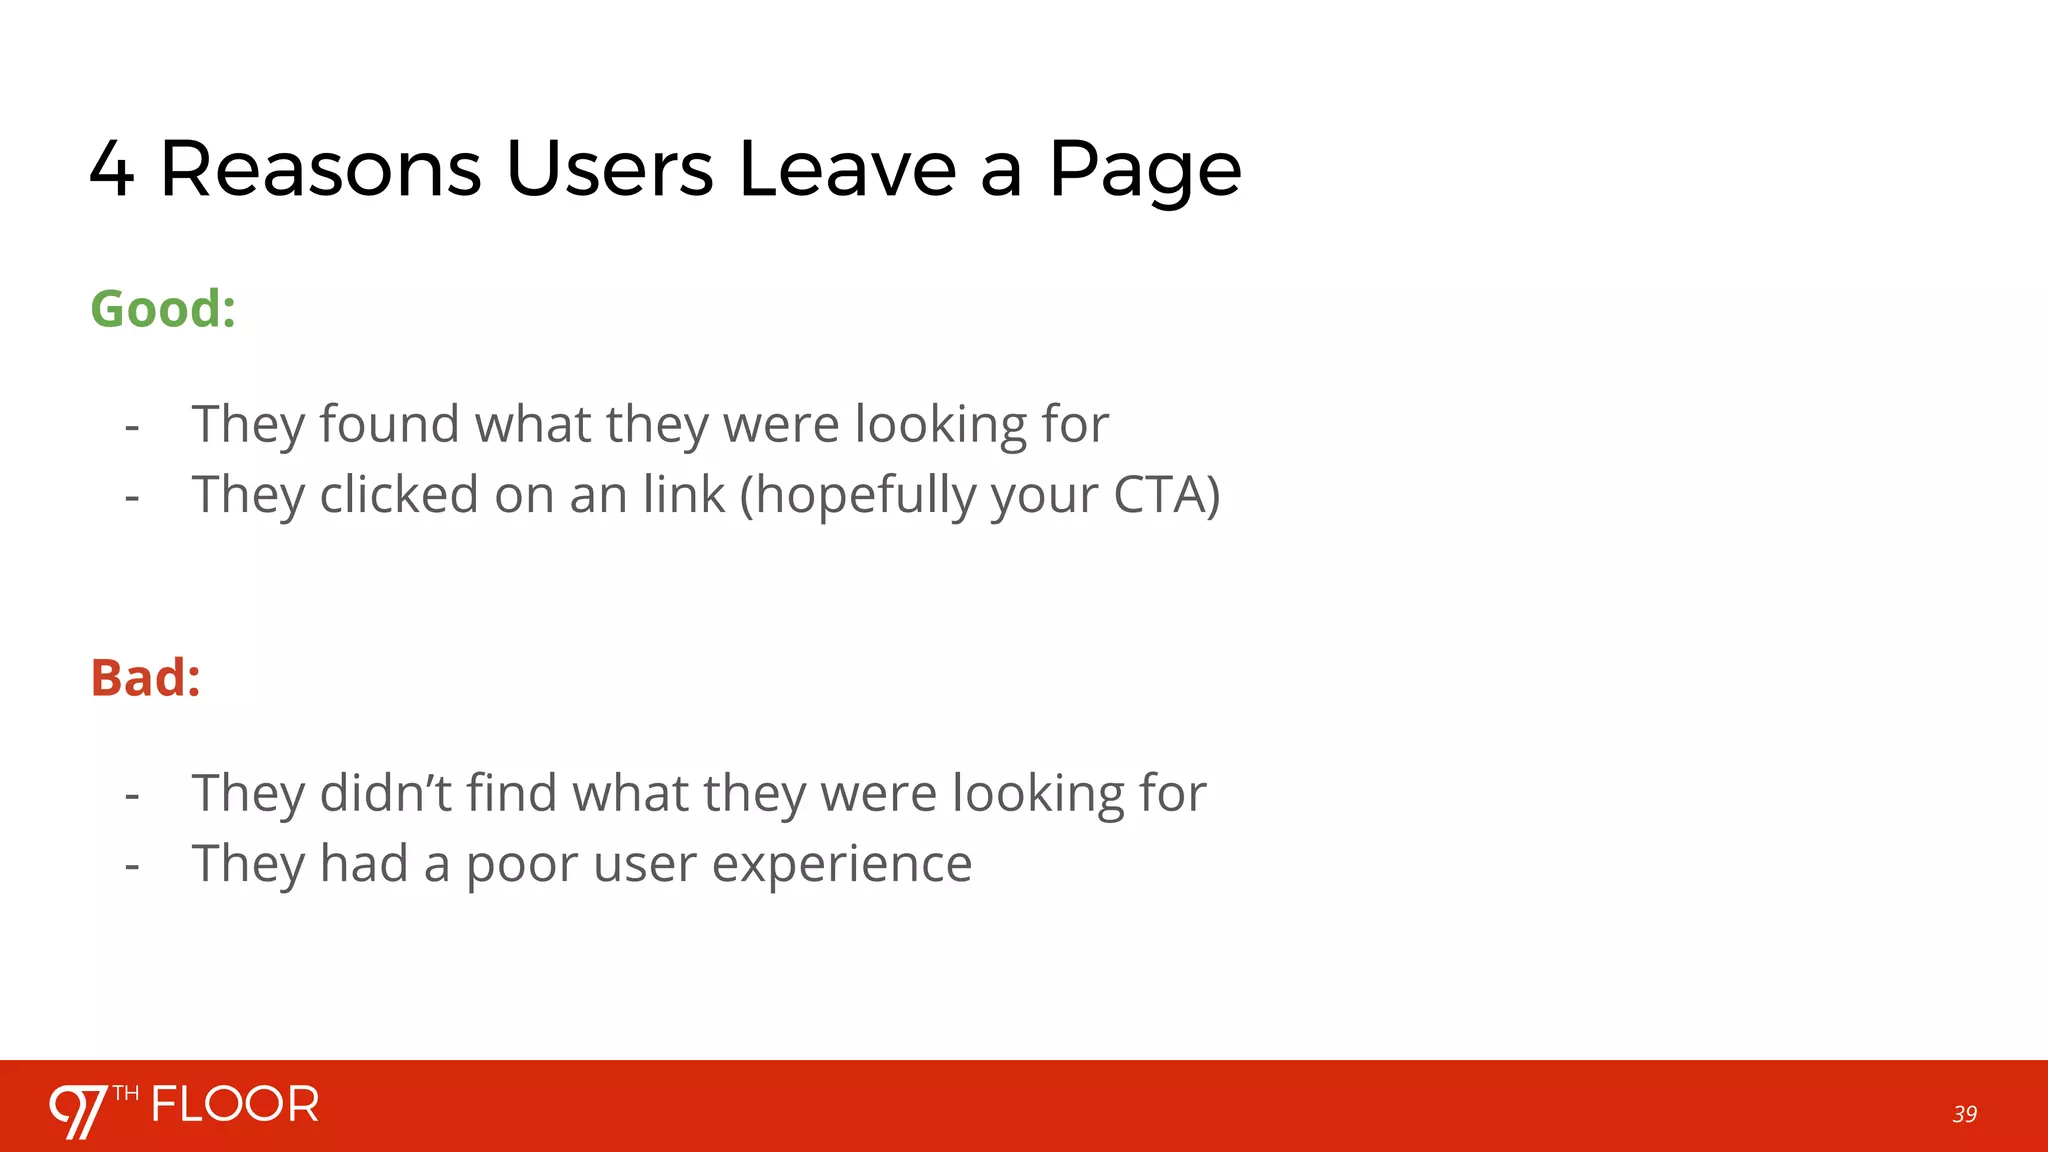


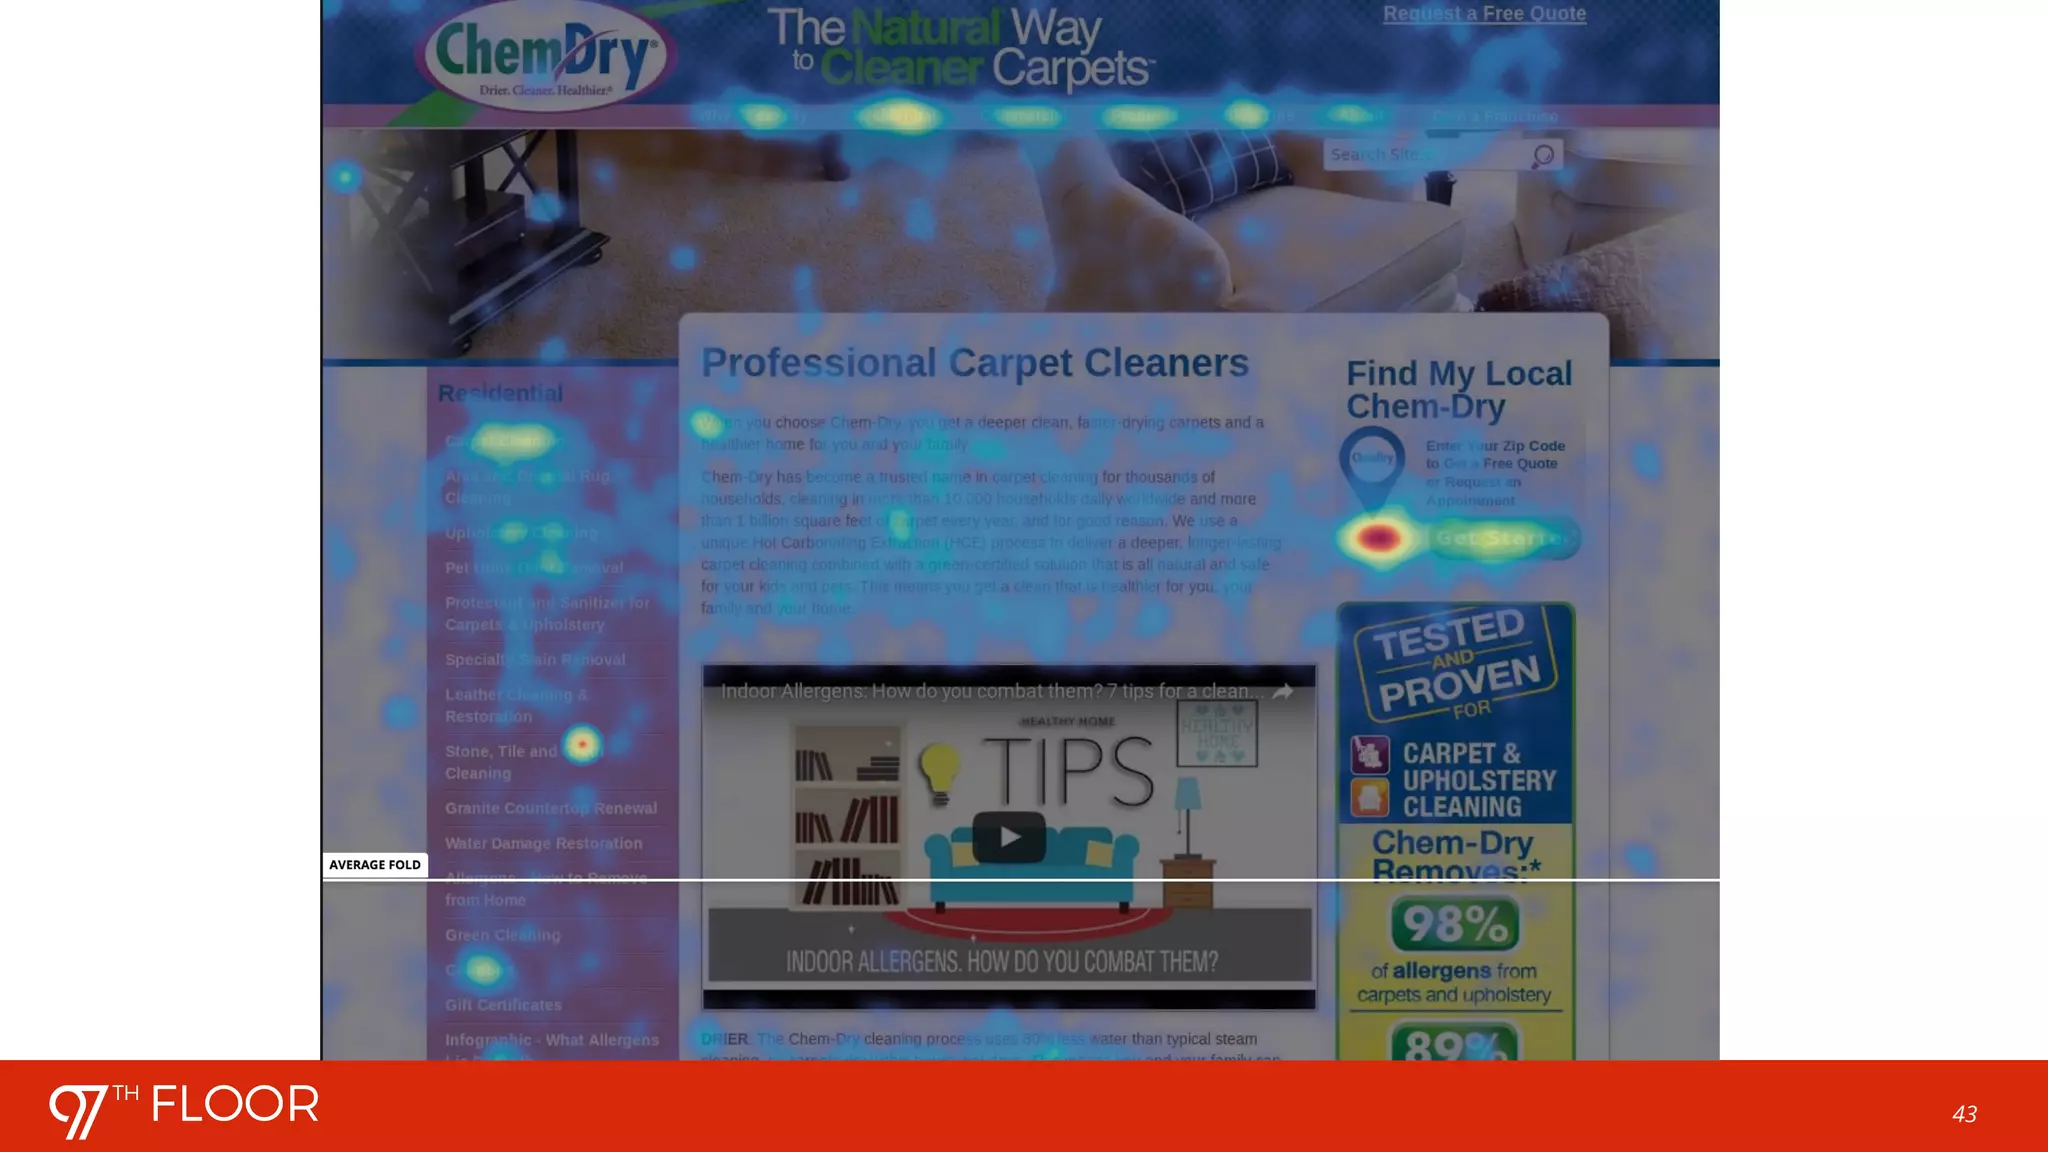
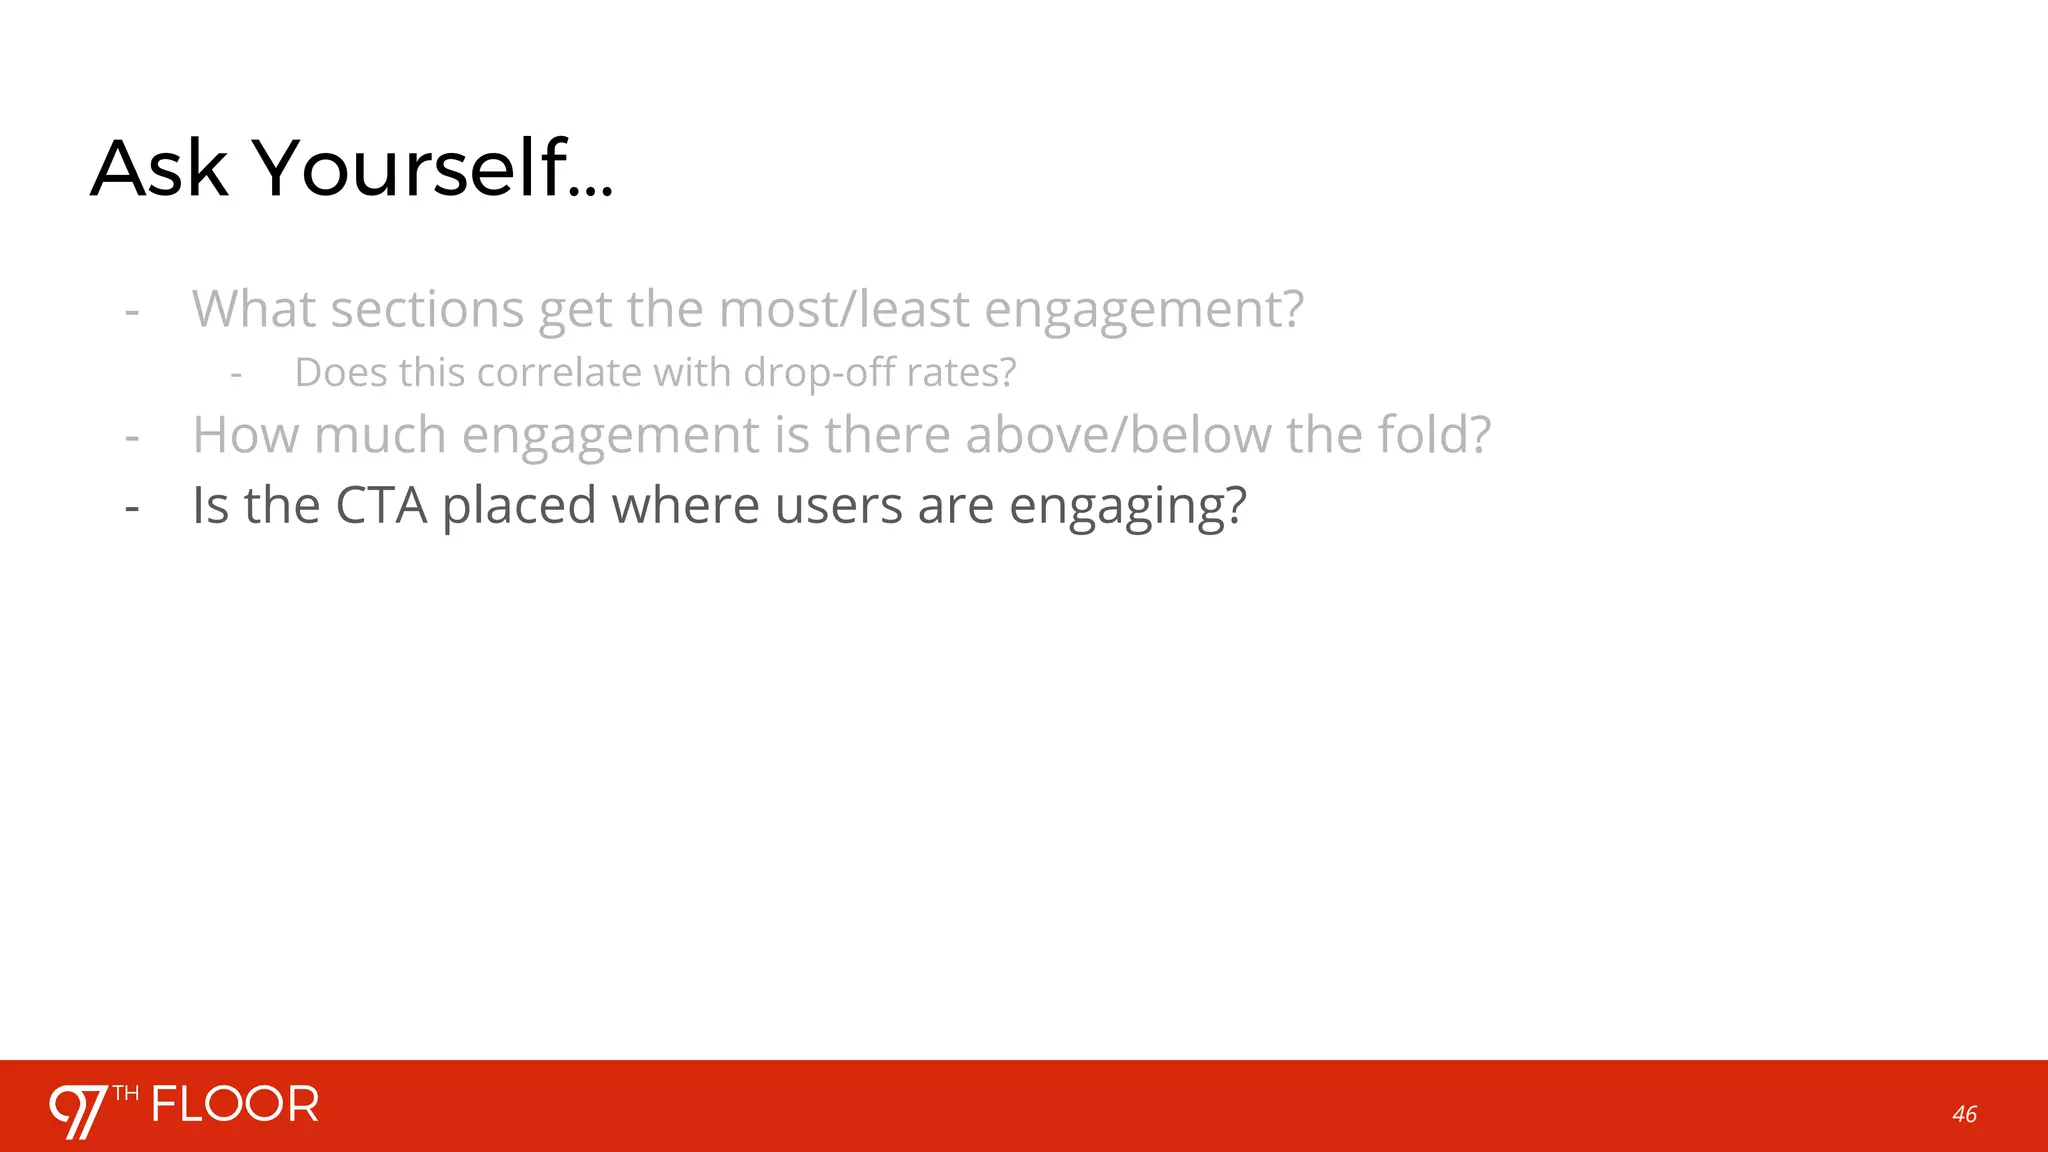

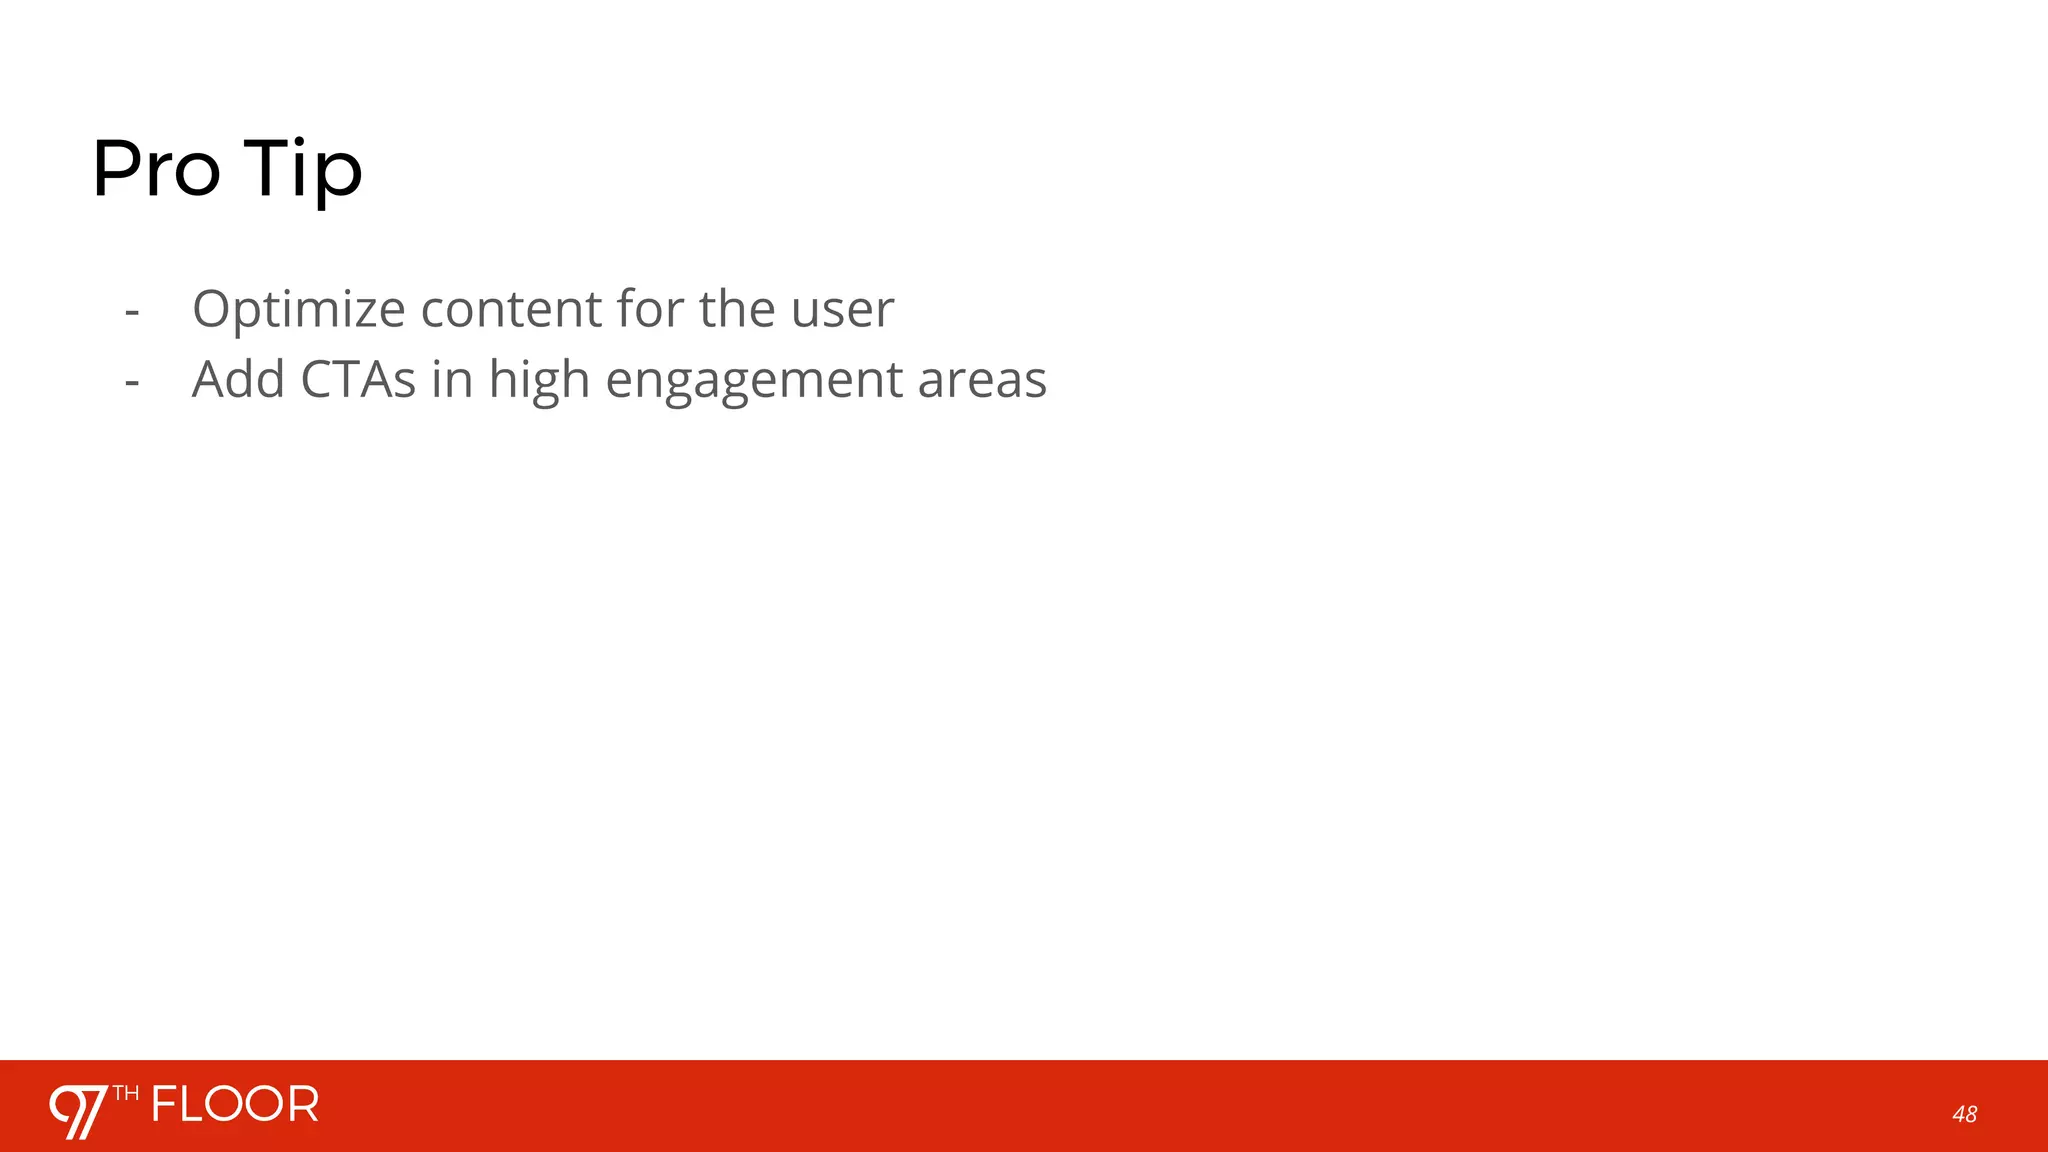

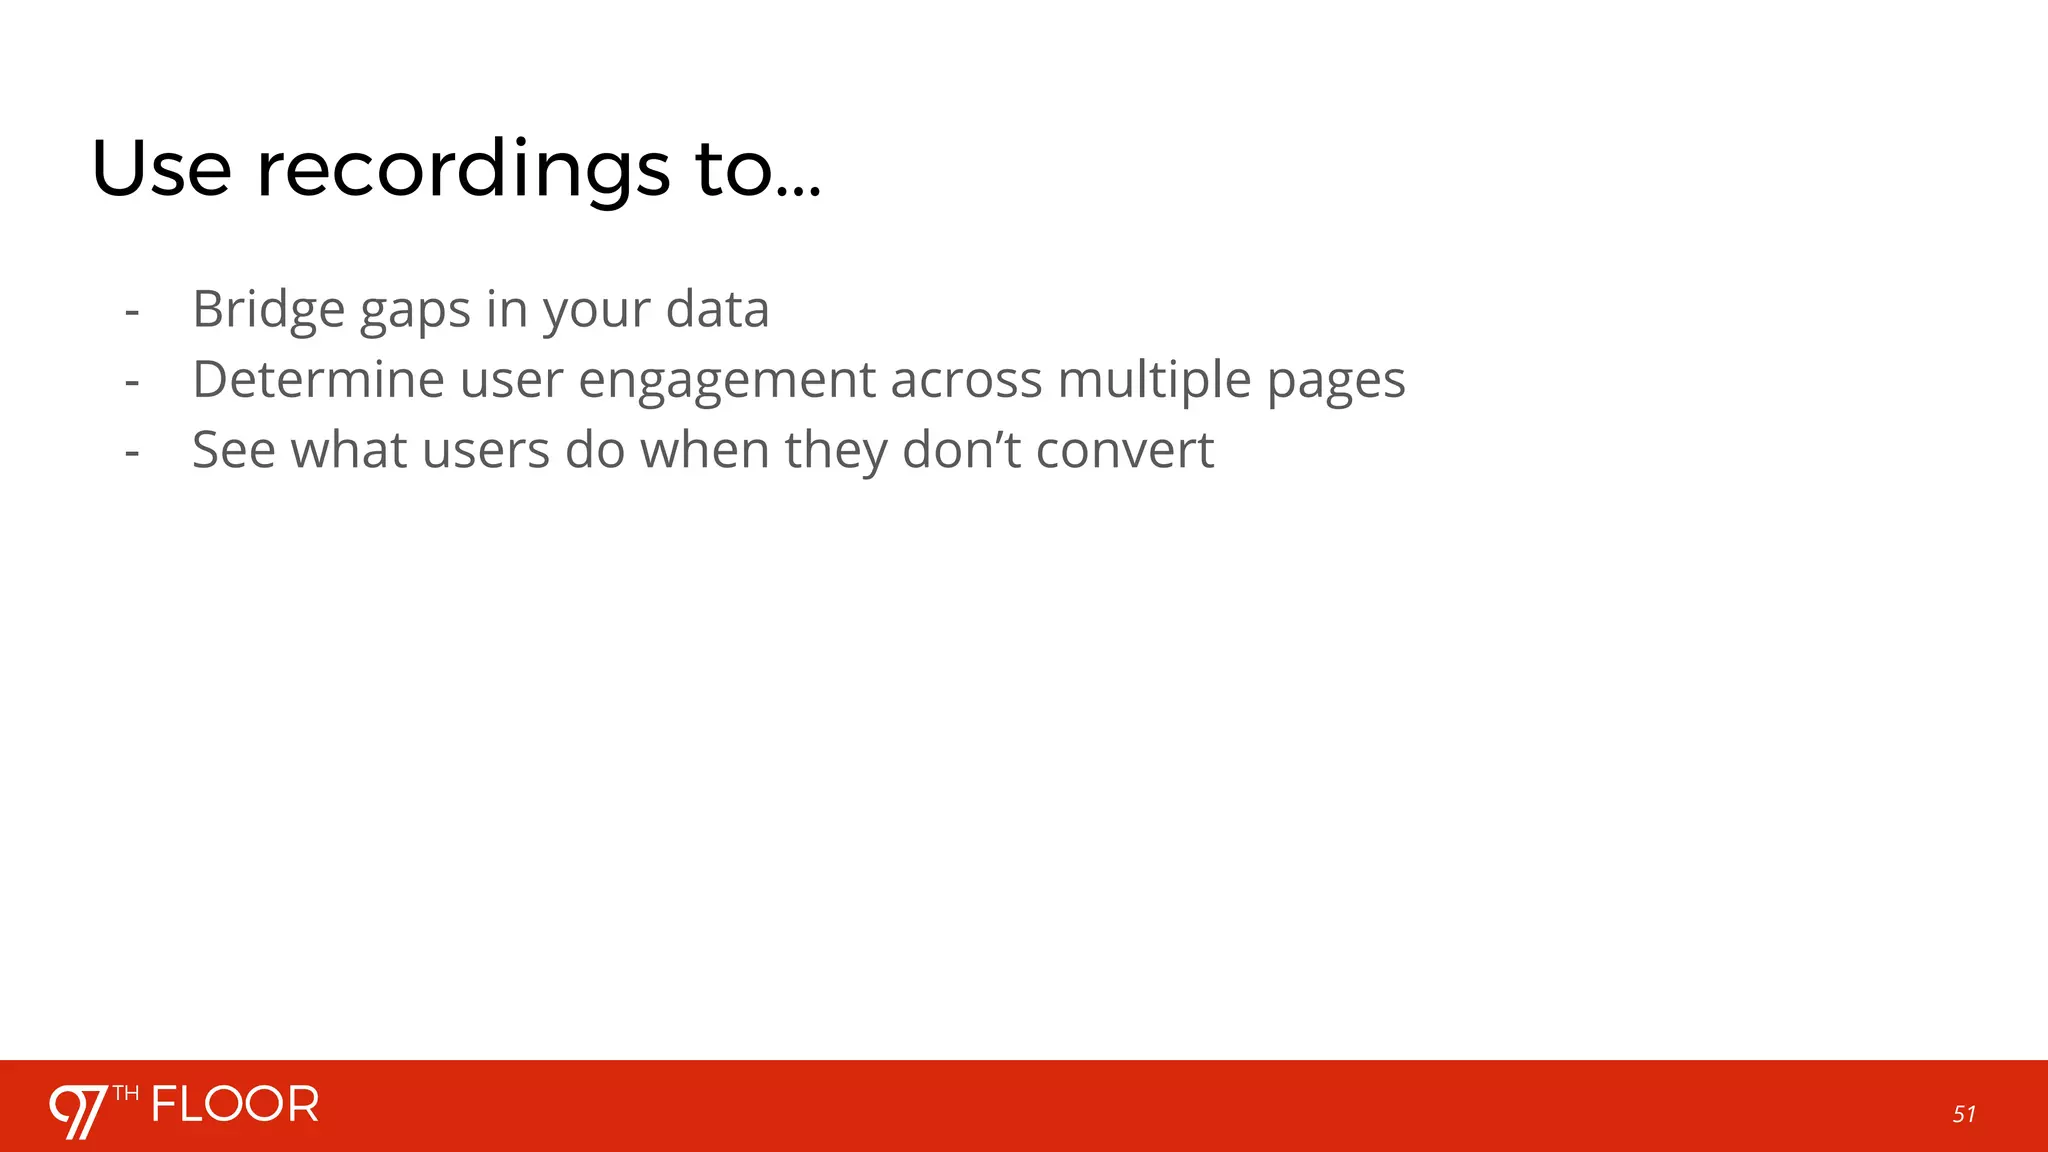


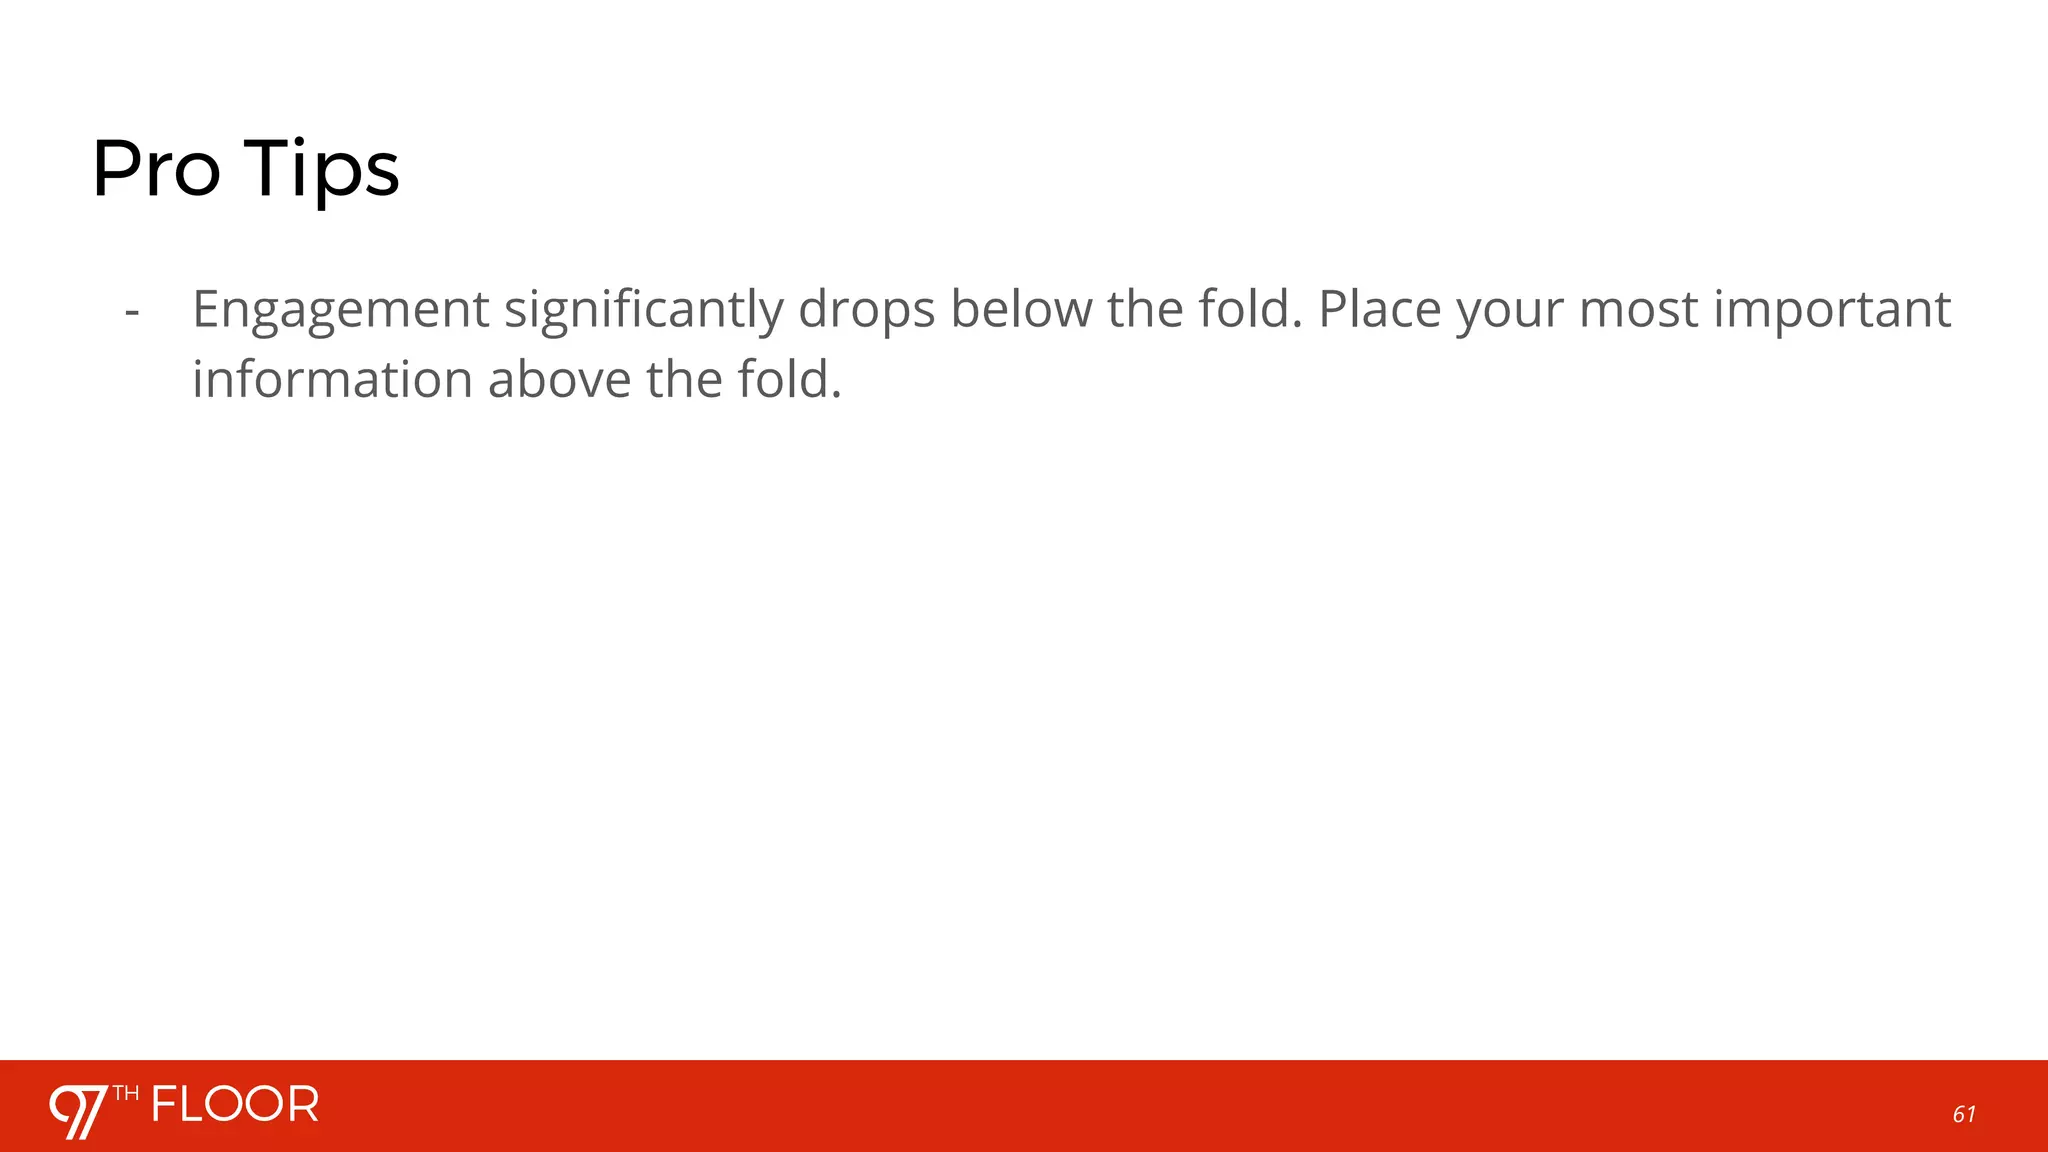
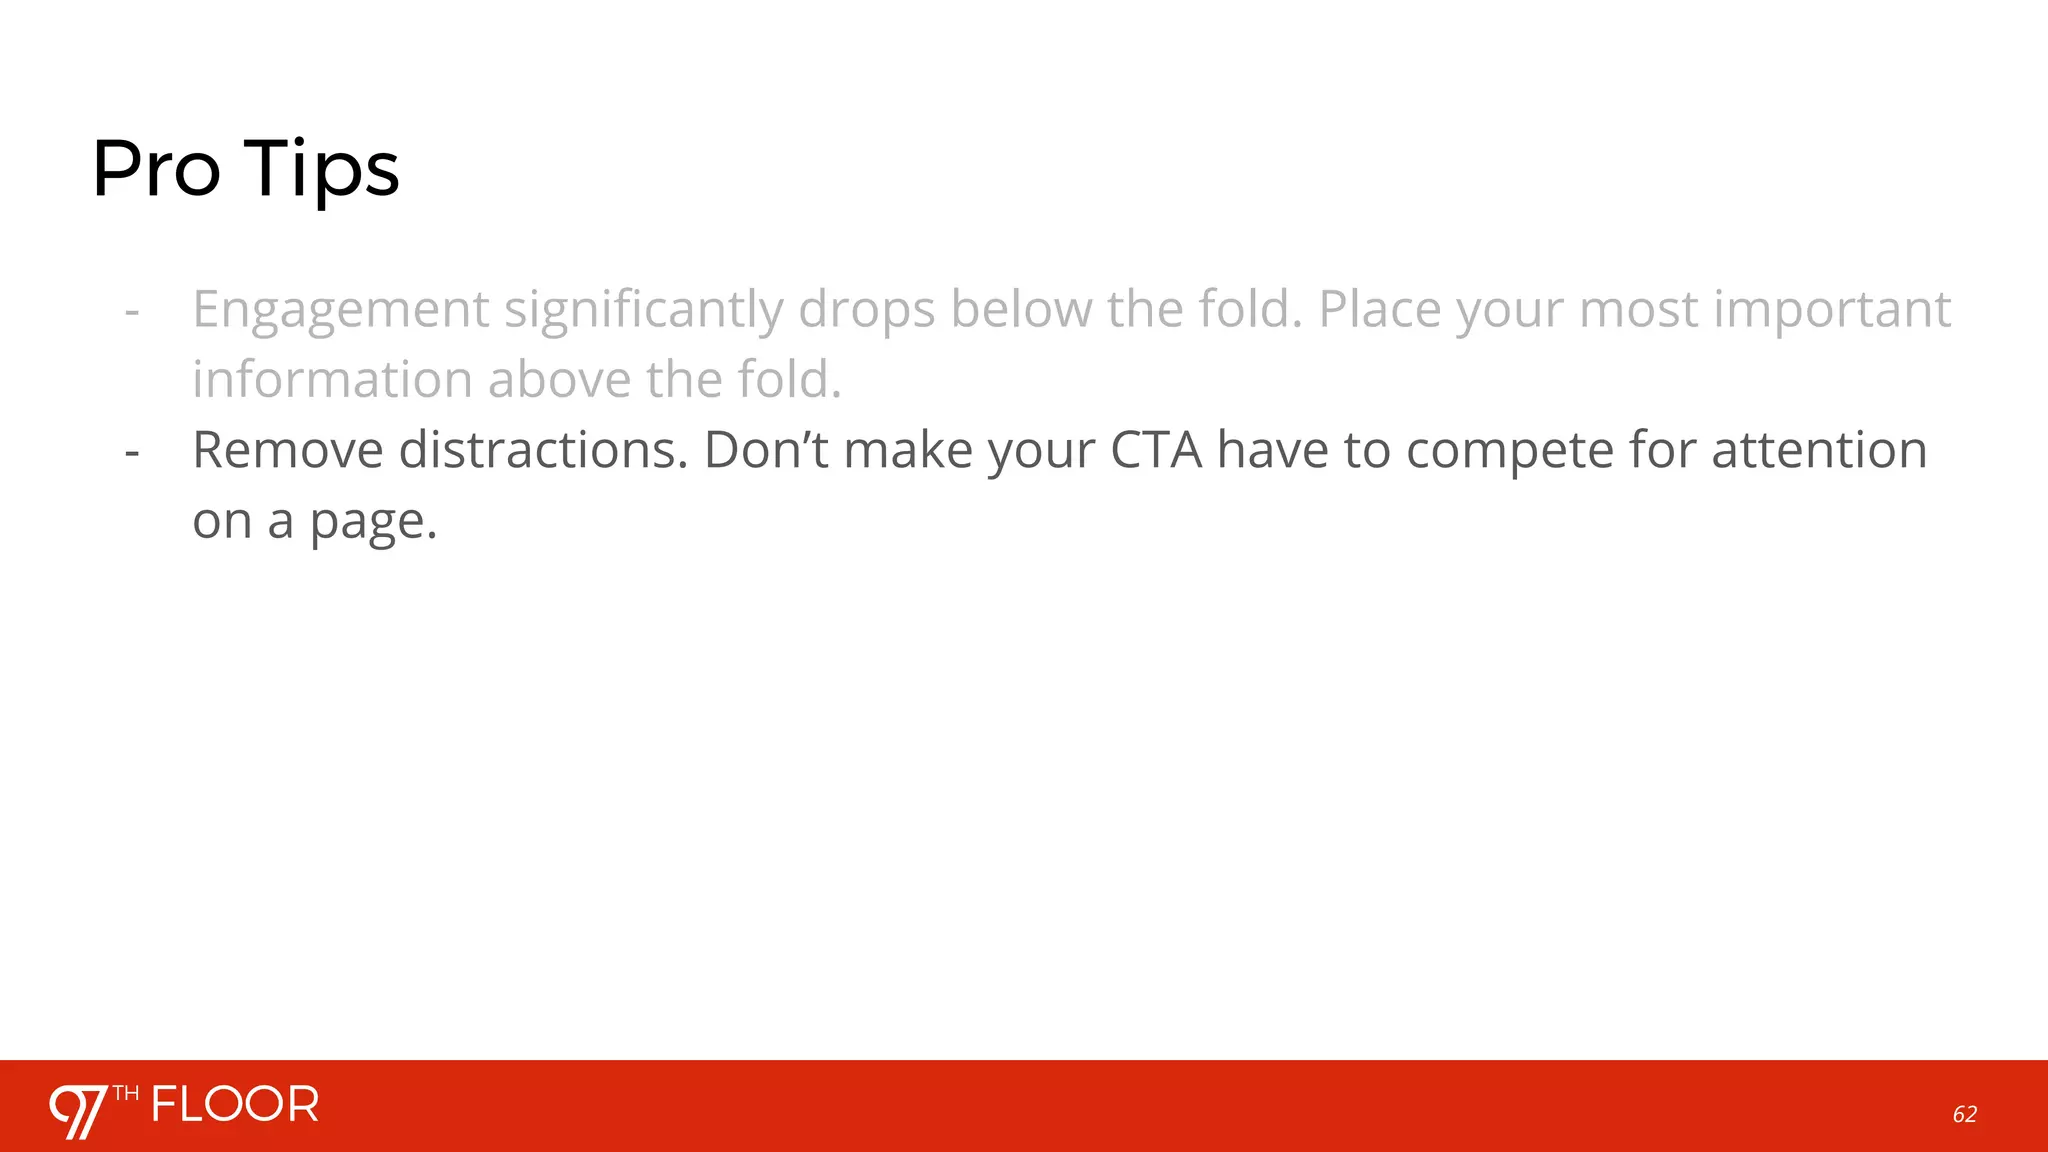
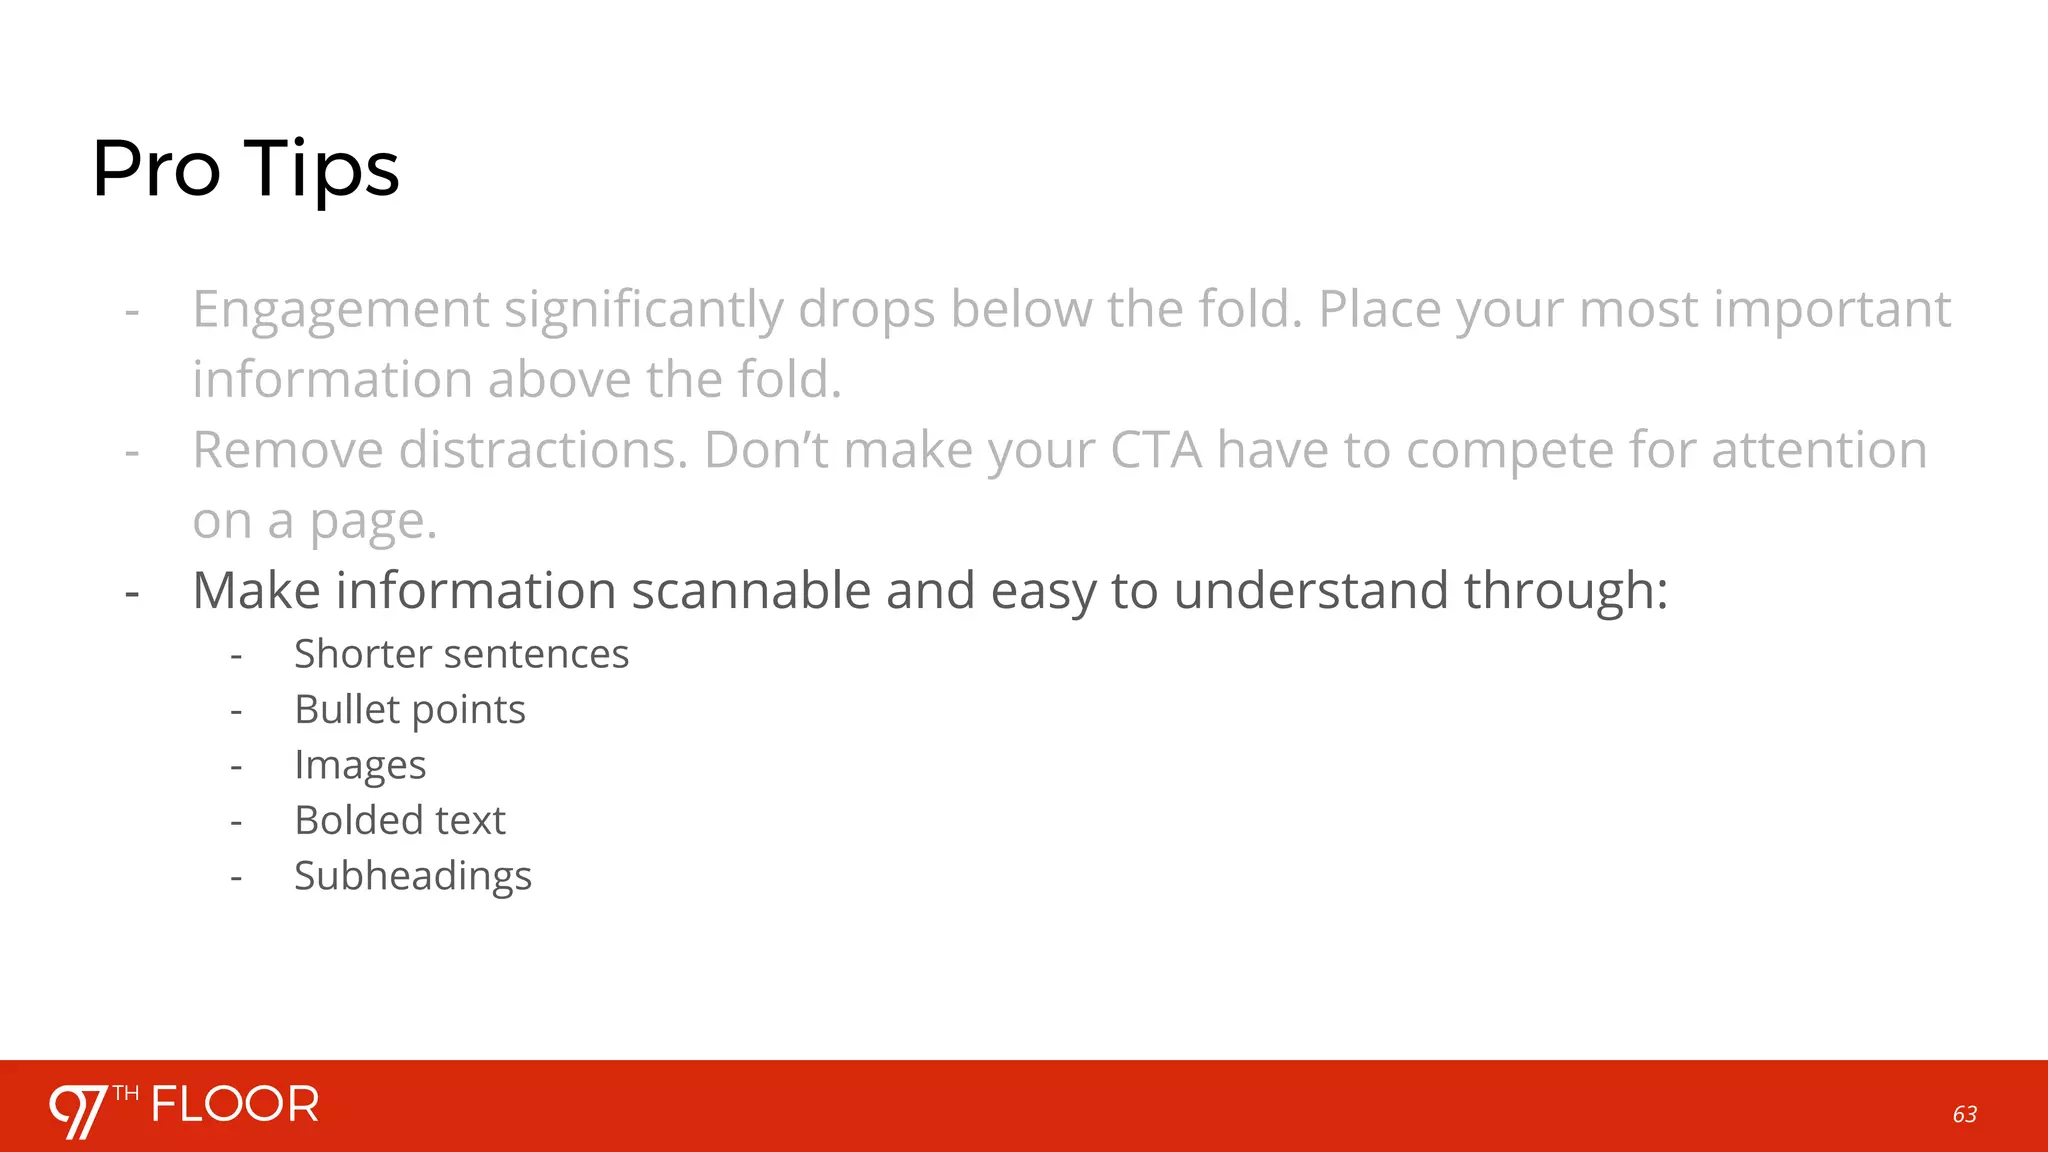
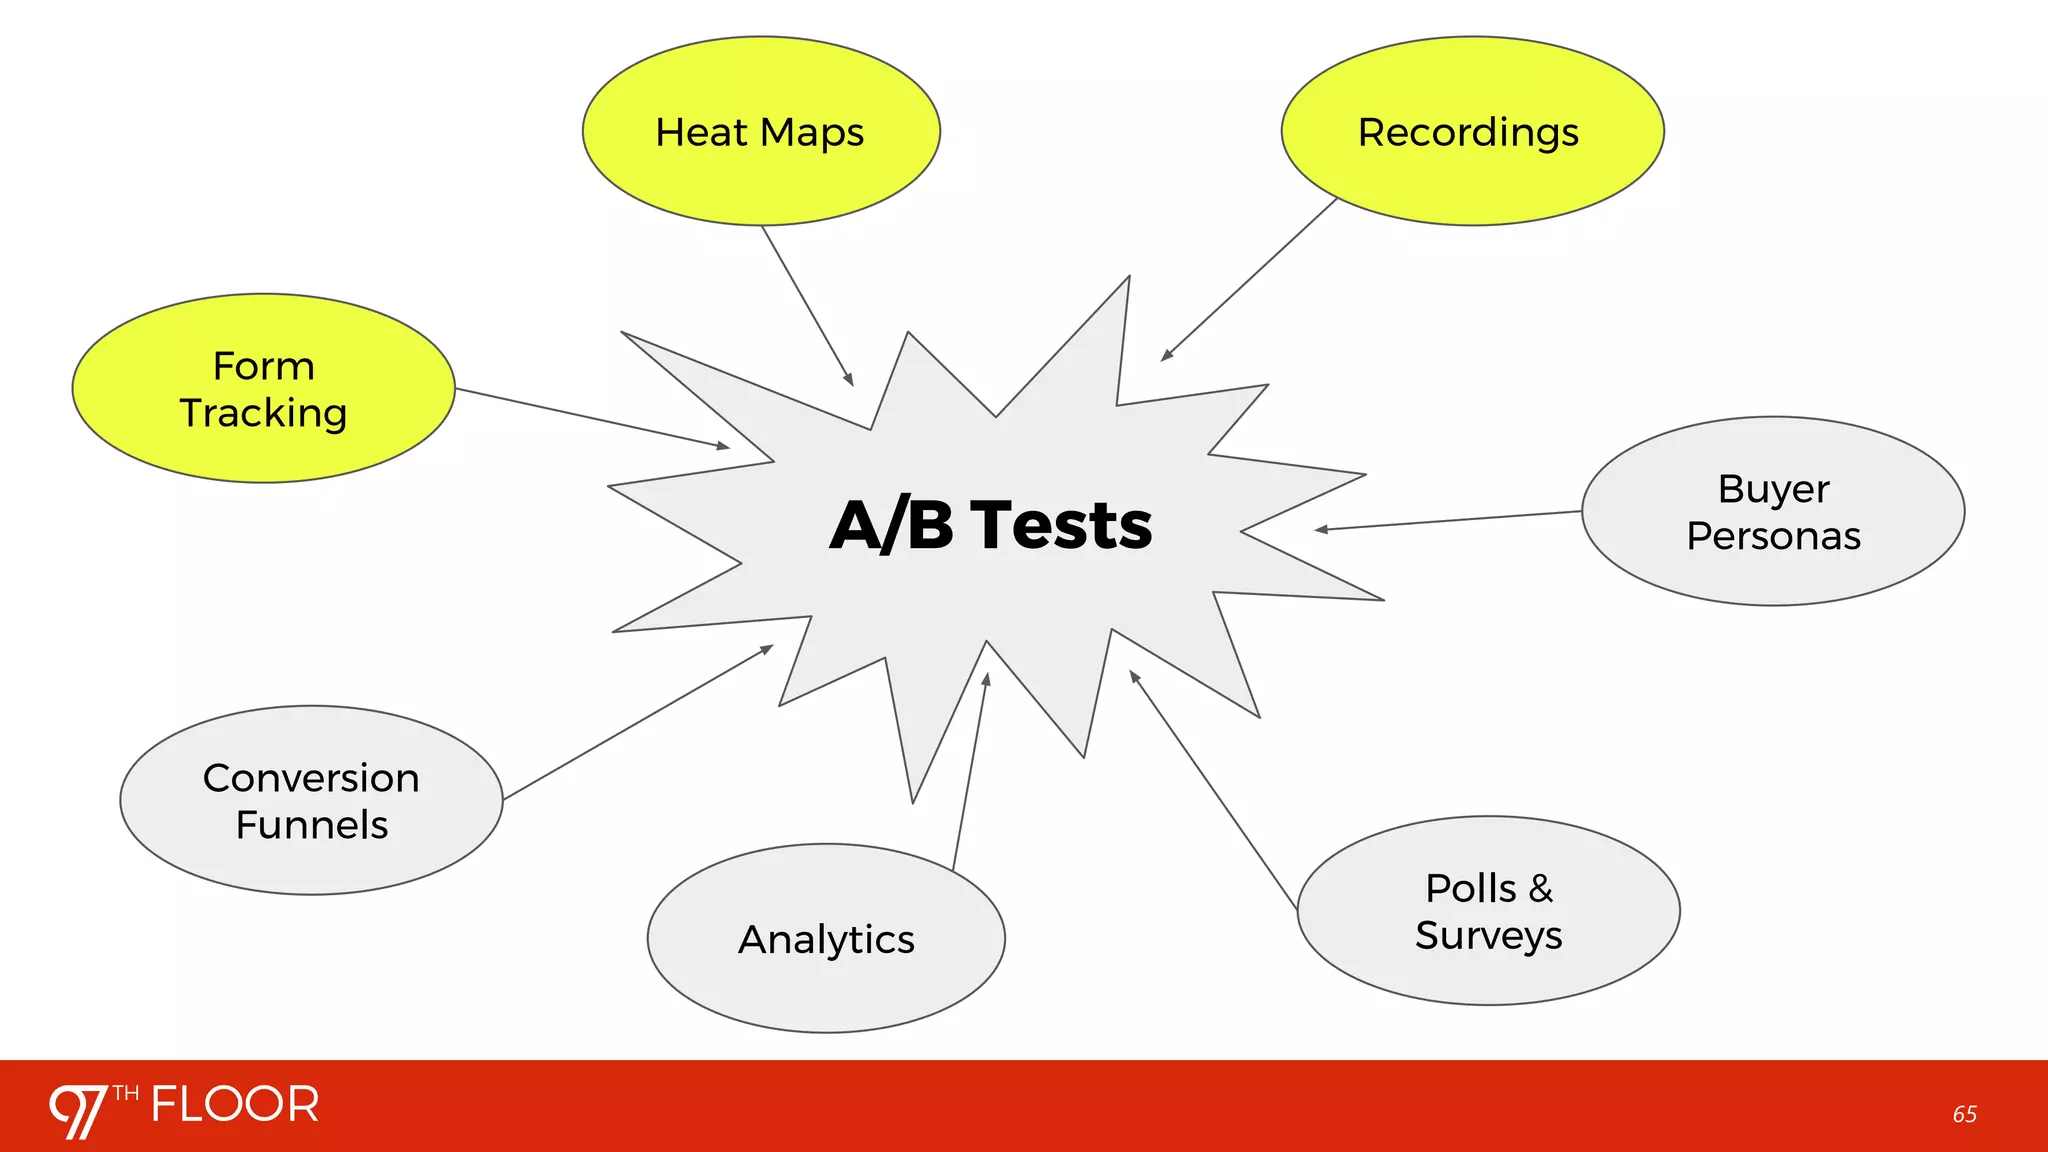
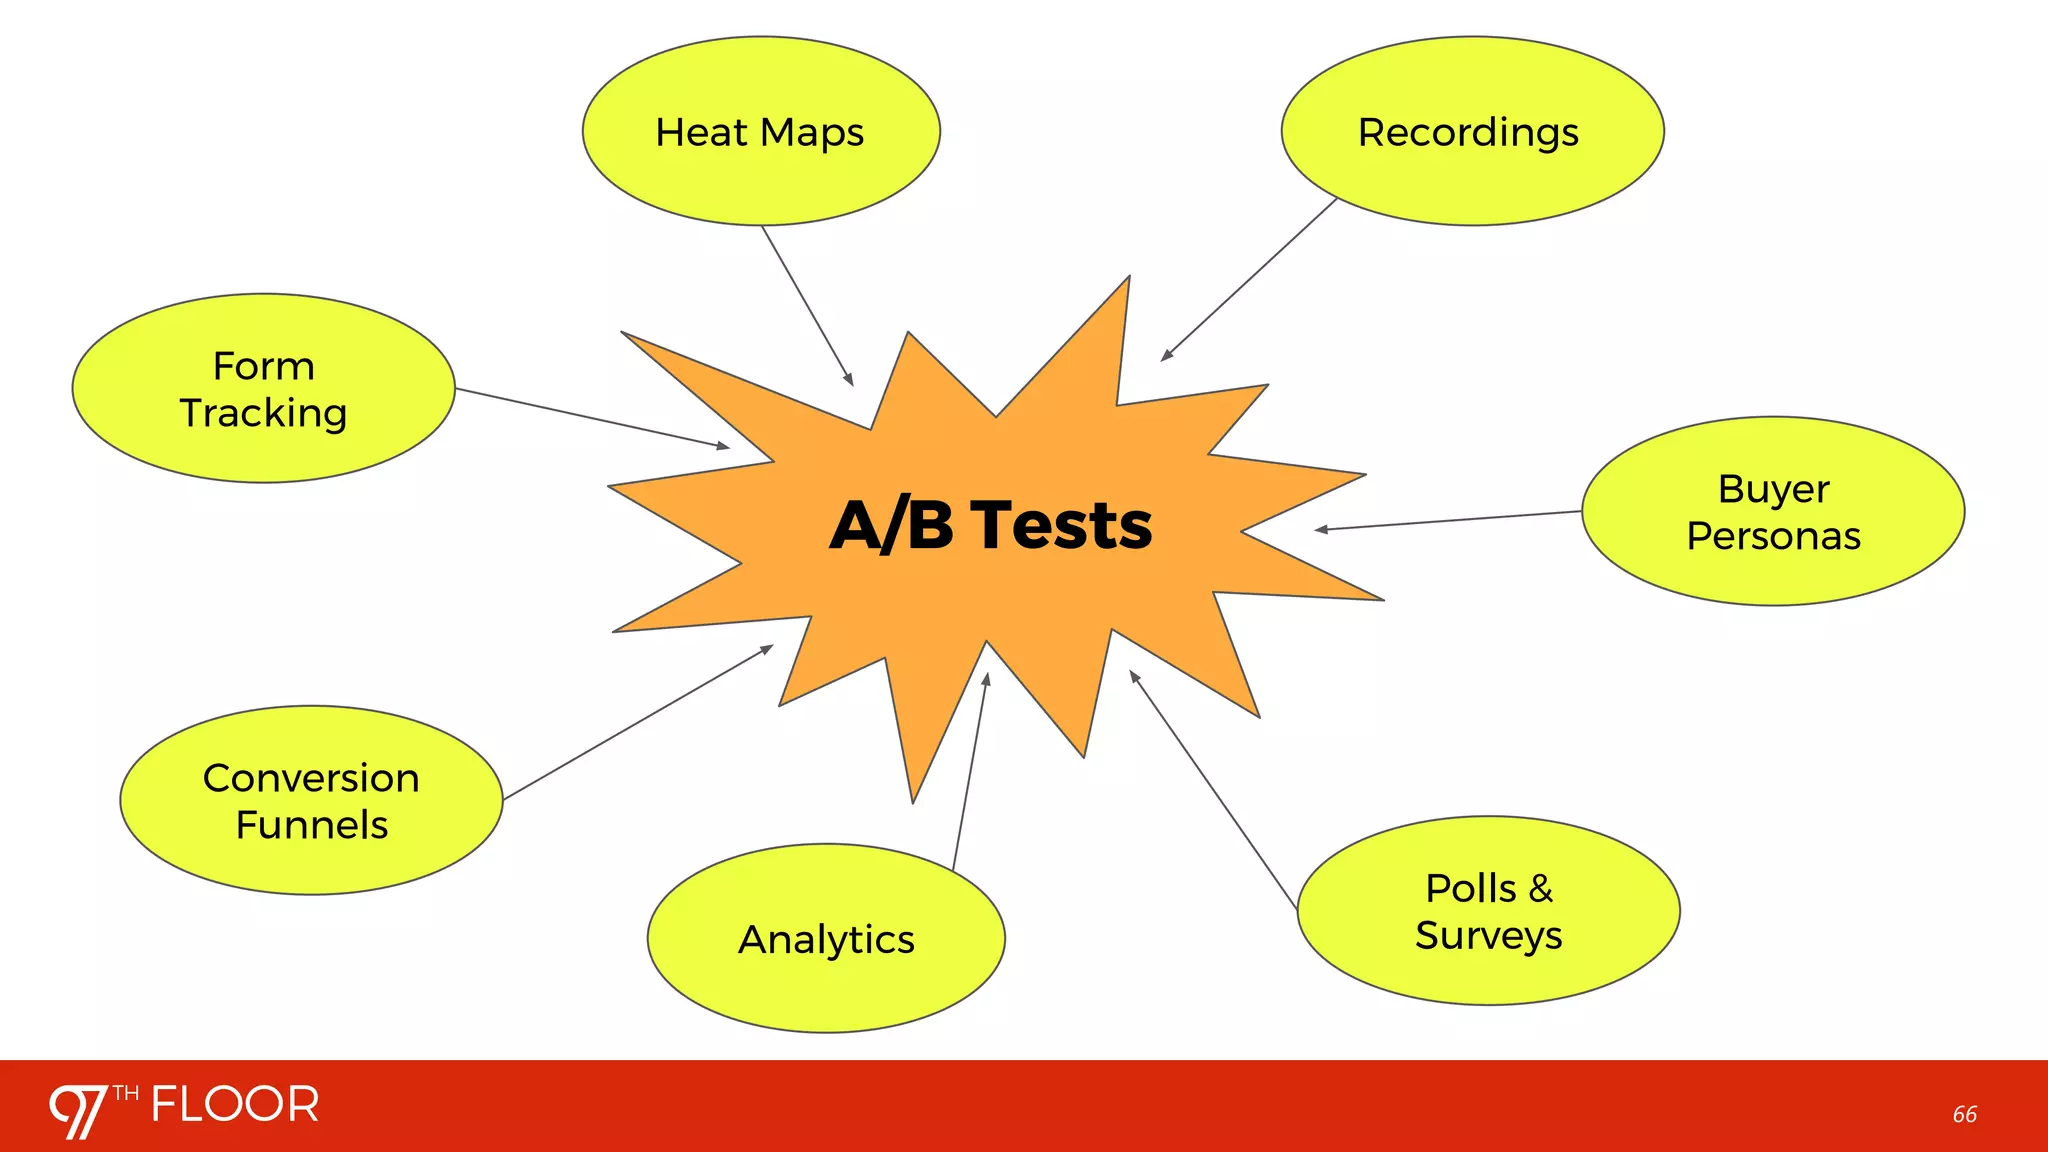


This webinar discusses how to use heat mapping and user metrics to improve conversion rate optimization (CRO). It explains that heat mapping software can identify areas where users click, scroll, and move their mouse on a webpage. This data reveals which page elements receive the most engagement and where users drop off. Common metrics like click-through and scroll rates are examined. The webinar advises forming hypotheses about how to increase conversions based on this user behavior data. Areas with low engagement should be improved, and calls-to-action should be placed in highly interactive regions. Testing hypotheses through A/B testing can then help optimize the user experience and further increase conversions. The process emphasizes continually analyzing metrics, forming new hypotheses, and


![[Webinar] Advanced Keyword Research](https://cdn.slidesharecdn.com/ss_thumbnails/webinaradvancedkeywordresearchbypaxtongray-170315203410-thumbnail.jpg?width=640&height=640&fit=bounds)

![[Workshop] Paid Search Landing Page Optimization](https://cdn.slidesharecdn.com/ss_thumbnails/workshoppaidlandingpageoptimizationwithtylergirsberger-171012225810-thumbnail.jpg?width=640&height=640&fit=bounds)

![[Workshop] Turning Paid Traffic Into Paying Customers](https://cdn.slidesharecdn.com/ss_thumbnails/workshoppaidtrafficbyericfarmer-170417172746-thumbnail.jpg?width=640&height=640&fit=bounds)
![[Webinar] SEO Metrics That Matter (and Those That Do Not)](https://cdn.slidesharecdn.com/ss_thumbnails/webinarseometricsbypjhowland-170411205238-thumbnail.jpg?width=640&height=640&fit=bounds)


![[Webinar] Blocking Spam Efficiently in Google Analytics](https://cdn.slidesharecdn.com/ss_thumbnails/webinarspamtrafficbybarrettdastrup-170510011525-thumbnail.jpg?width=640&height=640&fit=bounds)

![[Webinar] Advanced Google Analytics](https://cdn.slidesharecdn.com/ss_thumbnails/webinargoogleanalyticsbychristinasanders-170328183539-thumbnail.jpg?width=640&height=640&fit=bounds)
![[Workshop] CRO Basics: Principles of High-Converting Pages (No A/B Testing Re...](https://cdn.slidesharecdn.com/ss_thumbnails/workshopchristina-170814191923-thumbnail.jpg?width=640&height=640&fit=bounds)
![[Webinar] Rank Zero: Beating Your Competition with Featured Snippets](https://cdn.slidesharecdn.com/ss_thumbnails/webinarbeatingyourcompetitionwithfeaturedsnippets-170613202204-thumbnail.jpg?width=640&height=640&fit=bounds)


![[Workshop] Compounding SEO Wins](https://cdn.slidesharecdn.com/ss_thumbnails/workshopcompoundingseowinsbypjhowland-170314212112-thumbnail.jpg?width=640&height=640&fit=bounds)


![[Webinar] Do This, Not That: Design for Non-Designers](https://cdn.slidesharecdn.com/ss_thumbnails/webinardothisnotthat-designfornon-designerswithmaggiecall-170914033336-thumbnail.jpg?width=640&height=640&fit=bounds)


