Downloaded 11 times
![The most successful distributors
manage their organization with a focus
on NET PROFITABILITY, enabled by a
detailed & fact-based understanding of
the true profit contribution of every
customer, product and sales channel.
$14.86 $0.23 $0.46 $0.97 $3.41 $2.76 $0.29 $0.34 $0.65 $1.14 $26.56
COGS & Sourcing Internal Processes SG&A
R E S O U R C E S
P R O C E S S E S
Purchase
Price or Mfg
Product Cost
Cost to
Serve
+ + + + + + + ++ =
Profitability Chain
$1.45 +
Customer and Product Profitability
Distributors’ efforts to
differentiate themselves and
compete in today’s market
have led to innovative changes
and an increased ability to
create value throughout the
supply chain. At the same time, they have brought incredible growth in the complexity and scope of their operations.
Managing this complexity requires the ability to understand the impact of each process performed and to gain
transparency into the true cost and net profitability of each and every customer and product.
For every process performed, resources are consumed adding more cost to products and customers. The ability to
create a clear and holistic view of costs across the organization is critical.
The ImpactECS platform is a flexible cost and profit modeling environment that gives distributors the tools to evaluate
each data element and to easily aggregate them to provide meaningful end-to-end analysis of cost and net profitability
across the organization and to drive better business decisions.
Legacy Distribution
· Transactional (pick, pack, ship)
· Operational efficiency and scale
· Credit management
· Logistics management
· On-time delivery
Value Based Distribution
· Technical specialization
· Product selection & excellence
· Channel & segment expertise
· Services [VMI, EDI, Returns, etc.]
· Sales & marketing
Solution Based Distribution
· Value add services & revenue
· End-to-end value provider
[suppliers, customers]
· Analytics based sales & marketing
· Multi-chanel proficiency](https://image.slidesharecdn.com/iecscustomerandproductprofitability-distributors-131113091858-phpapp01/75/Customer-and-Product-Profitability-for-Distributors-2-2048.jpg)
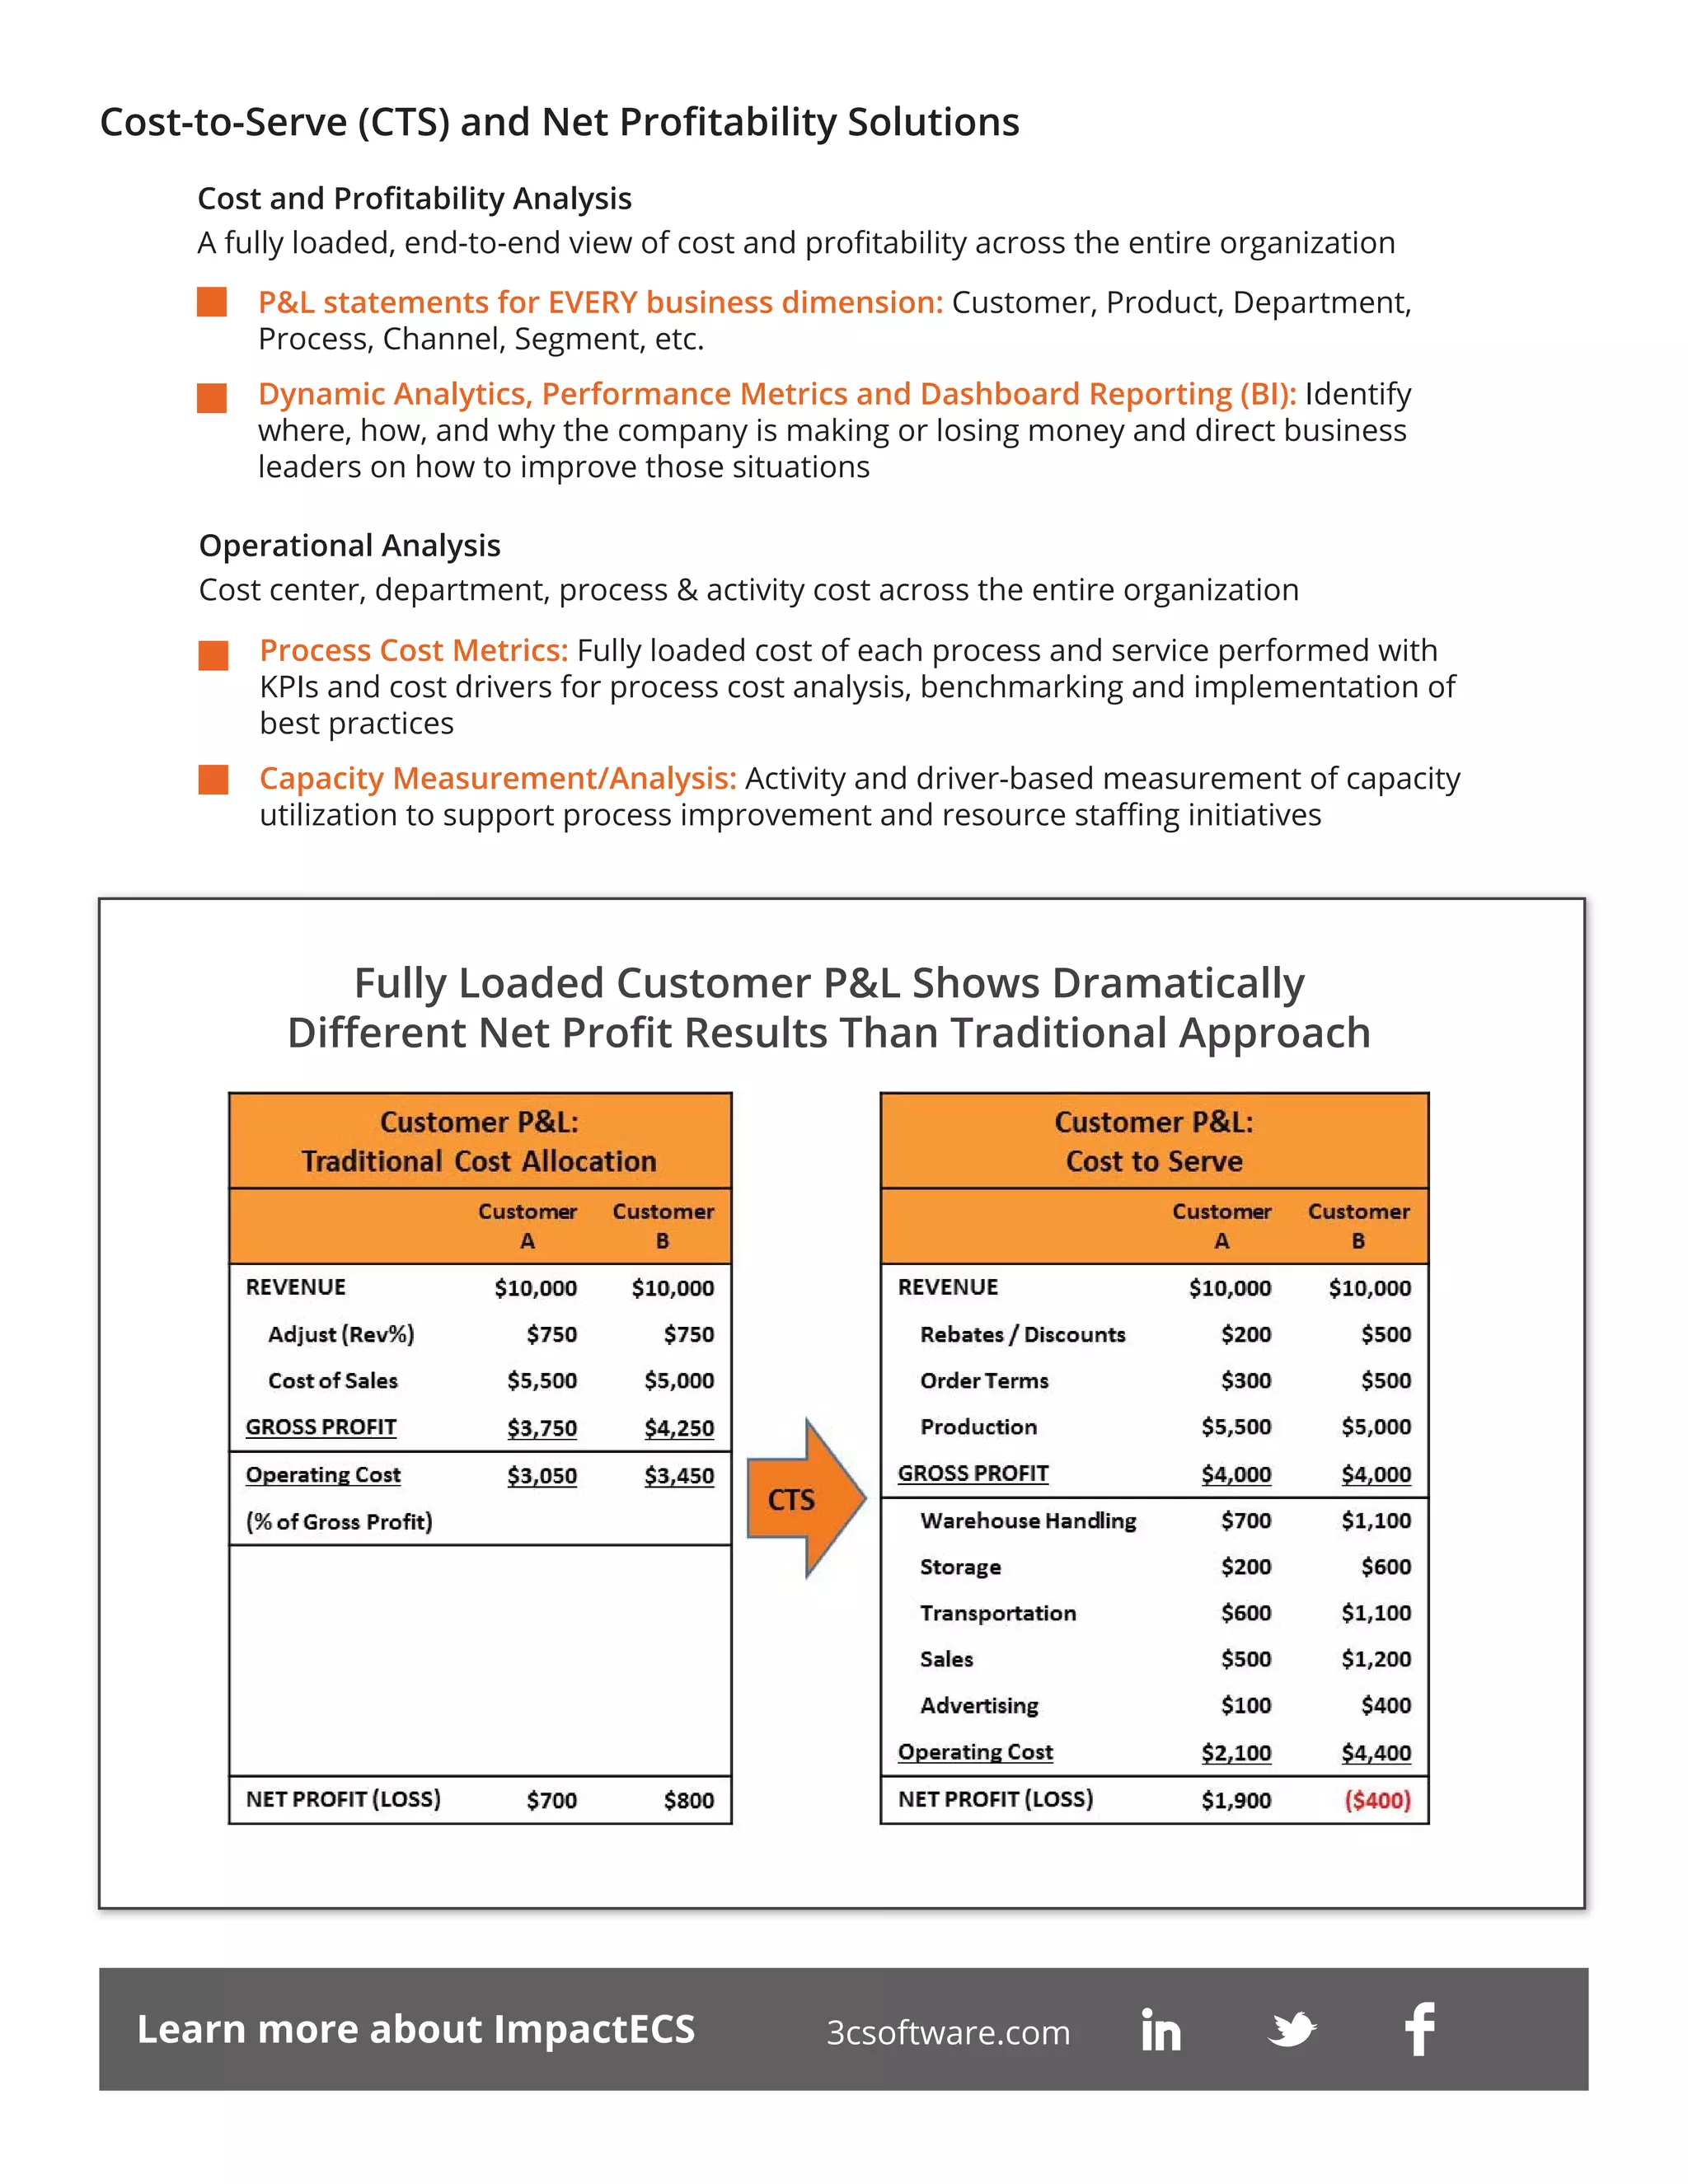

Successful distributors focus on net profitability through a detailed understanding of customer and product contributions, adapting to increasing complexities in operations. The impactecs platform offers tools for comprehensive cost and profit analysis, helping organizations make informed business decisions. By implementing cost-to-serve and net profitability solutions, businesses can optimize operations and potentially increase revenue and margins.


![[Infographic] 4 Problems with Using Excel for Analytics](https://cdn.slidesharecdn.com/ss_thumbnails/infographic4problemsexcel3csoftware-160618205402-thumbnail.jpg?width=640&height=640&fit=bounds)


