SlideShare a Scribd company logo
1 of 10
Data:
Frequency Tables and Line
          Plots
Vocabulary
Data - information, often given in the form
of numbers or categories.
Frequency Table – a table that displays
the number of times each item or category
occurs in a data set.
Line Plot – a number line diagram that
uses X marks to show the frequencies of
items being tallied.
Line Plot Example
Students at a Party
Books Students Read Last Month (numerical)
# of Books   Tallies   Frequency
     1          llll       5        students
     2          llll       5
     3        llll l       6
     4           ll        2
     5
     6
     7         llll        4
Making a Line Plot
Is a visual of the frequency distribution.
Line plots are NOT used for categorical
data.
Draw a number line whose scale starts
at or before the minimum data value
and stops at or after the maximum data
value. Use a consistent increment.
Completed Line Plot -
   When the items being tallied are numbers, a line plot
   can be used to visually display numerical data. A line
   plot uses X marks above a number line to show the
   frequencies.                            The X marks above
                                                 the number line show
                            X                    the frequencies.
                 X     X    X
The Number Line X      X    X                    X
shows the number X     X    X                    X
of books read.   X     X    X    X               X
                 X     X    X    X               X


                1      2   3     4     5     6   7
                      Number of Books Read
Making a Frequency Table
Categorical data: data that can
 be placed into categories.
Categorical question: What is
 your favorite color?
Completed Frequency Table-
   Favorite Color (category)
                                   people

   Color      Tallies    Frequency
   Blue        llll          5
   Red           lll         3
  Yellow           l         1
  Purple          ll         2
  Orange        llll         4
  Green
   Black        ll             2
Variability in Data Distributions
 Outliers-Unusually high or low values in
  a distribution.

  Clusters-An group of data values with
  higher frequency than surrounding
  values.
 Gaps-Areas in the scale where there is a

  lack of data values.
Analyze the Data
 Now look at the Frequency
Tables and the Line Plots from
your notes to see if you can
identify any outliers, clusters or
gaps.

More Related Content

What's hot

Symmetry: Lines, Reflection, Rotation
Symmetry: Lines, Reflection, Rotation Symmetry: Lines, Reflection, Rotation
Symmetry: Lines, Reflection, Rotation Greta Calleja
 
Fractions And Decimals
Fractions And DecimalsFractions And Decimals
Fractions And Decimalsriggs4
 
Decimals guide
Decimals guideDecimals guide
Decimals guideSmithnz
 
Multiplying and dividing fractions
Multiplying and dividing fractionsMultiplying and dividing fractions
Multiplying and dividing fractionsjocrumb
 
Angles powerpoint
Angles powerpointAngles powerpoint
Angles powerpointguestdd350
 
Lines and angles presentation
Lines and angles presentationLines and angles presentation
Lines and angles presentationAnnmarie1020
 
Decimal and Fraction
Decimal and FractionDecimal and Fraction
Decimal and Fractiondburgette
 
Simplifying Fractions
Simplifying FractionsSimplifying Fractions
Simplifying Fractionsdalow65
 
Powers and Exponents
Powers and ExponentsPowers and Exponents
Powers and ExponentsTaleese
 
Algebra Expressions and Equations
Algebra Expressions and EquationsAlgebra Expressions and Equations
Algebra Expressions and EquationsKelly Williams
 
Adding Numbers with Regrouping
Adding Numbers with RegroupingAdding Numbers with Regrouping
Adding Numbers with RegroupingJohdener14
 
Approximation and estimation
Approximation and estimationApproximation and estimation
Approximation and estimationAluko Sayo Enoch
 
Comparing Decimals
Comparing DecimalsComparing Decimals
Comparing Decimalsemteacher
 

What's hot (20)

Symmetry: Lines, Reflection, Rotation
Symmetry: Lines, Reflection, Rotation Symmetry: Lines, Reflection, Rotation
Symmetry: Lines, Reflection, Rotation
 
Fractions And Decimals
Fractions And DecimalsFractions And Decimals
Fractions And Decimals
 
Angles
AnglesAngles
Angles
 
Decimals guide
Decimals guideDecimals guide
Decimals guide
 
Line symmetry
Line symmetryLine symmetry
Line symmetry
 
Multiplying and dividing fractions
Multiplying and dividing fractionsMultiplying and dividing fractions
Multiplying and dividing fractions
 
Angles powerpoint
Angles powerpointAngles powerpoint
Angles powerpoint
 
Algebraic expression
Algebraic expressionAlgebraic expression
Algebraic expression
 
Lines and angles presentation
Lines and angles presentationLines and angles presentation
Lines and angles presentation
 
Decimal and Fraction
Decimal and FractionDecimal and Fraction
Decimal and Fraction
 
Round Decimals
Round DecimalsRound Decimals
Round Decimals
 
Adding Decimals
Adding DecimalsAdding Decimals
Adding Decimals
 
Simplifying Fractions
Simplifying FractionsSimplifying Fractions
Simplifying Fractions
 
Properties of 3 d shapes
Properties of 3 d shapesProperties of 3 d shapes
Properties of 3 d shapes
 
Basic geometry
Basic geometryBasic geometry
Basic geometry
 
Powers and Exponents
Powers and ExponentsPowers and Exponents
Powers and Exponents
 
Algebra Expressions and Equations
Algebra Expressions and EquationsAlgebra Expressions and Equations
Algebra Expressions and Equations
 
Adding Numbers with Regrouping
Adding Numbers with RegroupingAdding Numbers with Regrouping
Adding Numbers with Regrouping
 
Approximation and estimation
Approximation and estimationApproximation and estimation
Approximation and estimation
 
Comparing Decimals
Comparing DecimalsComparing Decimals
Comparing Decimals
 

Viewers also liked

2.4 frequency and line plots
2.4 frequency and line plots2.4 frequency and line plots
2.4 frequency and line plotsRachel
 
1 data analysis -line plots masy 19
1  data analysis -line plots masy 191  data analysis -line plots masy 19
1 data analysis -line plots masy 19mskarras
 
Frequency table and line plot
Frequency table and line plotFrequency table and line plot
Frequency table and line plotbweldon
 
Cons30 S Data Analysis Line Plots
Cons30 S Data Analysis Line PlotsCons30 S Data Analysis Line Plots
Cons30 S Data Analysis Line Plotsnmal
 
How to Make a Frequency Table and Bar Graph
How to Make a Frequency Table and Bar GraphHow to Make a Frequency Table and Bar Graph
How to Make a Frequency Table and Bar GraphAmanda Craft
 
2 30 Data Collection
2 30 Data Collection2 30 Data Collection
2 30 Data CollectionBitsy Griffin
 
Box Plots and Histograms
Box Plots and HistogramsBox Plots and Histograms
Box Plots and HistogramsRenegarmath
 
Basic Math coursework(histogram)
Basic Math coursework(histogram)Basic Math coursework(histogram)
Basic Math coursework(histogram)Geverny Quera
 
3rd Grade Homeschool Curriculum - Third Grade Homeschool Math - Best Homescho...
3rd Grade Homeschool Curriculum - Third Grade Homeschool Math - Best Homescho...3rd Grade Homeschool Curriculum - Third Grade Homeschool Math - Best Homescho...
3rd Grade Homeschool Curriculum - Third Grade Homeschool Math - Best Homescho...<a>My Homeschool Texts</a>
 
FCA GCSE MMMR From Frequency Tables (Linear)
FCA GCSE MMMR From Frequency Tables (Linear)FCA GCSE MMMR From Frequency Tables (Linear)
FCA GCSE MMMR From Frequency Tables (Linear)Miss_Cowell
 
Stem-and-Leaf Plot and Line Plot
Stem-and-Leaf Plot and Line PlotStem-and-Leaf Plot and Line Plot
Stem-and-Leaf Plot and Line Plotsheisirenebkm
 
TRIZ education using Pictographs and Music
TRIZ education using Pictographs and MusicTRIZ education using Pictographs and Music
TRIZ education using Pictographs and MusicJeongho Shin
 
Graphing Data
Graphing DataGraphing Data
Graphing Datashas595
 

Viewers also liked (20)

Line plots
Line plotsLine plots
Line plots
 
2.4 frequency and line plots
2.4 frequency and line plots2.4 frequency and line plots
2.4 frequency and line plots
 
Line Plots
Line PlotsLine Plots
Line Plots
 
Freq & Histo
Freq & HistoFreq & Histo
Freq & Histo
 
1 data analysis -line plots masy 19
1  data analysis -line plots masy 191  data analysis -line plots masy 19
1 data analysis -line plots masy 19
 
Frequency table and line plot
Frequency table and line plotFrequency table and line plot
Frequency table and line plot
 
Cons30 S Data Analysis Line Plots
Cons30 S Data Analysis Line PlotsCons30 S Data Analysis Line Plots
Cons30 S Data Analysis Line Plots
 
How to Make a Frequency Table and Bar Graph
How to Make a Frequency Table and Bar GraphHow to Make a Frequency Table and Bar Graph
How to Make a Frequency Table and Bar Graph
 
2 30 Data Collection
2 30 Data Collection2 30 Data Collection
2 30 Data Collection
 
Box Plots and Histograms
Box Plots and HistogramsBox Plots and Histograms
Box Plots and Histograms
 
Line plot
Line plotLine plot
Line plot
 
Basic Math coursework(histogram)
Basic Math coursework(histogram)Basic Math coursework(histogram)
Basic Math coursework(histogram)
 
Chap 22 Data Display
Chap 22 Data DisplayChap 22 Data Display
Chap 22 Data Display
 
3rd Grade Homeschool Curriculum - Third Grade Homeschool Math - Best Homescho...
3rd Grade Homeschool Curriculum - Third Grade Homeschool Math - Best Homescho...3rd Grade Homeschool Curriculum - Third Grade Homeschool Math - Best Homescho...
3rd Grade Homeschool Curriculum - Third Grade Homeschool Math - Best Homescho...
 
FCA GCSE MMMR From Frequency Tables (Linear)
FCA GCSE MMMR From Frequency Tables (Linear)FCA GCSE MMMR From Frequency Tables (Linear)
FCA GCSE MMMR From Frequency Tables (Linear)
 
Stem-and-Leaf Plot and Line Plot
Stem-and-Leaf Plot and Line PlotStem-and-Leaf Plot and Line Plot
Stem-and-Leaf Plot and Line Plot
 
TRIZ education using Pictographs and Music
TRIZ education using Pictographs and MusicTRIZ education using Pictographs and Music
TRIZ education using Pictographs and Music
 
Graphing Data
Graphing DataGraphing Data
Graphing Data
 
Graphs
GraphsGraphs
Graphs
 
Pie Charts
Pie ChartsPie Charts
Pie Charts
 

Similar to Frequency tables and line plots

LINE AND SCATTER DIAGRAM,FREQUENCY DISTRIBUTION
LINE AND SCATTER DIAGRAM,FREQUENCY DISTRIBUTIONLINE AND SCATTER DIAGRAM,FREQUENCY DISTRIBUTION
LINE AND SCATTER DIAGRAM,FREQUENCY DISTRIBUTIONruhila bhat
 
graphic representations in statistics
 graphic representations in statistics graphic representations in statistics
graphic representations in statisticsUnsa Shakir
 
3. data visualisations
3. data visualisations3. data visualisations
3. data visualisationsDebasish Padhy
 
2.4 Scatterplots, correlation, and regression
2.4 Scatterplots, correlation, and regression2.4 Scatterplots, correlation, and regression
2.4 Scatterplots, correlation, and regressionLong Beach City College
 
Wynberg girls high-Jade Gibson-maths-data analysis statistics
Wynberg girls high-Jade Gibson-maths-data analysis statisticsWynberg girls high-Jade Gibson-maths-data analysis statistics
Wynberg girls high-Jade Gibson-maths-data analysis statisticsWynberg Girls High
 
Presentation and analysis of business data
Presentation and analysis of business dataPresentation and analysis of business data
Presentation and analysis of business dataGeorginaRecto
 
Presentation and-analysis-of-business-data
Presentation and-analysis-of-business-dataPresentation and-analysis-of-business-data
Presentation and-analysis-of-business-datamariantuvilla
 
Presentation and-analysis-of-business-data
Presentation and-analysis-of-business-dataPresentation and-analysis-of-business-data
Presentation and-analysis-of-business-datalawrencechavenia
 
Presentation and-analysis-of-business-data
Presentation and-analysis-of-business-dataPresentation and-analysis-of-business-data
Presentation and-analysis-of-business-datalovelyquintero
 
Presentation and-analysis-of-business-data
Presentation and-analysis-of-business-dataPresentation and-analysis-of-business-data
Presentation and-analysis-of-business-datalovelyquintero
 
Presentation and-analysis-of-business-data
Presentation and-analysis-of-business-dataPresentation and-analysis-of-business-data
Presentation and-analysis-of-business-datalovelyquintero
 
Data Mining: Concepts and Techniques — Chapter 2 —
Data Mining:  Concepts and Techniques — Chapter 2 —Data Mining:  Concepts and Techniques — Chapter 2 —
Data Mining: Concepts and Techniques — Chapter 2 —Salah Amean
 
Data mining :Concepts and Techniques Chapter 2, data
Data mining :Concepts and Techniques Chapter 2, dataData mining :Concepts and Techniques Chapter 2, data
Data mining :Concepts and Techniques Chapter 2, dataSalah Amean
 
2.1 frequency distributions, histograms, and related topics
2.1 frequency distributions, histograms, and related topics2.1 frequency distributions, histograms, and related topics
2.1 frequency distributions, histograms, and related topicsleblance
 
Data Representations
Data RepresentationsData Representations
Data Representationsbujols
 
Know Your Data in data mining applications
Know Your Data in data mining applicationsKnow Your Data in data mining applications
Know Your Data in data mining applicationsMaleehaSheikh2
 
Frequency distributions
Frequency distributionsFrequency distributions
Frequency distributionsMayuri Joshi
 
C2 Study Slides - MAT 151
C2 Study Slides - MAT 151C2 Study Slides - MAT 151
C2 Study Slides - MAT 151toni dimella
 

Similar to Frequency tables and line plots (20)

Chapter 2.4
Chapter 2.4Chapter 2.4
Chapter 2.4
 
LINE AND SCATTER DIAGRAM,FREQUENCY DISTRIBUTION
LINE AND SCATTER DIAGRAM,FREQUENCY DISTRIBUTIONLINE AND SCATTER DIAGRAM,FREQUENCY DISTRIBUTION
LINE AND SCATTER DIAGRAM,FREQUENCY DISTRIBUTION
 
graphic representations in statistics
 graphic representations in statistics graphic representations in statistics
graphic representations in statistics
 
3. data visualisations
3. data visualisations3. data visualisations
3. data visualisations
 
2.4 Scatterplots, correlation, and regression
2.4 Scatterplots, correlation, and regression2.4 Scatterplots, correlation, and regression
2.4 Scatterplots, correlation, and regression
 
Wynberg girls high-Jade Gibson-maths-data analysis statistics
Wynberg girls high-Jade Gibson-maths-data analysis statisticsWynberg girls high-Jade Gibson-maths-data analysis statistics
Wynberg girls high-Jade Gibson-maths-data analysis statistics
 
Introduction to Descriptive Statistics
Introduction to Descriptive StatisticsIntroduction to Descriptive Statistics
Introduction to Descriptive Statistics
 
Presentation and analysis of business data
Presentation and analysis of business dataPresentation and analysis of business data
Presentation and analysis of business data
 
Presentation and-analysis-of-business-data
Presentation and-analysis-of-business-dataPresentation and-analysis-of-business-data
Presentation and-analysis-of-business-data
 
Presentation and-analysis-of-business-data
Presentation and-analysis-of-business-dataPresentation and-analysis-of-business-data
Presentation and-analysis-of-business-data
 
Presentation and-analysis-of-business-data
Presentation and-analysis-of-business-dataPresentation and-analysis-of-business-data
Presentation and-analysis-of-business-data
 
Presentation and-analysis-of-business-data
Presentation and-analysis-of-business-dataPresentation and-analysis-of-business-data
Presentation and-analysis-of-business-data
 
Presentation and-analysis-of-business-data
Presentation and-analysis-of-business-dataPresentation and-analysis-of-business-data
Presentation and-analysis-of-business-data
 
Data Mining: Concepts and Techniques — Chapter 2 —
Data Mining:  Concepts and Techniques — Chapter 2 —Data Mining:  Concepts and Techniques — Chapter 2 —
Data Mining: Concepts and Techniques — Chapter 2 —
 
Data mining :Concepts and Techniques Chapter 2, data
Data mining :Concepts and Techniques Chapter 2, dataData mining :Concepts and Techniques Chapter 2, data
Data mining :Concepts and Techniques Chapter 2, data
 
2.1 frequency distributions, histograms, and related topics
2.1 frequency distributions, histograms, and related topics2.1 frequency distributions, histograms, and related topics
2.1 frequency distributions, histograms, and related topics
 
Data Representations
Data RepresentationsData Representations
Data Representations
 
Know Your Data in data mining applications
Know Your Data in data mining applicationsKnow Your Data in data mining applications
Know Your Data in data mining applications
 
Frequency distributions
Frequency distributionsFrequency distributions
Frequency distributions
 
C2 Study Slides - MAT 151
C2 Study Slides - MAT 151C2 Study Slides - MAT 151
C2 Study Slides - MAT 151
 

More from Cinnaminson Public Schools (20)

2015SupervisorResume
2015SupervisorResume2015SupervisorResume
2015SupervisorResume
 
1.8 lab
1.8 lab1.8 lab
1.8 lab
 
Budget project
Budget projectBudget project
Budget project
 
Scale drawing table
Scale drawing tableScale drawing table
Scale drawing table
 
Linear equation graphic
Linear equation graphicLinear equation graphic
Linear equation graphic
 
Slope
SlopeSlope
Slope
 
Scale drawing project
Scale drawing projectScale drawing project
Scale drawing project
 
Scale drawing do nows
Scale drawing do nowsScale drawing do nows
Scale drawing do nows
 
Lifeline project grade sheet (2)
Lifeline project grade sheet (2)Lifeline project grade sheet (2)
Lifeline project grade sheet (2)
 
Lifelineproject
LifelineprojectLifelineproject
Lifelineproject
 
Polygons and quadrilaterals
Polygons and quadrilateralsPolygons and quadrilaterals
Polygons and quadrilaterals
 
L4 angles in polygons
L4 angles in polygonsL4 angles in polygons
L4 angles in polygons
 
Congruent angles go
Congruent angles goCongruent angles go
Congruent angles go
 
Lesson 3 line and angle relationships
Lesson 3 line and angle relationshipsLesson 3 line and angle relationships
Lesson 3 line and angle relationships
 
Angle relationships
Angle relationshipsAngle relationships
Angle relationships
 
Angle relationships
Angle relationshipsAngle relationships
Angle relationships
 
Building blocks of geometry
Building blocks of geometryBuilding blocks of geometry
Building blocks of geometry
 
Sample questions 2013
Sample questions 2013Sample questions 2013
Sample questions 2013
 
7th ask prep jeopardy
7th ask prep jeopardy7th ask prep jeopardy
7th ask prep jeopardy
 
8th ask prep jeopardy
8th ask prep jeopardy8th ask prep jeopardy
8th ask prep jeopardy
 

Frequency tables and line plots

  • 2. Vocabulary Data - information, often given in the form of numbers or categories. Frequency Table – a table that displays the number of times each item or category occurs in a data set. Line Plot – a number line diagram that uses X marks to show the frequencies of items being tallied.
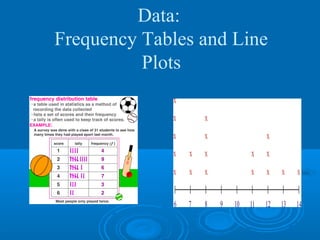
  • 4. Books Students Read Last Month (numerical) # of Books Tallies Frequency 1 llll 5 students 2 llll 5 3 llll l 6 4 ll 2 5 6 7 llll 4
  • 5. Making a Line Plot Is a visual of the frequency distribution. Line plots are NOT used for categorical data. Draw a number line whose scale starts at or before the minimum data value and stops at or after the maximum data value. Use a consistent increment.
  • 6. Completed Line Plot - When the items being tallied are numbers, a line plot can be used to visually display numerical data. A line plot uses X marks above a number line to show the frequencies. The X marks above the number line show X the frequencies. X X X The Number Line X X X X shows the number X X X X of books read. X X X X X X X X X X 1 2 3 4 5 6 7 Number of Books Read
  • 7. Making a Frequency Table Categorical data: data that can be placed into categories. Categorical question: What is your favorite color?
  • 8. Completed Frequency Table- Favorite Color (category) people Color Tallies Frequency Blue llll 5 Red lll 3 Yellow l 1 Purple ll 2 Orange llll 4 Green Black ll 2
  • 9. Variability in Data Distributions  Outliers-Unusually high or low values in a distribution.  Clusters-An group of data values with higher frequency than surrounding values.  Gaps-Areas in the scale where there is a lack of data values.
  • 10. Analyze the Data Now look at the Frequency Tables and the Line Plots from your notes to see if you can identify any outliers, clusters or gaps.