SlideShare a Scribd company logo
1 of 29
Download to read offline
INFRARED SPECTROSCOPY
Absorptions in infrared region of the electromagnetic spectrum
(hence the name)
Absorptions due to stretching and bending of covalent bonds in
molecules
Visible region – 400 to 800 nm
Visible wavelengths typically expressed in nanometers
(1 nm = 1 x 10⁻⁹
m)
Infrared region – wavelengths longer than visible
Infrared wavelengths typically expressed in micrometers
(1 µm = 1 x 10⁻⁶
m)
Typical infrared spectrum covers between 2.5 µm to 25 µm (2500
nm to 25000 nm)
Energy is inversely related to wavelength, so infrared light has less
energy than visible light
Typical units in infrared spectroscopy are wavenumbers (ν) - the
reciprocal of the wavelength (in centimeters)
2.5 µm = 2.5 x 10⁻⁴
cm =4000 cm-1
25 µm = 2.5 x 10⁻³
cm =400 cm-1
Thus your typical IR spectrum runs from 4000 to 400 cm-1
Wavenumber is directly related to energy; the higher the energy of
the absorption
1
Types of IR Absorptions
IR absorption occurs from the stretching and bending of the
covalent bonds in molecules
To be accompanied by IR absorption a stretch or bend must change
the dipole moment of the molecule
Molecules with symmetric bonds such as N2, O2, or F2 do not
absorb in the infrared since bond stretching does not change
the dipole moment of the molecule
The two primary modes of vibration are stretching and bending
Stretching modes are typically of higher energy than bending
modes
Stretching modes are often divided into two a symmetric and
asymmetric stretch; the asymmetric stretch is usually of
higher energy
2
The energy of the stretch decreases as the mass of the atoms is
increased
C-H 3000 cm-1
C-C 1200 cm-1
C-O 1100 cm-1
C-Cl 750 cm-1
C-I 500 cm-1
The energy of the stretch is related to the hybridization in the order
sp > sp2
> sp3
C-H sp 3300 cm-1
C-H sp2
3100 cm-1
C-H sp3
2900 cm-1
Dispersive IR Spectrometers
Beam from an IR source is split into two halves using a mirror
One beam is passed through a reference cell; the other is passed
through a sample cell
The two beams are alternately passed to the diffraction grating
using a beam chopper
Absorption of radiation is detected by comparing the two signals
Light is dispersed (spread into constituent wavelengths) by a
grating much as it would by be by a prism
The grating is slowly rotated, which changes the angle if
diffraction and which wavelengths are passed to the detector
3
Spectrum recorded in the frequency domain
FTIR Spectrometers
Most modern IR spectrometers are of this type
Spectrum obtained as a function of time rather than frequency; a
Fourier transform is used to convert from time domain to
frequency domain
Most are single-beam spectrometers
A background scan is first performed, then scan of the
sample, and the background scan is detected from the sample
scan by computer
4
Sample Preparation for IR Work
Three major methods of sample preparation
1. Sample is mixed with a mulling agent such mineral oil and
pressed between plates made of sodium chloride
Sodium chloride is used because it has no IR absorptions; glass
or plastic plates would have IR absorptions of their own
Sodium chloride plates are good from 4000 to 650 cm-1
; below
650 cm-1
they begin to absorb
Potassium bromide plates can be used in place of sodium
chloride and are transparent to 400 cm-1
, but they are more
expensive.
Downside of this method is absorptions due to the mineral oil
2. Sample is mixed with solid potassium bromide and pressed into
a pellet under high pressure
No absorptions from mulling agent
Only works for solids
3. Sample is dissolved in carbon tetrachloride and pressed between
salt plates
Downside of this method is absorptions due to the CCl4
5
Absorptions of Alkanes
C-H stretch occurs at 3000 – 2840 cm-1
CH2 bending modes at 1465 cm-1
CH3 bending absorption at 1375 cm-1
CH2 (four or more CH2 groups) rocking at 720 cm-1
Note lack of long-chain bend and CH3 bend in above spectrum
6
Absorptions in Alkenes
C-H stretch occurs in region of 3095 – 3010 cm-1
(note higher wavenumber relative to alkanes)
C=C stretch occurs in region of 1670 – 1640 cm-1
Can be used to determine type of substitution:
Symmetrically substituted does not absorb at all
A cis isomer absorbs more strongly than a trans isomer
(cis is less symmetrical than trans)
Simple monosubstituted absorbs at 1640 cm-1
Simple 1,1-disubstituted absorbs at 1650 cm-1
C-H out of plane bending (oop) absorbs at 1000 – 650 cm-1
Often very strong absorptions
Can be used to determine type of substitution:
Monosubstituted gives two peaks near 990 and 910 cm-1
1,2-disubstituted (cis) gives one strong band near 700 cm-1
1,2-disubstitued (trans) gives on band near 970 cm-1
1,1-disubstituted gives one strong band near 890 cm-1
A trisubstituted double bond absorbs near 815 cm-1
A tetrasubstituted double bond does not absorb at all
7
A monosubstituted alkene gives two strong peaks near 990 and 910
cm-1
A cis 1,2-disibstiuted alkene gives one strong band near 700 cm-1
Note that the C=C stretch is much less intense than for the
monosubstituted example
8
The strength of the C=C stretch can serve to differentiate between
cis and trans isomers
The cis isomer – more intense C=C stretch
Note the single large peak at 700 cm-1
(indicates cis isomer)
The trans isomer – less intense C=C stretch
Note the band near 970 cm–1
(indicates trans isomer)
9
Absorptions in Alkynes
C-H stretching frequency is approximately 3300 cm-1
(still higher than for alkanes or alkenes)
C-C stretch occurs at approximately 2150 cm-1
(but not observed if alkyne is symmetric)
An asymmetric alkyne
A asymmetric alkyne (no C-C stretch)
10
Example Problem 1
Shown below are spectra for cis and trans 3-hexen-1-ol. Assign a
structure to each.
Solution
11
Example Problem 2
Which of the following structures matches the spectrum shown
below?
Solution
12
Example Problem 3
Which of the following structures matches the spectrum shown
below?
13
Absorptions in Aromatic Compounds
C-H stretch occurs between 3050 and 3010 cm-1
C-H out-of-plane bending occurs at 900 – 690 cm-1
(useful for determining type of ring substitution)
C=C stretching often occurs in pairs at 1600 cm-1 and 1475 cm-1
Overtone and combination bands occur between 2000 and 1667
cm-1
Monosubstituted rings give strong absorptions at 690 cm-1
and 750
cm-1
(second may be masked by hydrocarbon solvent)
14
Ortho substituted rings give one strong band at 750 cm-1
Meta substituted rings gives bands at 690 cm-1
, 780 cm-1
, and
sometimes a third band of medium intensity at 880 cm-1
Para substituted rings give one band from 800 to 850 cm-1
15
Alcohols and Phenols
Hydrogen-bonded O-H stretching occurs as a very broad and
intense peak at 3400-3300 cm-1
Free O-H stretching (only observed when dilute) occurs at
3600 – 3650 cm-1
C-O-H bending - a broad and weak peak at 1550-1220 cm-1
C-O stretching occurs in range 1260 – 1000 cm-1
The position of the C-O stretch can be used to determine the type
of alcohol
Phenols – 1220 cm-1
Tertiary alcohols – 1150 cm-1
Secondary alcohols – 1100 cm-1
Primary alcohols – 1050 cm-1
16
17
Ethers
C-O stretch most important, occurs at 1300-1000 cm-1
In dialkyl ethers occurs as a strong band at 1120 cm-1
Aryl alkyl ethers give two peaks; asymmetric C-O-C stretch near
1250 cm-1 and a symmetric stretch near 1040 cm-1
Vinyl alkyl ethers give two peaks, a strong asymmetric stretch at
1220 cm-1 and a weak symmetric stretch near 850 cm-1
C-O stretches also occur in alcohols and esters, so look for O-H or
C=O stretches before concluding a compound is an ether
18
Aldehydes
Contains a C=O stretch at:
1740 – 1725 cm-1
for normal aliphatic aldehyde
1700 – 1680 cm-1
for conjugation with double bond
1700 – 1660 cm-1
for conjugation with phenyl group
Conjugation decreases the C-O bond order and therefore decreases
the stretching frequency
The (CO)-H stretch occurs as a pair of weak bands at 2860 – 2800
cm-1
and 2760 – 2700 cm-1
; the higher-frequency bands are often
masked by alkane C-H absorptions
Above band can help to differentiate between aldehydes and
ketones as these both have a carbonyl group
19
20
Ketones
Contains a C=O stretch at:
1720 – 1708 cm-1
for normal aliphatic aldehyde
(slightly lower frequency than for aldehydes)
1700 – 1675 cm-1
for conjugation with double bond
1700 – 1680 cm-1
for conjugation with one phenyl group
1670 – 1600 cm-1
for conjugation with two phenyl groups
~ 1716 cm-1
for 1,2 diketones (not conjugated)
~ 1680 cm-1
for 1,2 diketones (conjugated)
21
Carboxylic Acids
Carboxylic acids occur as hydrogen-bonded dimers unless in dilute
solution
C=0 stretch occurs in the following regions:
1730 – 1700 cm-1
for simple aliphatic acids in dimeric form
Occurs at lower frequencies if conjugated with an alkene or
aromatic
O-H stretch occurs as a very broad peak at 3400 to 2400 cm-1
, may
partially obscure C-H stretching bands
C-O stretch of medium intensity observed at 1320 –1210 cm-1
22
Esters
C=O stretch occurs at:
1750 – 1735 cm-1
for normal aliphatic esters
(example – ethyl butyrate, 1738 cm-1
)
1740 – 1750 cm-1
if carbonyl carbon conjugated with an alkene
(example – methyl methacrylate, 1725 cm-1
)
1740 – 1715 cm-1
if carbonyl carbon conjugated with aromatic
(example – methyl benzoate, 1724 cm-1
)
1765 – 1762 cm-1
if oxygen atom conjugated with alkene or
aromatic (note that this is a shift to higher frequency)
(example – phenyl acetate, 1765 cm-1
)
(example – vinyl acetate, 1762 cm-1)
The C-O stretch occurs as two bands, one stronger and broader
than the other, at 1300 – 1000 cm-1
Ethyl butryate – simple aliphatic ester
23
Vinyl acetate – alkene group adjacent to C=O group
Vinyl acetate – oxygen atom conjugated with alkene
Methyl benzoate – aromatic group adjacent to C=O group
24
Amines
N-H stretch occurs at 3500 –3300 cm-1
Primary amines – two bands
Secondary amines – one band; weak for aliphatic amines but
stronger for aromatic
Tertiary amines have no absorption in this region (no N-H
bonds)
N-H bending
Broad band at 1640 – 1560 cm-1
for primary amine
Secondary amines absorb at 1500 cm-1
N-H out of plane bending occurs at 800 cm-1
C-N stretching occurs at 1350 – 1000 cm-1
Butylamine – primary amine
25
Dibutyl amine – secondary amine
N-methyl aniline – secondary aromatic amine
26
Example 4
27
Example 5
Match each spectrum to the appropriate structure (try on your own
before jumping to solution)
28
Solution
29

More Related Content

What's hot

Infrared presentation
Infrared presentationInfrared presentation
Infrared presentationShiv Kumar
 
13 C NMR Spectroscopy with examples by Dr Anthony Crasto
13 C NMR Spectroscopy with examples by Dr Anthony Crasto13 C NMR Spectroscopy with examples by Dr Anthony Crasto
13 C NMR Spectroscopy with examples by Dr Anthony CrastoAnthony Melvin Crasto Ph.D
 
Chromophore concept
Chromophore conceptChromophore concept
Chromophore conceptaishuanju
 
Profil Peresepan Antihipertensi
Profil Peresepan AntihipertensiProfil Peresepan Antihipertensi
Profil Peresepan Antihipertensierlindri
 
Factors and applications of IR Spectroscopy
Factors and applications of IR SpectroscopyFactors and applications of IR Spectroscopy
Factors and applications of IR SpectroscopyKasturi Banerjee
 
UV VISIBLE SPECTROSCOPY.pptx
UV VISIBLE SPECTROSCOPY.pptxUV VISIBLE SPECTROSCOPY.pptx
UV VISIBLE SPECTROSCOPY.pptxianjalliyadav
 
HUBUNGAN STRUKTUR DAN AKTIVITAS OBAT OBAT Periper Nervous Sistem
HUBUNGAN STRUKTUR DAN AKTIVITAS OBAT OBAT Periper Nervous SistemHUBUNGAN STRUKTUR DAN AKTIVITAS OBAT OBAT Periper Nervous Sistem
HUBUNGAN STRUKTUR DAN AKTIVITAS OBAT OBAT Periper Nervous SistemSofiaNofianti
 
Nmr spin spin coupling
Nmr spin spin couplingNmr spin spin coupling
Nmr spin spin couplingArpitSuralkar
 
Uv-visible spectroscopy
Uv-visible spectroscopyUv-visible spectroscopy
Uv-visible spectroscopyMzgin Mohammed
 
Absorption & intensity shifts
Absorption  & intensity shiftsAbsorption  & intensity shifts
Absorption & intensity shiftsShanta Majumder
 
437072886 spektrofotometri-infra-red
437072886 spektrofotometri-infra-red437072886 spektrofotometri-infra-red
437072886 spektrofotometri-infra-red20010DindaAnggraini
 
IR interpretation and sample handling
 IR interpretation and sample handling  IR interpretation and sample handling
IR interpretation and sample handling Afzaye Rasul
 
NMR spectroscopy- Spin-lattice & spin-spin relaxation, signal splitting & sig...
NMR spectroscopy- Spin-lattice & spin-spin relaxation, signal splitting & sig...NMR spectroscopy- Spin-lattice & spin-spin relaxation, signal splitting & sig...
NMR spectroscopy- Spin-lattice & spin-spin relaxation, signal splitting & sig...AYESHA NAZEER
 
Flourimetry 140618015916-phpapp01 - copy
Flourimetry 140618015916-phpapp01 - copyFlourimetry 140618015916-phpapp01 - copy
Flourimetry 140618015916-phpapp01 - copyMANISH KUMAR
 
Pembahasan spektroskopi ftir fourier transform infra red
Pembahasan spektroskopi ftir fourier transform infra redPembahasan spektroskopi ftir fourier transform infra red
Pembahasan spektroskopi ftir fourier transform infra redUniversitas Gadjah Mada
 

What's hot (20)

Infrared presentation
Infrared presentationInfrared presentation
Infrared presentation
 
13 C NMR Spectroscopy with examples by Dr Anthony Crasto
13 C NMR Spectroscopy with examples by Dr Anthony Crasto13 C NMR Spectroscopy with examples by Dr Anthony Crasto
13 C NMR Spectroscopy with examples by Dr Anthony Crasto
 
Chromophore concept
Chromophore conceptChromophore concept
Chromophore concept
 
Profil Peresepan Antihipertensi
Profil Peresepan AntihipertensiProfil Peresepan Antihipertensi
Profil Peresepan Antihipertensi
 
Makromolekul
MakromolekulMakromolekul
Makromolekul
 
Factors and applications of IR Spectroscopy
Factors and applications of IR SpectroscopyFactors and applications of IR Spectroscopy
Factors and applications of IR Spectroscopy
 
Infrared spectroscopy
Infrared spectroscopy Infrared spectroscopy
Infrared spectroscopy
 
X – RAY DIFFRACTION
X – RAY DIFFRACTIONX – RAY DIFFRACTION
X – RAY DIFFRACTION
 
Ftir
FtirFtir
Ftir
 
UV VISIBLE SPECTROSCOPY.pptx
UV VISIBLE SPECTROSCOPY.pptxUV VISIBLE SPECTROSCOPY.pptx
UV VISIBLE SPECTROSCOPY.pptx
 
HUBUNGAN STRUKTUR DAN AKTIVITAS OBAT OBAT Periper Nervous Sistem
HUBUNGAN STRUKTUR DAN AKTIVITAS OBAT OBAT Periper Nervous SistemHUBUNGAN STRUKTUR DAN AKTIVITAS OBAT OBAT Periper Nervous Sistem
HUBUNGAN STRUKTUR DAN AKTIVITAS OBAT OBAT Periper Nervous Sistem
 
Nmr spin spin coupling
Nmr spin spin couplingNmr spin spin coupling
Nmr spin spin coupling
 
Uv-visible spectroscopy
Uv-visible spectroscopyUv-visible spectroscopy
Uv-visible spectroscopy
 
FT-NMR
FT-NMRFT-NMR
FT-NMR
 
Absorption & intensity shifts
Absorption  & intensity shiftsAbsorption  & intensity shifts
Absorption & intensity shifts
 
437072886 spektrofotometri-infra-red
437072886 spektrofotometri-infra-red437072886 spektrofotometri-infra-red
437072886 spektrofotometri-infra-red
 
IR interpretation and sample handling
 IR interpretation and sample handling  IR interpretation and sample handling
IR interpretation and sample handling
 
NMR spectroscopy- Spin-lattice & spin-spin relaxation, signal splitting & sig...
NMR spectroscopy- Spin-lattice & spin-spin relaxation, signal splitting & sig...NMR spectroscopy- Spin-lattice & spin-spin relaxation, signal splitting & sig...
NMR spectroscopy- Spin-lattice & spin-spin relaxation, signal splitting & sig...
 
Flourimetry 140618015916-phpapp01 - copy
Flourimetry 140618015916-phpapp01 - copyFlourimetry 140618015916-phpapp01 - copy
Flourimetry 140618015916-phpapp01 - copy
 
Pembahasan spektroskopi ftir fourier transform infra red
Pembahasan spektroskopi ftir fourier transform infra redPembahasan spektroskopi ftir fourier transform infra red
Pembahasan spektroskopi ftir fourier transform infra red
 

Similar to FT-IR

Infrared Spectroscopy (IR) - Overview & Interpretation
Infrared Spectroscopy (IR) - Overview & InterpretationInfrared Spectroscopy (IR) - Overview & Interpretation
Infrared Spectroscopy (IR) - Overview & InterpretationManoj Prajapati
 
Infrared spectrum / infrared frequency and hydrocarbons
Infrared spectrum / infrared frequency  and hydrocarbonsInfrared spectrum / infrared frequency  and hydrocarbons
Infrared spectrum / infrared frequency and hydrocarbonsRavish Yadav
 
Analytical Techniques FTIR - Instrumentation & Examples.pptx
Analytical Techniques FTIR - Instrumentation & Examples.pptxAnalytical Techniques FTIR - Instrumentation & Examples.pptx
Analytical Techniques FTIR - Instrumentation & Examples.pptxBrajadulalGhosh
 
استخدام جهاز ATR-FTIR
استخدام جهاز ATR-FTIRاستخدام جهاز ATR-FTIR
استخدام جهاز ATR-FTIRMohammedTahir35
 
استخدام جهاز ATR-FTIR
استخدام جهاز ATR-FTIRاستخدام جهاز ATR-FTIR
استخدام جهاز ATR-FTIRMohammed Taher
 
Fourier Transform Infrared (FT-IR) Spectroscopy
Fourier Transform Infrared (FT-IR) SpectroscopyFourier Transform Infrared (FT-IR) Spectroscopy
Fourier Transform Infrared (FT-IR) Spectroscopynivedithag131
 
Interpretation of IR Spectra PPT ( Pranjali Yadav )
Interpretation of IR Spectra  PPT ( Pranjali Yadav )Interpretation of IR Spectra  PPT ( Pranjali Yadav )
Interpretation of IR Spectra PPT ( Pranjali Yadav )PranjaliYadav8
 
INFRA- RED SPECTROSCOPY.pdf.pptx
INFRA- RED SPECTROSCOPY.pdf.pptxINFRA- RED SPECTROSCOPY.pdf.pptx
INFRA- RED SPECTROSCOPY.pdf.pptxRitulVasani
 
An introduction to UV-IR spectroscopy
An introduction to UV-IR spectroscopyAn introduction to UV-IR spectroscopy
An introduction to UV-IR spectroscopyDaruosh Shafiee
 
Ir interpretation
Ir interpretationIr interpretation
Ir interpretationbinu anand
 
Introduction to infrared spectrometry
Introduction to infrared spectrometryIntroduction to infrared spectrometry
Introduction to infrared spectrometryRoshen Reji Idiculla
 
INTERPRETATION OF IR SPECTROSCOPY
INTERPRETATION OF IR SPECTROSCOPYINTERPRETATION OF IR SPECTROSCOPY
INTERPRETATION OF IR SPECTROSCOPYOORATHI SASIVARDHAN
 
IR Spectra Interpretation
IR Spectra InterpretationIR Spectra Interpretation
IR Spectra InterpretationGanesh Shinde
 

Similar to FT-IR (20)

Infrared Spectroscopy (IR) - Overview & Interpretation
Infrared Spectroscopy (IR) - Overview & InterpretationInfrared Spectroscopy (IR) - Overview & Interpretation
Infrared Spectroscopy (IR) - Overview & Interpretation
 
Infrared spectrum / infrared frequency and hydrocarbons
Infrared spectrum / infrared frequency  and hydrocarbonsInfrared spectrum / infrared frequency  and hydrocarbons
Infrared spectrum / infrared frequency and hydrocarbons
 
Analytical Techniques FTIR - Instrumentation & Examples.pptx
Analytical Techniques FTIR - Instrumentation & Examples.pptxAnalytical Techniques FTIR - Instrumentation & Examples.pptx
Analytical Techniques FTIR - Instrumentation & Examples.pptx
 
استخدام جهاز ATR-FTIR
استخدام جهاز ATR-FTIRاستخدام جهاز ATR-FTIR
استخدام جهاز ATR-FTIR
 
Infra Red Spectroscopy
Infra Red SpectroscopyInfra Red Spectroscopy
Infra Red Spectroscopy
 
استخدام جهاز ATR-FTIR
استخدام جهاز ATR-FTIRاستخدام جهاز ATR-FTIR
استخدام جهاز ATR-FTIR
 
Fourier Transform Infrared (FT-IR) Spectroscopy
Fourier Transform Infrared (FT-IR) SpectroscopyFourier Transform Infrared (FT-IR) Spectroscopy
Fourier Transform Infrared (FT-IR) Spectroscopy
 
IR.pptx
IR.pptxIR.pptx
IR.pptx
 
Interpretation of IR Spectra PPT ( Pranjali Yadav )
Interpretation of IR Spectra  PPT ( Pranjali Yadav )Interpretation of IR Spectra  PPT ( Pranjali Yadav )
Interpretation of IR Spectra PPT ( Pranjali Yadav )
 
INFRA- RED SPECTROSCOPY.pdf.pptx
INFRA- RED SPECTROSCOPY.pdf.pptxINFRA- RED SPECTROSCOPY.pdf.pptx
INFRA- RED SPECTROSCOPY.pdf.pptx
 
An introduction to UV-IR spectroscopy
An introduction to UV-IR spectroscopyAn introduction to UV-IR spectroscopy
An introduction to UV-IR spectroscopy
 
Ir interpretation
Ir interpretationIr interpretation
Ir interpretation
 
Introduction to infrared spectrometry
Introduction to infrared spectrometryIntroduction to infrared spectrometry
Introduction to infrared spectrometry
 
IMPORTANCE OF IR SPECTROSCOPY IN STRUCTURAL ELUCIDATION OF ORGANIC COMPOUNDS
IMPORTANCE OF IR SPECTROSCOPY IN STRUCTURAL ELUCIDATION OF ORGANIC COMPOUNDSIMPORTANCE OF IR SPECTROSCOPY IN STRUCTURAL ELUCIDATION OF ORGANIC COMPOUNDS
IMPORTANCE OF IR SPECTROSCOPY IN STRUCTURAL ELUCIDATION OF ORGANIC COMPOUNDS
 
2 PraktIPATerpadu-IR Spectroscopy.pptx
2 PraktIPATerpadu-IR Spectroscopy.pptx2 PraktIPATerpadu-IR Spectroscopy.pptx
2 PraktIPATerpadu-IR Spectroscopy.pptx
 
INTERPRETATION OF IR SPECTROSCOPY
INTERPRETATION OF IR SPECTROSCOPYINTERPRETATION OF IR SPECTROSCOPY
INTERPRETATION OF IR SPECTROSCOPY
 
IR Interpretation
IR InterpretationIR Interpretation
IR Interpretation
 
IR Spectra Interpretation
IR Spectra InterpretationIR Spectra Interpretation
IR Spectra Interpretation
 
Ir lecture-2010
Ir lecture-2010Ir lecture-2010
Ir lecture-2010
 
IR SPECTROSCOPY.ppt
IR SPECTROSCOPY.pptIR SPECTROSCOPY.ppt
IR SPECTROSCOPY.ppt
 

Recently uploaded

GBSN - Microbiology (Unit 1)
GBSN - Microbiology (Unit 1)GBSN - Microbiology (Unit 1)
GBSN - Microbiology (Unit 1)Areesha Ahmad
 
Chromatin Structure | EUCHROMATIN | HETEROCHROMATIN
Chromatin Structure | EUCHROMATIN | HETEROCHROMATINChromatin Structure | EUCHROMATIN | HETEROCHROMATIN
Chromatin Structure | EUCHROMATIN | HETEROCHROMATINsankalpkumarsahoo174
 
Chemistry 4th semester series (krishna).pdf
Chemistry 4th semester series (krishna).pdfChemistry 4th semester series (krishna).pdf
Chemistry 4th semester series (krishna).pdfSumit Kumar yadav
 
Green chemistry and Sustainable development.pptx
Green chemistry  and Sustainable development.pptxGreen chemistry  and Sustainable development.pptx
Green chemistry and Sustainable development.pptxRajatChauhan518211
 
GBSN - Biochemistry (Unit 1)
GBSN - Biochemistry (Unit 1)GBSN - Biochemistry (Unit 1)
GBSN - Biochemistry (Unit 1)Areesha Ahmad
 
Biological Classification BioHack (3).pdf
Biological Classification BioHack (3).pdfBiological Classification BioHack (3).pdf
Biological Classification BioHack (3).pdfmuntazimhurra
 
VIRUSES structure and classification ppt by Dr.Prince C P
VIRUSES structure and classification ppt by Dr.Prince C PVIRUSES structure and classification ppt by Dr.Prince C P
VIRUSES structure and classification ppt by Dr.Prince C PPRINCE C P
 
TEST BANK For Radiologic Science for Technologists, 12th Edition by Stewart C...
TEST BANK For Radiologic Science for Technologists, 12th Edition by Stewart C...TEST BANK For Radiologic Science for Technologists, 12th Edition by Stewart C...
TEST BANK For Radiologic Science for Technologists, 12th Edition by Stewart C...ssifa0344
 
Presentation Vikram Lander by Vedansh Gupta.pptx
Presentation Vikram Lander by Vedansh Gupta.pptxPresentation Vikram Lander by Vedansh Gupta.pptx
Presentation Vikram Lander by Vedansh Gupta.pptxgindu3009
 
CALL ON ➥8923113531 🔝Call Girls Kesar Bagh Lucknow best Night Fun service 🪡
CALL ON ➥8923113531 🔝Call Girls Kesar Bagh Lucknow best Night Fun service  🪡CALL ON ➥8923113531 🔝Call Girls Kesar Bagh Lucknow best Night Fun service  🪡
CALL ON ➥8923113531 🔝Call Girls Kesar Bagh Lucknow best Night Fun service 🪡anilsa9823
 
Recombinant DNA technology (Immunological screening)
Recombinant DNA technology (Immunological screening)Recombinant DNA technology (Immunological screening)
Recombinant DNA technology (Immunological screening)PraveenaKalaiselvan1
 
Labelling Requirements and Label Claims for Dietary Supplements and Recommend...
Labelling Requirements and Label Claims for Dietary Supplements and Recommend...Labelling Requirements and Label Claims for Dietary Supplements and Recommend...
Labelling Requirements and Label Claims for Dietary Supplements and Recommend...Lokesh Kothari
 
All-domain Anomaly Resolution Office U.S. Department of Defense (U) Case: “Eg...
All-domain Anomaly Resolution Office U.S. Department of Defense (U) Case: “Eg...All-domain Anomaly Resolution Office U.S. Department of Defense (U) Case: “Eg...
All-domain Anomaly Resolution Office U.S. Department of Defense (U) Case: “Eg...Sérgio Sacani
 
Botany krishna series 2nd semester Only Mcq type questions
Botany krishna series 2nd semester Only Mcq type questionsBotany krishna series 2nd semester Only Mcq type questions
Botany krishna series 2nd semester Only Mcq type questionsSumit Kumar yadav
 
PossibleEoarcheanRecordsoftheGeomagneticFieldPreservedintheIsuaSupracrustalBe...
PossibleEoarcheanRecordsoftheGeomagneticFieldPreservedintheIsuaSupracrustalBe...PossibleEoarcheanRecordsoftheGeomagneticFieldPreservedintheIsuaSupracrustalBe...
PossibleEoarcheanRecordsoftheGeomagneticFieldPreservedintheIsuaSupracrustalBe...Sérgio Sacani
 
Nightside clouds and disequilibrium chemistry on the hot Jupiter WASP-43b
Nightside clouds and disequilibrium chemistry on the hot Jupiter WASP-43bNightside clouds and disequilibrium chemistry on the hot Jupiter WASP-43b
Nightside clouds and disequilibrium chemistry on the hot Jupiter WASP-43bSérgio Sacani
 
Zoology 4th semester series (krishna).pdf
Zoology 4th semester series (krishna).pdfZoology 4th semester series (krishna).pdf
Zoology 4th semester series (krishna).pdfSumit Kumar yadav
 
Botany 4th semester file By Sumit Kumar yadav.pdf
Botany 4th semester file By Sumit Kumar yadav.pdfBotany 4th semester file By Sumit Kumar yadav.pdf
Botany 4th semester file By Sumit Kumar yadav.pdfSumit Kumar yadav
 
Asymmetry in the atmosphere of the ultra-hot Jupiter WASP-76 b
Asymmetry in the atmosphere of the ultra-hot Jupiter WASP-76 bAsymmetry in the atmosphere of the ultra-hot Jupiter WASP-76 b
Asymmetry in the atmosphere of the ultra-hot Jupiter WASP-76 bSérgio Sacani
 

Recently uploaded (20)

GBSN - Microbiology (Unit 1)
GBSN - Microbiology (Unit 1)GBSN - Microbiology (Unit 1)
GBSN - Microbiology (Unit 1)
 
Chromatin Structure | EUCHROMATIN | HETEROCHROMATIN
Chromatin Structure | EUCHROMATIN | HETEROCHROMATINChromatin Structure | EUCHROMATIN | HETEROCHROMATIN
Chromatin Structure | EUCHROMATIN | HETEROCHROMATIN
 
Chemistry 4th semester series (krishna).pdf
Chemistry 4th semester series (krishna).pdfChemistry 4th semester series (krishna).pdf
Chemistry 4th semester series (krishna).pdf
 
Green chemistry and Sustainable development.pptx
Green chemistry  and Sustainable development.pptxGreen chemistry  and Sustainable development.pptx
Green chemistry and Sustainable development.pptx
 
GBSN - Biochemistry (Unit 1)
GBSN - Biochemistry (Unit 1)GBSN - Biochemistry (Unit 1)
GBSN - Biochemistry (Unit 1)
 
Biological Classification BioHack (3).pdf
Biological Classification BioHack (3).pdfBiological Classification BioHack (3).pdf
Biological Classification BioHack (3).pdf
 
VIRUSES structure and classification ppt by Dr.Prince C P
VIRUSES structure and classification ppt by Dr.Prince C PVIRUSES structure and classification ppt by Dr.Prince C P
VIRUSES structure and classification ppt by Dr.Prince C P
 
CELL -Structural and Functional unit of life.pdf
CELL -Structural and Functional unit of life.pdfCELL -Structural and Functional unit of life.pdf
CELL -Structural and Functional unit of life.pdf
 
TEST BANK For Radiologic Science for Technologists, 12th Edition by Stewart C...
TEST BANK For Radiologic Science for Technologists, 12th Edition by Stewart C...TEST BANK For Radiologic Science for Technologists, 12th Edition by Stewart C...
TEST BANK For Radiologic Science for Technologists, 12th Edition by Stewart C...
 
Presentation Vikram Lander by Vedansh Gupta.pptx
Presentation Vikram Lander by Vedansh Gupta.pptxPresentation Vikram Lander by Vedansh Gupta.pptx
Presentation Vikram Lander by Vedansh Gupta.pptx
 
CALL ON ➥8923113531 🔝Call Girls Kesar Bagh Lucknow best Night Fun service 🪡
CALL ON ➥8923113531 🔝Call Girls Kesar Bagh Lucknow best Night Fun service  🪡CALL ON ➥8923113531 🔝Call Girls Kesar Bagh Lucknow best Night Fun service  🪡
CALL ON ➥8923113531 🔝Call Girls Kesar Bagh Lucknow best Night Fun service 🪡
 
Recombinant DNA technology (Immunological screening)
Recombinant DNA technology (Immunological screening)Recombinant DNA technology (Immunological screening)
Recombinant DNA technology (Immunological screening)
 
Labelling Requirements and Label Claims for Dietary Supplements and Recommend...
Labelling Requirements and Label Claims for Dietary Supplements and Recommend...Labelling Requirements and Label Claims for Dietary Supplements and Recommend...
Labelling Requirements and Label Claims for Dietary Supplements and Recommend...
 
All-domain Anomaly Resolution Office U.S. Department of Defense (U) Case: “Eg...
All-domain Anomaly Resolution Office U.S. Department of Defense (U) Case: “Eg...All-domain Anomaly Resolution Office U.S. Department of Defense (U) Case: “Eg...
All-domain Anomaly Resolution Office U.S. Department of Defense (U) Case: “Eg...
 
Botany krishna series 2nd semester Only Mcq type questions
Botany krishna series 2nd semester Only Mcq type questionsBotany krishna series 2nd semester Only Mcq type questions
Botany krishna series 2nd semester Only Mcq type questions
 
PossibleEoarcheanRecordsoftheGeomagneticFieldPreservedintheIsuaSupracrustalBe...
PossibleEoarcheanRecordsoftheGeomagneticFieldPreservedintheIsuaSupracrustalBe...PossibleEoarcheanRecordsoftheGeomagneticFieldPreservedintheIsuaSupracrustalBe...
PossibleEoarcheanRecordsoftheGeomagneticFieldPreservedintheIsuaSupracrustalBe...
 
Nightside clouds and disequilibrium chemistry on the hot Jupiter WASP-43b
Nightside clouds and disequilibrium chemistry on the hot Jupiter WASP-43bNightside clouds and disequilibrium chemistry on the hot Jupiter WASP-43b
Nightside clouds and disequilibrium chemistry on the hot Jupiter WASP-43b
 
Zoology 4th semester series (krishna).pdf
Zoology 4th semester series (krishna).pdfZoology 4th semester series (krishna).pdf
Zoology 4th semester series (krishna).pdf
 
Botany 4th semester file By Sumit Kumar yadav.pdf
Botany 4th semester file By Sumit Kumar yadav.pdfBotany 4th semester file By Sumit Kumar yadav.pdf
Botany 4th semester file By Sumit Kumar yadav.pdf
 
Asymmetry in the atmosphere of the ultra-hot Jupiter WASP-76 b
Asymmetry in the atmosphere of the ultra-hot Jupiter WASP-76 bAsymmetry in the atmosphere of the ultra-hot Jupiter WASP-76 b
Asymmetry in the atmosphere of the ultra-hot Jupiter WASP-76 b
 

FT-IR

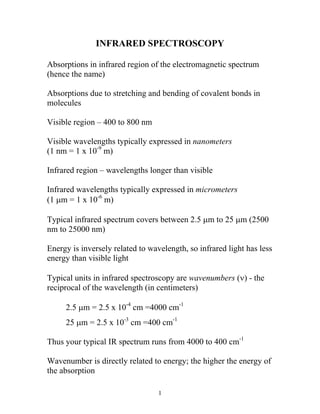
  • 1. INFRARED SPECTROSCOPY Absorptions in infrared region of the electromagnetic spectrum (hence the name) Absorptions due to stretching and bending of covalent bonds in molecules Visible region – 400 to 800 nm Visible wavelengths typically expressed in nanometers (1 nm = 1 x 10⁻⁹ m) Infrared region – wavelengths longer than visible Infrared wavelengths typically expressed in micrometers (1 µm = 1 x 10⁻⁶ m) Typical infrared spectrum covers between 2.5 µm to 25 µm (2500 nm to 25000 nm) Energy is inversely related to wavelength, so infrared light has less energy than visible light Typical units in infrared spectroscopy are wavenumbers (ν) - the reciprocal of the wavelength (in centimeters) 2.5 µm = 2.5 x 10⁻⁴ cm =4000 cm-1 25 µm = 2.5 x 10⁻³ cm =400 cm-1 Thus your typical IR spectrum runs from 4000 to 400 cm-1 Wavenumber is directly related to energy; the higher the energy of the absorption 1
  • 2. Types of IR Absorptions IR absorption occurs from the stretching and bending of the covalent bonds in molecules To be accompanied by IR absorption a stretch or bend must change the dipole moment of the molecule Molecules with symmetric bonds such as N2, O2, or F2 do not absorb in the infrared since bond stretching does not change the dipole moment of the molecule The two primary modes of vibration are stretching and bending Stretching modes are typically of higher energy than bending modes Stretching modes are often divided into two a symmetric and asymmetric stretch; the asymmetric stretch is usually of higher energy 2
  • 3. The energy of the stretch decreases as the mass of the atoms is increased C-H 3000 cm-1 C-C 1200 cm-1 C-O 1100 cm-1 C-Cl 750 cm-1 C-I 500 cm-1 The energy of the stretch is related to the hybridization in the order sp > sp2 > sp3 C-H sp 3300 cm-1 C-H sp2 3100 cm-1 C-H sp3 2900 cm-1 Dispersive IR Spectrometers Beam from an IR source is split into two halves using a mirror One beam is passed through a reference cell; the other is passed through a sample cell The two beams are alternately passed to the diffraction grating using a beam chopper Absorption of radiation is detected by comparing the two signals Light is dispersed (spread into constituent wavelengths) by a grating much as it would by be by a prism The grating is slowly rotated, which changes the angle if diffraction and which wavelengths are passed to the detector 3
  • 4. Spectrum recorded in the frequency domain FTIR Spectrometers Most modern IR spectrometers are of this type Spectrum obtained as a function of time rather than frequency; a Fourier transform is used to convert from time domain to frequency domain Most are single-beam spectrometers A background scan is first performed, then scan of the sample, and the background scan is detected from the sample scan by computer 4
  • 5. Sample Preparation for IR Work Three major methods of sample preparation 1. Sample is mixed with a mulling agent such mineral oil and pressed between plates made of sodium chloride Sodium chloride is used because it has no IR absorptions; glass or plastic plates would have IR absorptions of their own Sodium chloride plates are good from 4000 to 650 cm-1 ; below 650 cm-1 they begin to absorb Potassium bromide plates can be used in place of sodium chloride and are transparent to 400 cm-1 , but they are more expensive. Downside of this method is absorptions due to the mineral oil 2. Sample is mixed with solid potassium bromide and pressed into a pellet under high pressure No absorptions from mulling agent Only works for solids 3. Sample is dissolved in carbon tetrachloride and pressed between salt plates Downside of this method is absorptions due to the CCl4 5
  • 6. Absorptions of Alkanes C-H stretch occurs at 3000 – 2840 cm-1 CH2 bending modes at 1465 cm-1 CH3 bending absorption at 1375 cm-1 CH2 (four or more CH2 groups) rocking at 720 cm-1 Note lack of long-chain bend and CH3 bend in above spectrum 6
  • 7. Absorptions in Alkenes C-H stretch occurs in region of 3095 – 3010 cm-1 (note higher wavenumber relative to alkanes) C=C stretch occurs in region of 1670 – 1640 cm-1 Can be used to determine type of substitution: Symmetrically substituted does not absorb at all A cis isomer absorbs more strongly than a trans isomer (cis is less symmetrical than trans) Simple monosubstituted absorbs at 1640 cm-1 Simple 1,1-disubstituted absorbs at 1650 cm-1 C-H out of plane bending (oop) absorbs at 1000 – 650 cm-1 Often very strong absorptions Can be used to determine type of substitution: Monosubstituted gives two peaks near 990 and 910 cm-1 1,2-disubstituted (cis) gives one strong band near 700 cm-1 1,2-disubstitued (trans) gives on band near 970 cm-1 1,1-disubstituted gives one strong band near 890 cm-1 A trisubstituted double bond absorbs near 815 cm-1 A tetrasubstituted double bond does not absorb at all 7
  • 8. A monosubstituted alkene gives two strong peaks near 990 and 910 cm-1 A cis 1,2-disibstiuted alkene gives one strong band near 700 cm-1 Note that the C=C stretch is much less intense than for the monosubstituted example 8
  • 9. The strength of the C=C stretch can serve to differentiate between cis and trans isomers The cis isomer – more intense C=C stretch Note the single large peak at 700 cm-1 (indicates cis isomer) The trans isomer – less intense C=C stretch Note the band near 970 cm–1 (indicates trans isomer) 9
  • 10. Absorptions in Alkynes C-H stretching frequency is approximately 3300 cm-1 (still higher than for alkanes or alkenes) C-C stretch occurs at approximately 2150 cm-1 (but not observed if alkyne is symmetric) An asymmetric alkyne A asymmetric alkyne (no C-C stretch) 10
  • 11. Example Problem 1 Shown below are spectra for cis and trans 3-hexen-1-ol. Assign a structure to each. Solution 11
  • 12. Example Problem 2 Which of the following structures matches the spectrum shown below? Solution 12
  • 13. Example Problem 3 Which of the following structures matches the spectrum shown below? 13
  • 14. Absorptions in Aromatic Compounds C-H stretch occurs between 3050 and 3010 cm-1 C-H out-of-plane bending occurs at 900 – 690 cm-1 (useful for determining type of ring substitution) C=C stretching often occurs in pairs at 1600 cm-1 and 1475 cm-1 Overtone and combination bands occur between 2000 and 1667 cm-1 Monosubstituted rings give strong absorptions at 690 cm-1 and 750 cm-1 (second may be masked by hydrocarbon solvent) 14
  • 15. Ortho substituted rings give one strong band at 750 cm-1 Meta substituted rings gives bands at 690 cm-1 , 780 cm-1 , and sometimes a third band of medium intensity at 880 cm-1 Para substituted rings give one band from 800 to 850 cm-1 15
  • 16. Alcohols and Phenols Hydrogen-bonded O-H stretching occurs as a very broad and intense peak at 3400-3300 cm-1 Free O-H stretching (only observed when dilute) occurs at 3600 – 3650 cm-1 C-O-H bending - a broad and weak peak at 1550-1220 cm-1 C-O stretching occurs in range 1260 – 1000 cm-1 The position of the C-O stretch can be used to determine the type of alcohol Phenols – 1220 cm-1 Tertiary alcohols – 1150 cm-1 Secondary alcohols – 1100 cm-1 Primary alcohols – 1050 cm-1 16
  • 17. 17
  • 18. Ethers C-O stretch most important, occurs at 1300-1000 cm-1 In dialkyl ethers occurs as a strong band at 1120 cm-1 Aryl alkyl ethers give two peaks; asymmetric C-O-C stretch near 1250 cm-1 and a symmetric stretch near 1040 cm-1 Vinyl alkyl ethers give two peaks, a strong asymmetric stretch at 1220 cm-1 and a weak symmetric stretch near 850 cm-1 C-O stretches also occur in alcohols and esters, so look for O-H or C=O stretches before concluding a compound is an ether 18
  • 19. Aldehydes Contains a C=O stretch at: 1740 – 1725 cm-1 for normal aliphatic aldehyde 1700 – 1680 cm-1 for conjugation with double bond 1700 – 1660 cm-1 for conjugation with phenyl group Conjugation decreases the C-O bond order and therefore decreases the stretching frequency The (CO)-H stretch occurs as a pair of weak bands at 2860 – 2800 cm-1 and 2760 – 2700 cm-1 ; the higher-frequency bands are often masked by alkane C-H absorptions Above band can help to differentiate between aldehydes and ketones as these both have a carbonyl group 19
  • 20. 20
  • 21. Ketones Contains a C=O stretch at: 1720 – 1708 cm-1 for normal aliphatic aldehyde (slightly lower frequency than for aldehydes) 1700 – 1675 cm-1 for conjugation with double bond 1700 – 1680 cm-1 for conjugation with one phenyl group 1670 – 1600 cm-1 for conjugation with two phenyl groups ~ 1716 cm-1 for 1,2 diketones (not conjugated) ~ 1680 cm-1 for 1,2 diketones (conjugated) 21
  • 22. Carboxylic Acids Carboxylic acids occur as hydrogen-bonded dimers unless in dilute solution C=0 stretch occurs in the following regions: 1730 – 1700 cm-1 for simple aliphatic acids in dimeric form Occurs at lower frequencies if conjugated with an alkene or aromatic O-H stretch occurs as a very broad peak at 3400 to 2400 cm-1 , may partially obscure C-H stretching bands C-O stretch of medium intensity observed at 1320 –1210 cm-1 22
  • 23. Esters C=O stretch occurs at: 1750 – 1735 cm-1 for normal aliphatic esters (example – ethyl butyrate, 1738 cm-1 ) 1740 – 1750 cm-1 if carbonyl carbon conjugated with an alkene (example – methyl methacrylate, 1725 cm-1 ) 1740 – 1715 cm-1 if carbonyl carbon conjugated with aromatic (example – methyl benzoate, 1724 cm-1 ) 1765 – 1762 cm-1 if oxygen atom conjugated with alkene or aromatic (note that this is a shift to higher frequency) (example – phenyl acetate, 1765 cm-1 ) (example – vinyl acetate, 1762 cm-1) The C-O stretch occurs as two bands, one stronger and broader than the other, at 1300 – 1000 cm-1 Ethyl butryate – simple aliphatic ester 23
  • 24. Vinyl acetate – alkene group adjacent to C=O group Vinyl acetate – oxygen atom conjugated with alkene Methyl benzoate – aromatic group adjacent to C=O group 24
  • 25. Amines N-H stretch occurs at 3500 –3300 cm-1 Primary amines – two bands Secondary amines – one band; weak for aliphatic amines but stronger for aromatic Tertiary amines have no absorption in this region (no N-H bonds) N-H bending Broad band at 1640 – 1560 cm-1 for primary amine Secondary amines absorb at 1500 cm-1 N-H out of plane bending occurs at 800 cm-1 C-N stretching occurs at 1350 – 1000 cm-1 Butylamine – primary amine 25
  • 26. Dibutyl amine – secondary amine N-methyl aniline – secondary aromatic amine 26
  • 28. Example 5 Match each spectrum to the appropriate structure (try on your own before jumping to solution) 28