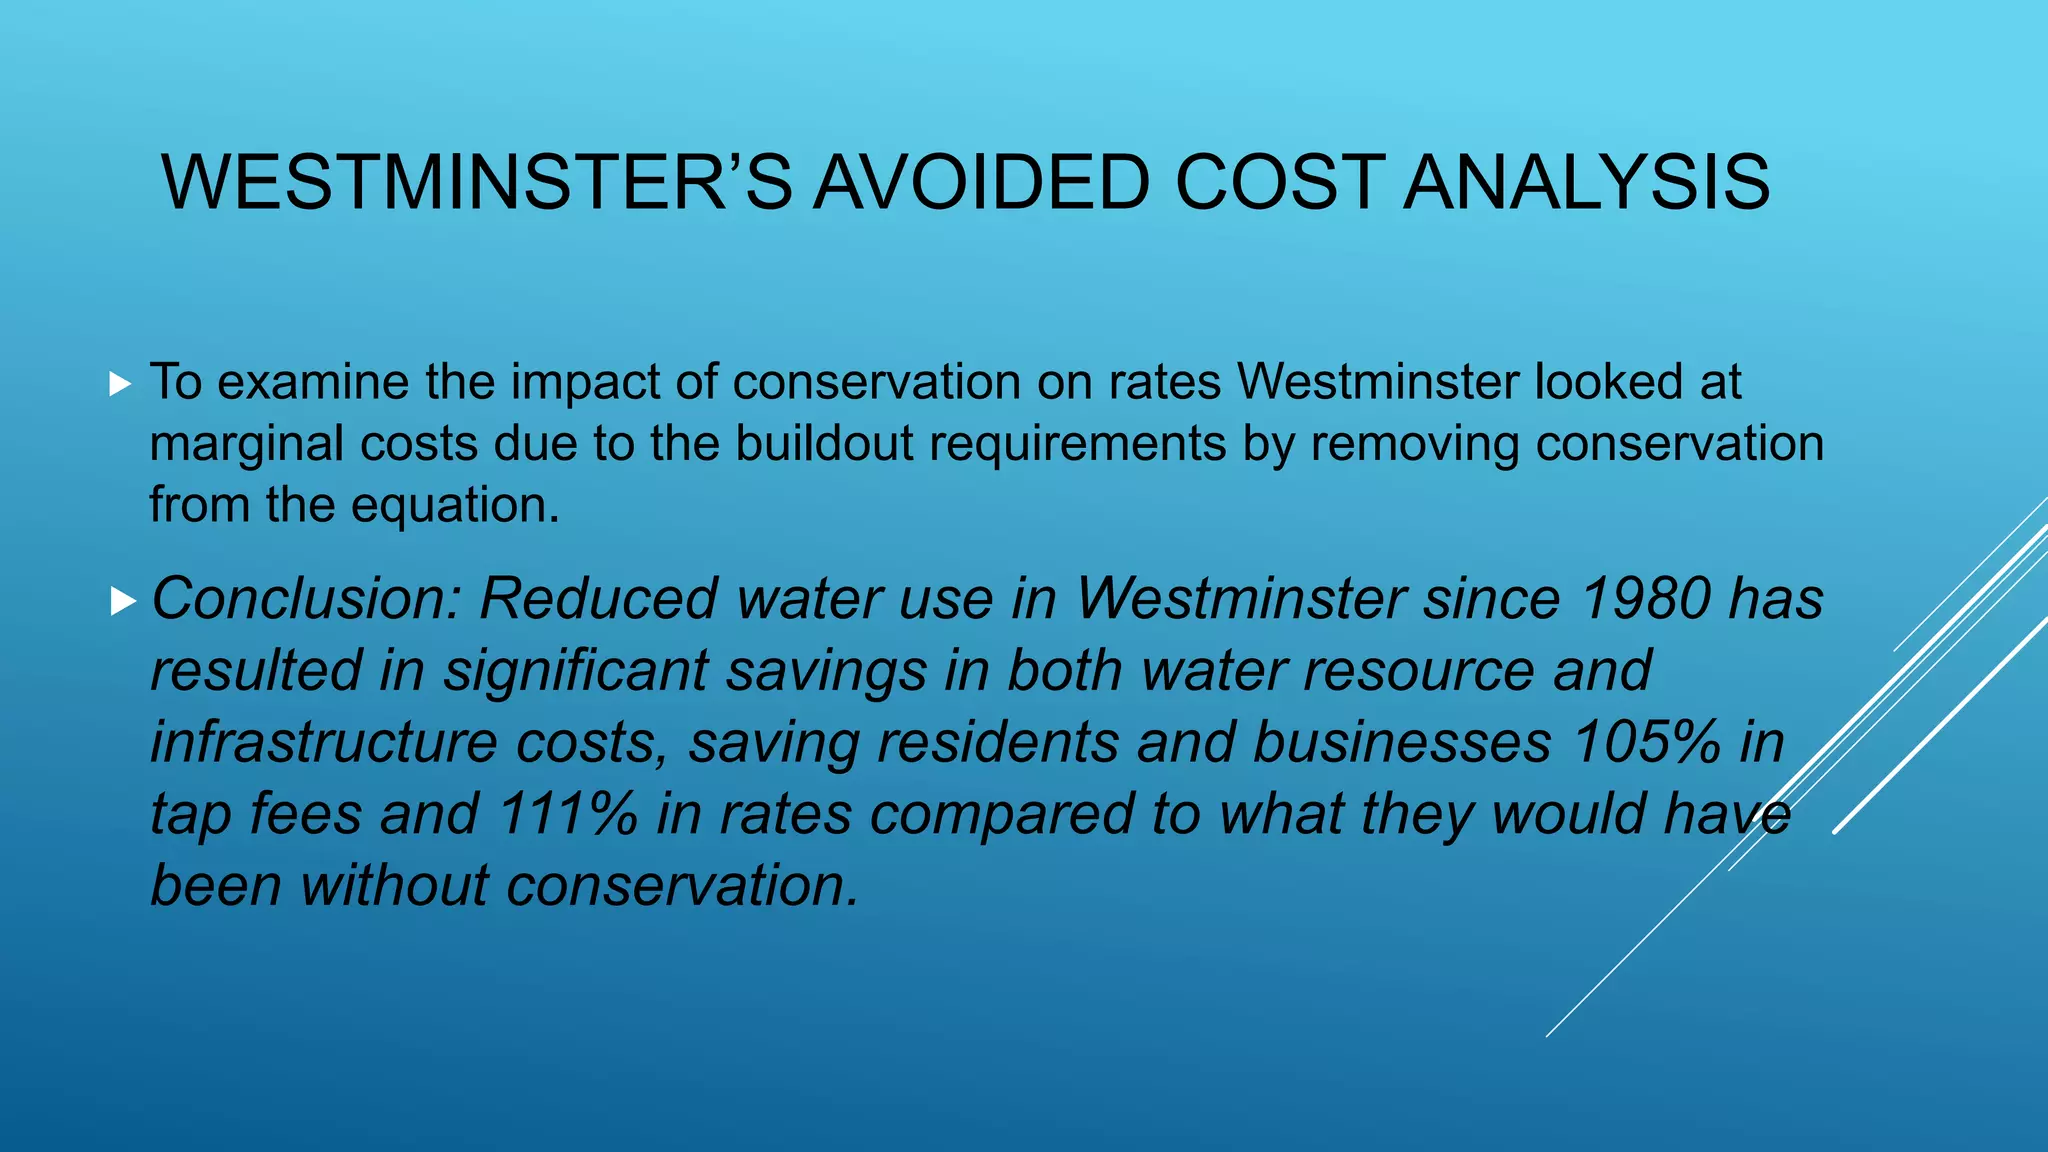
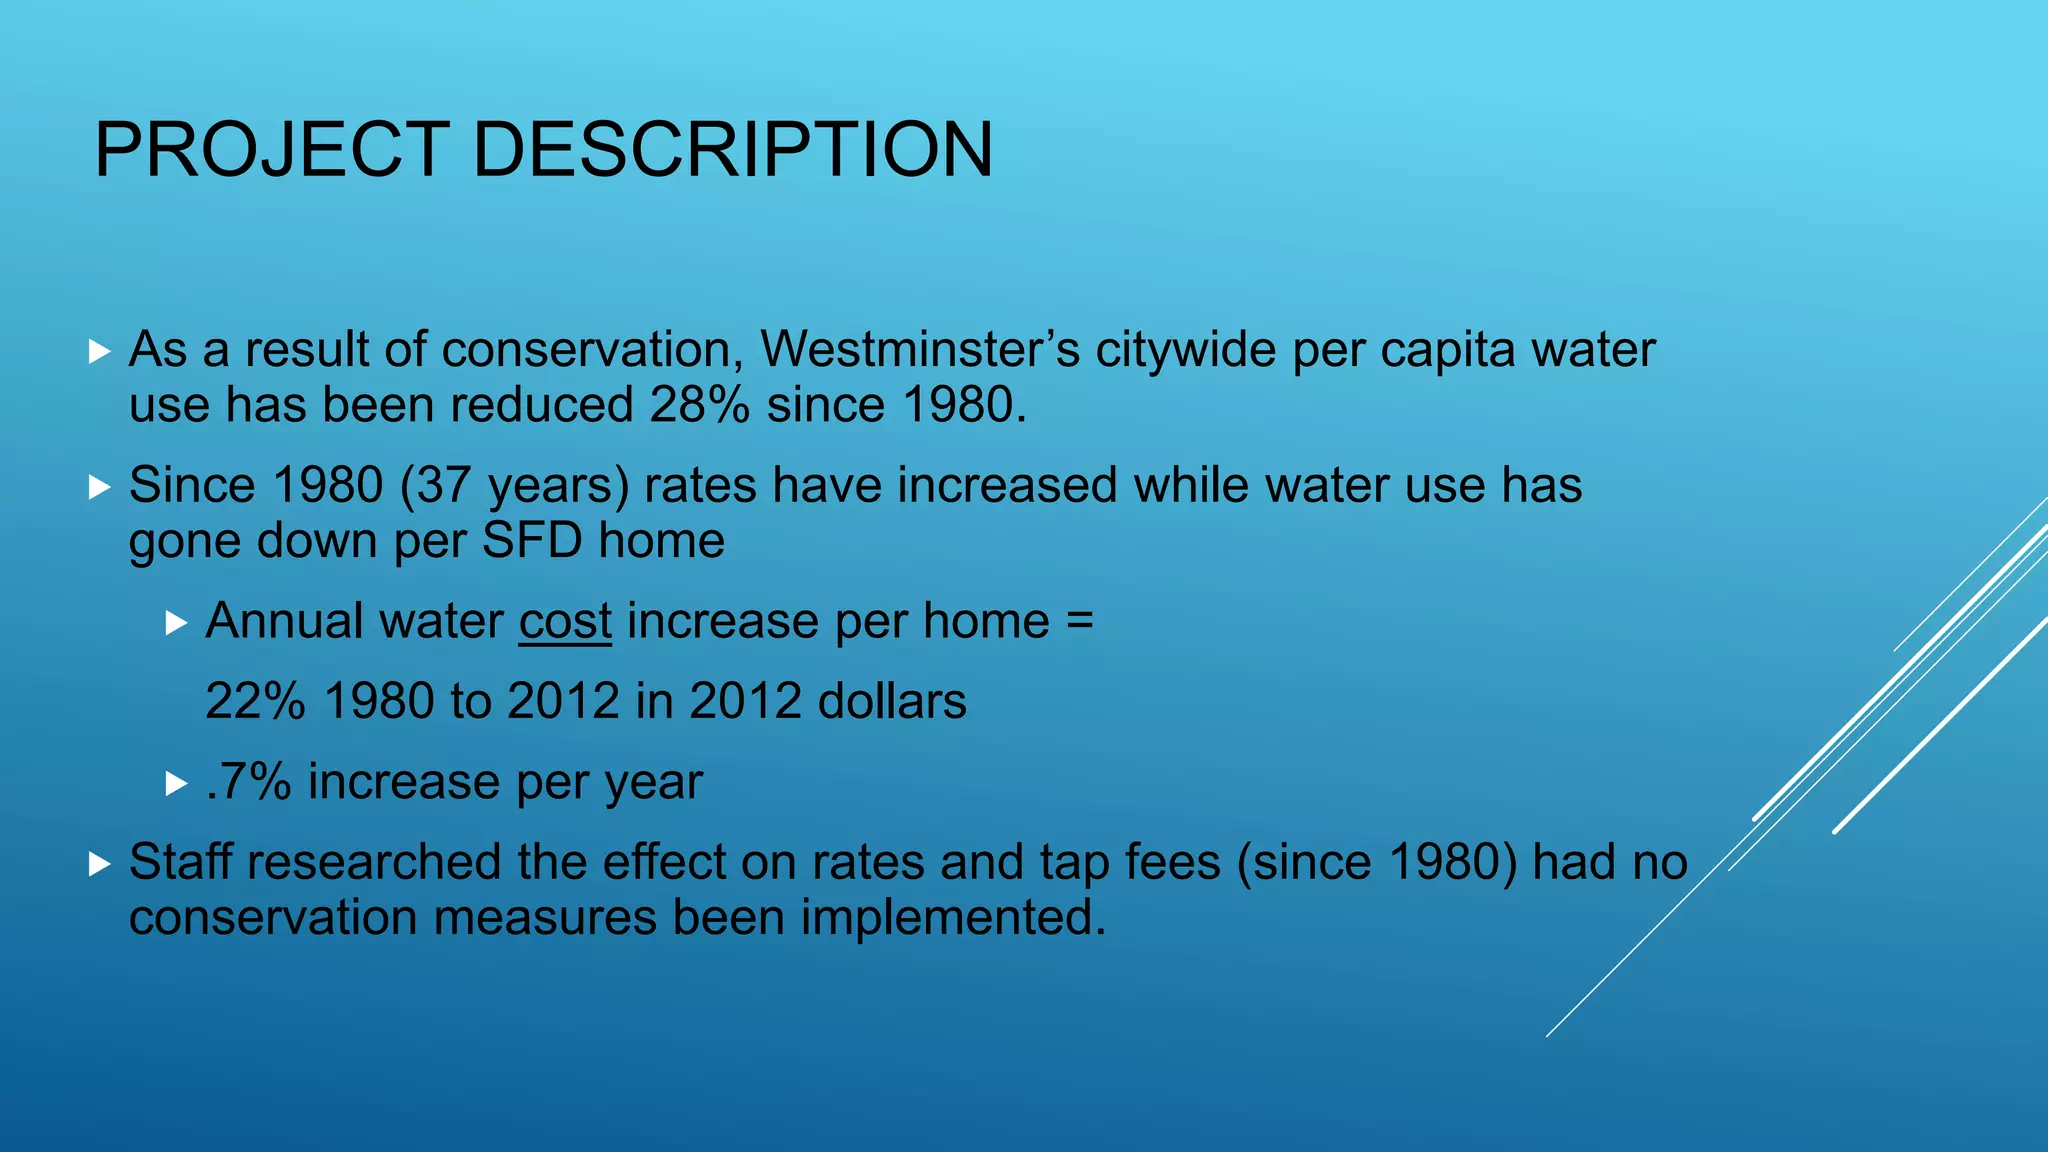
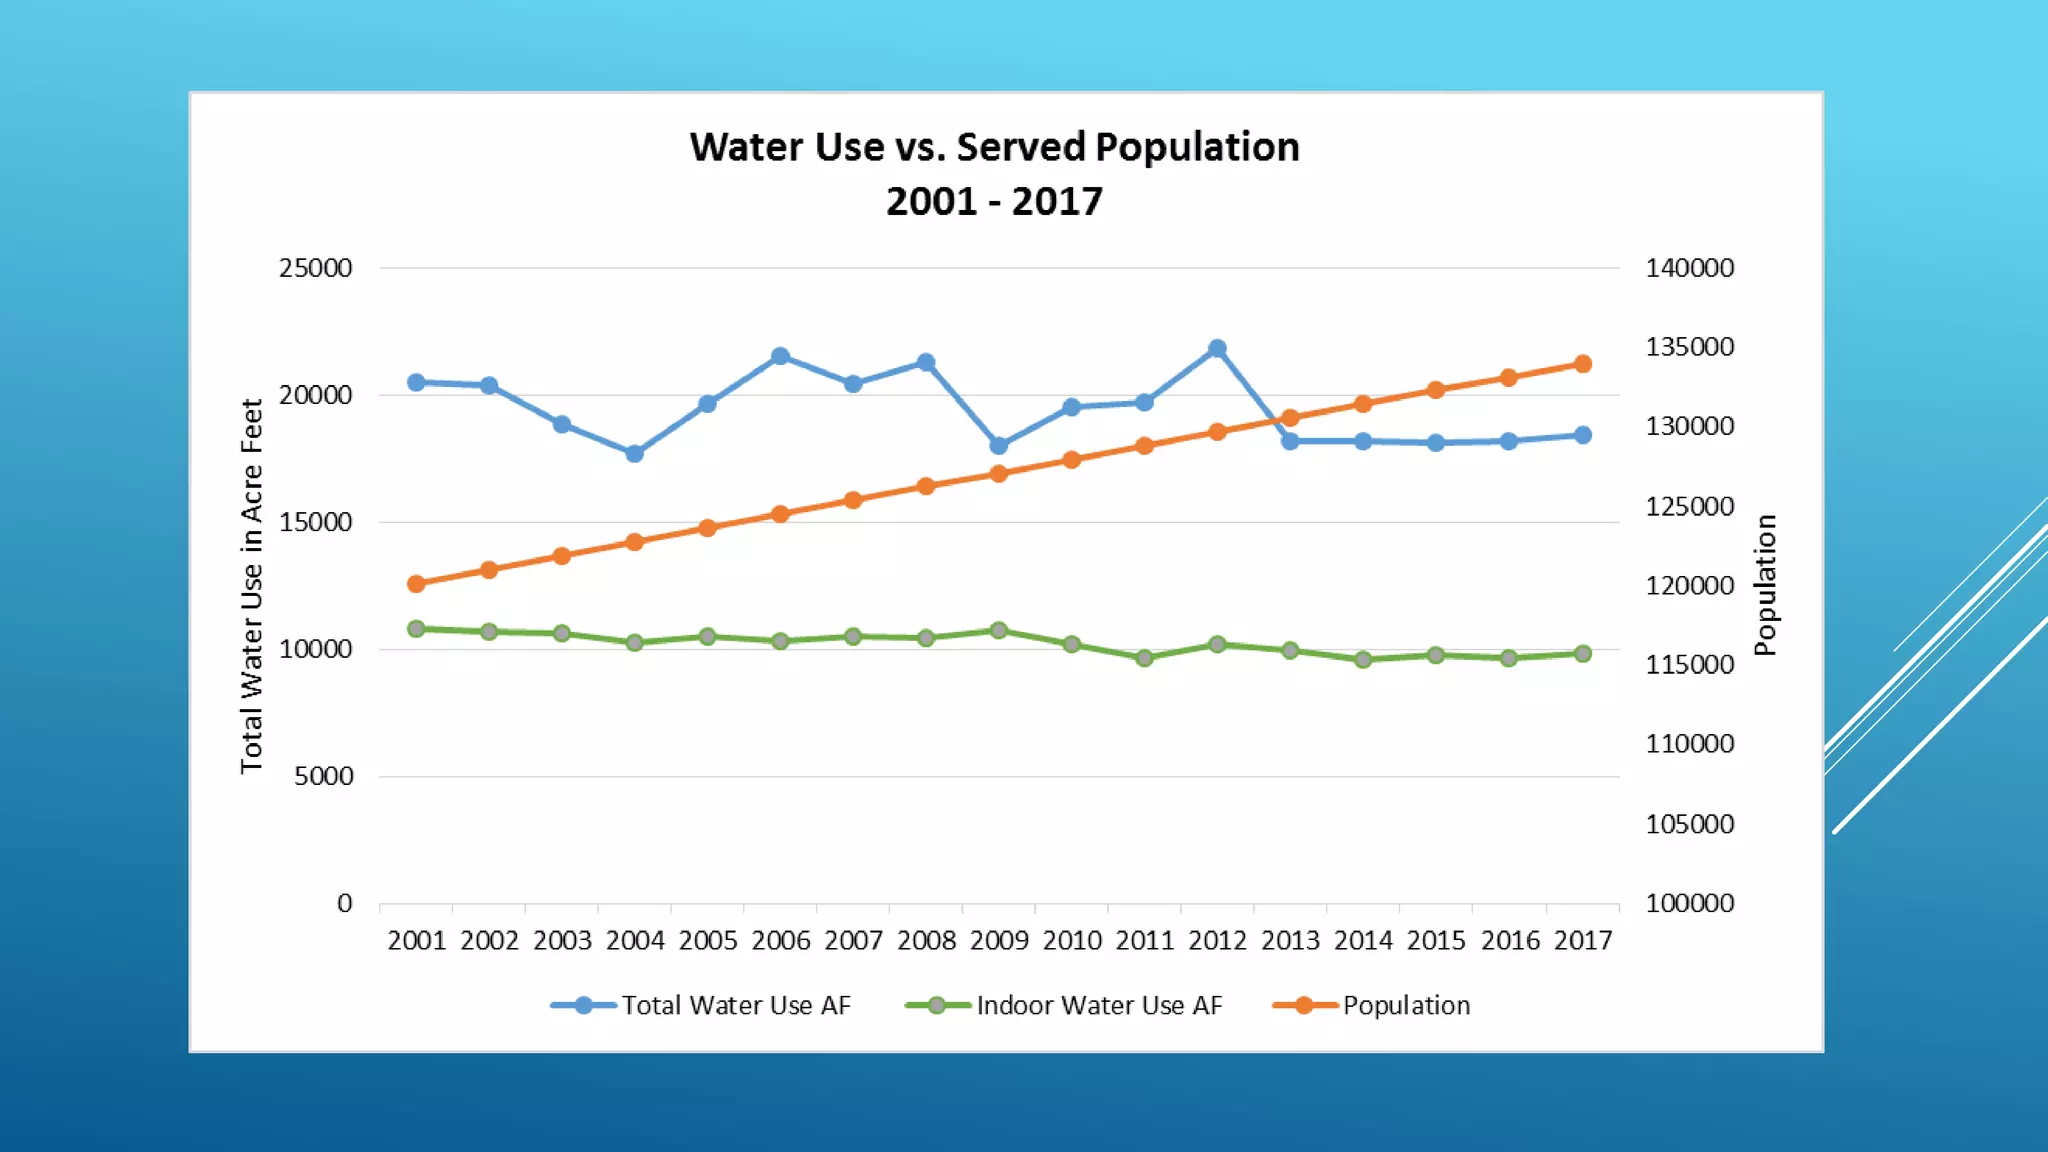
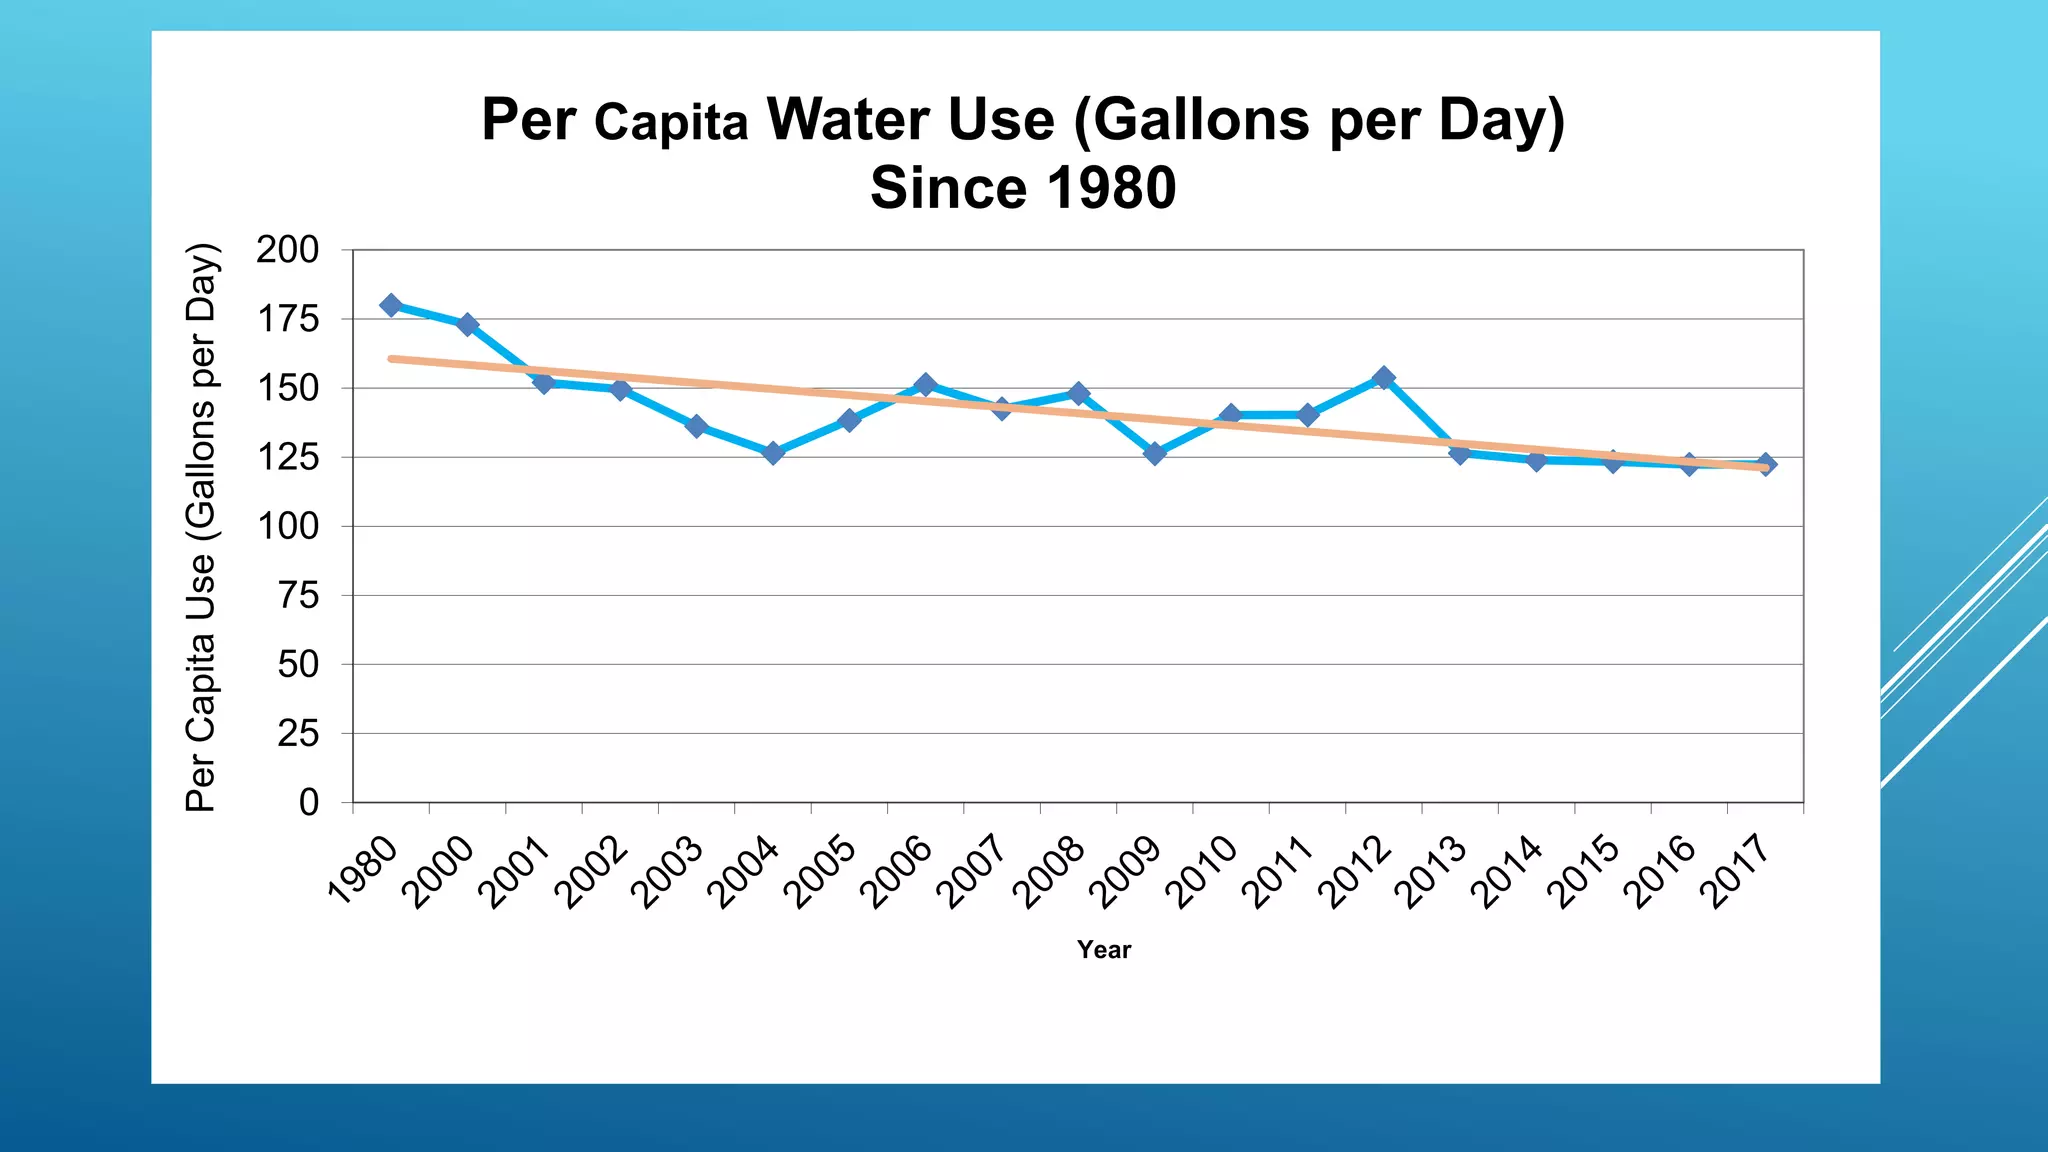
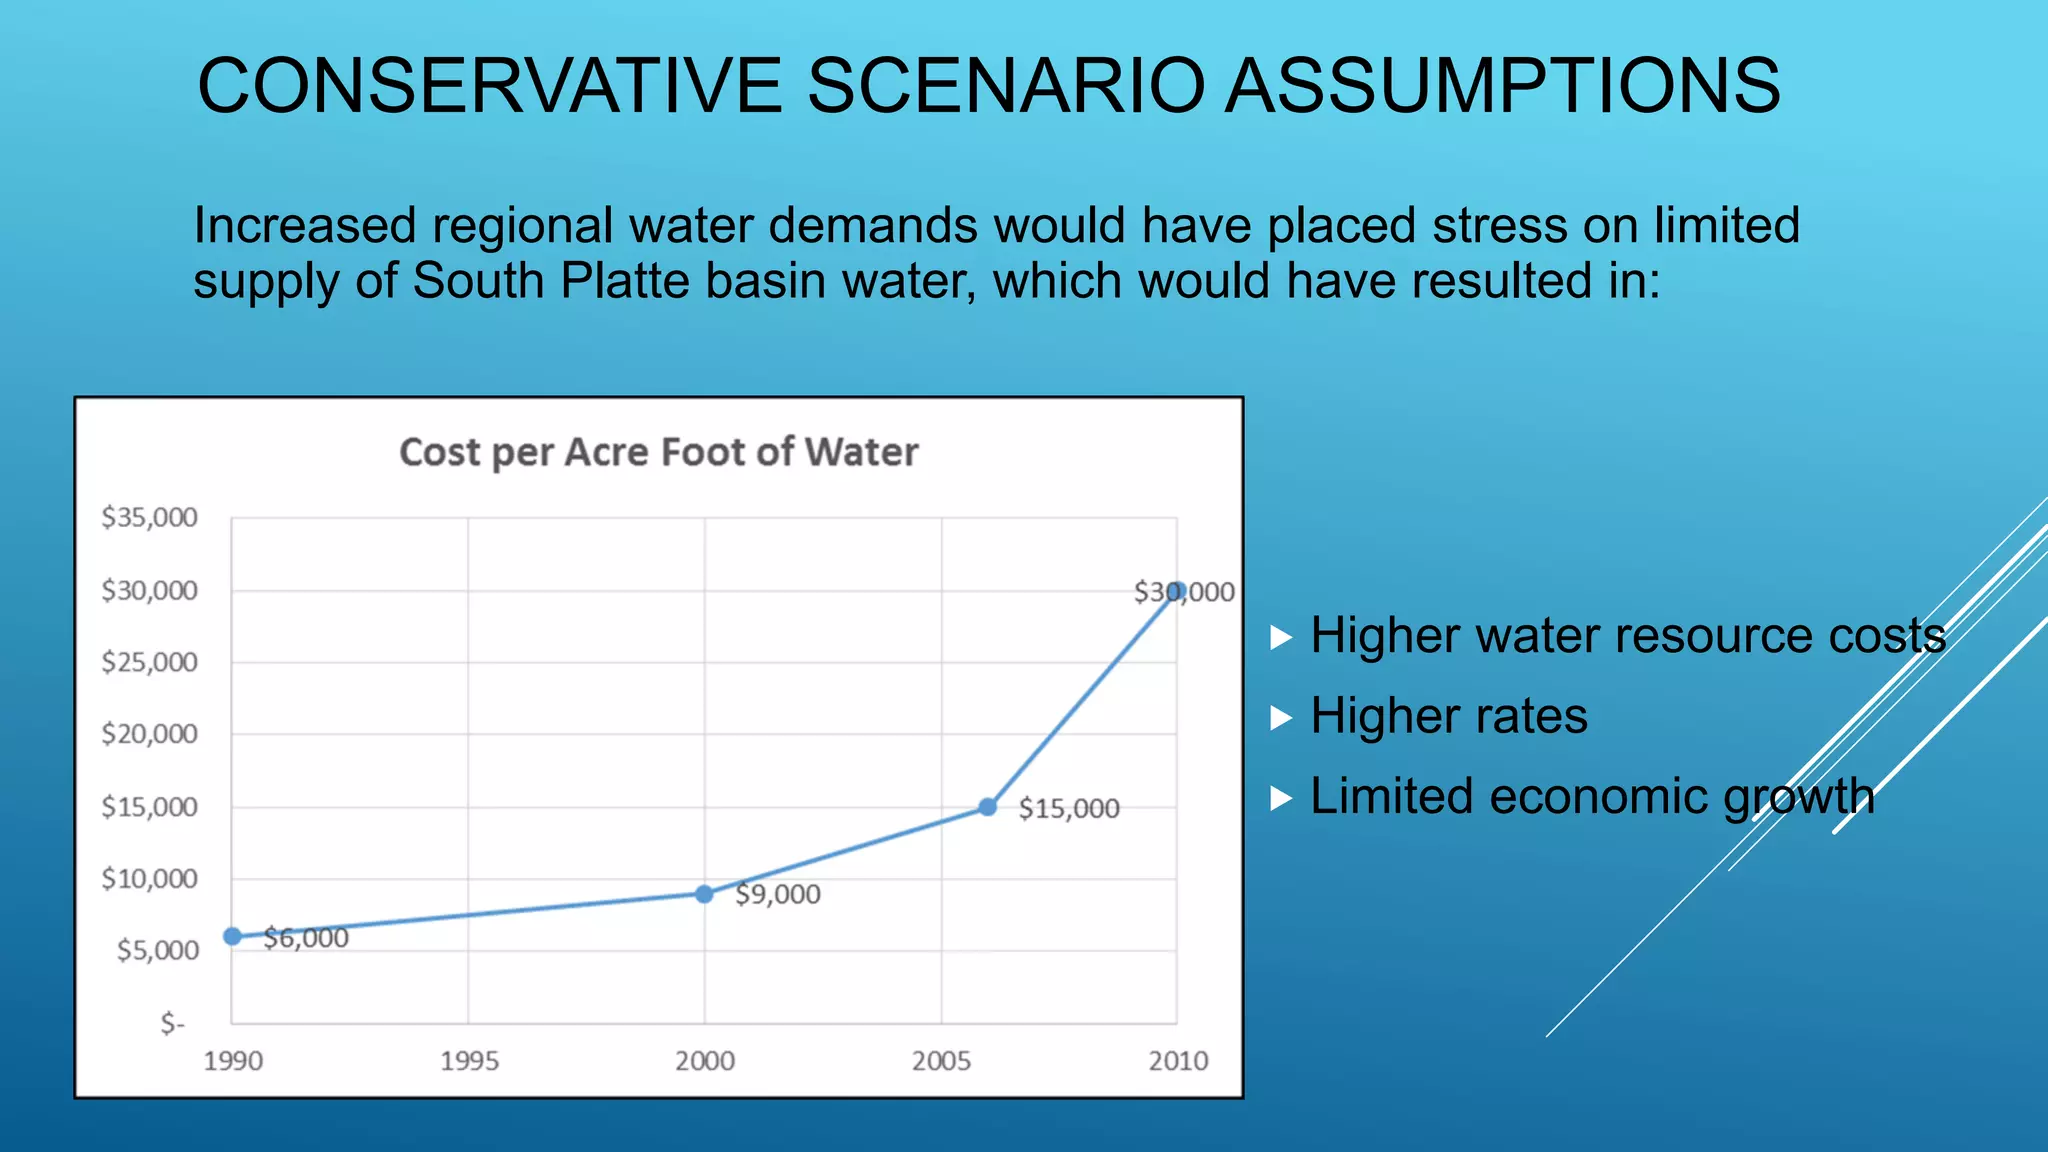
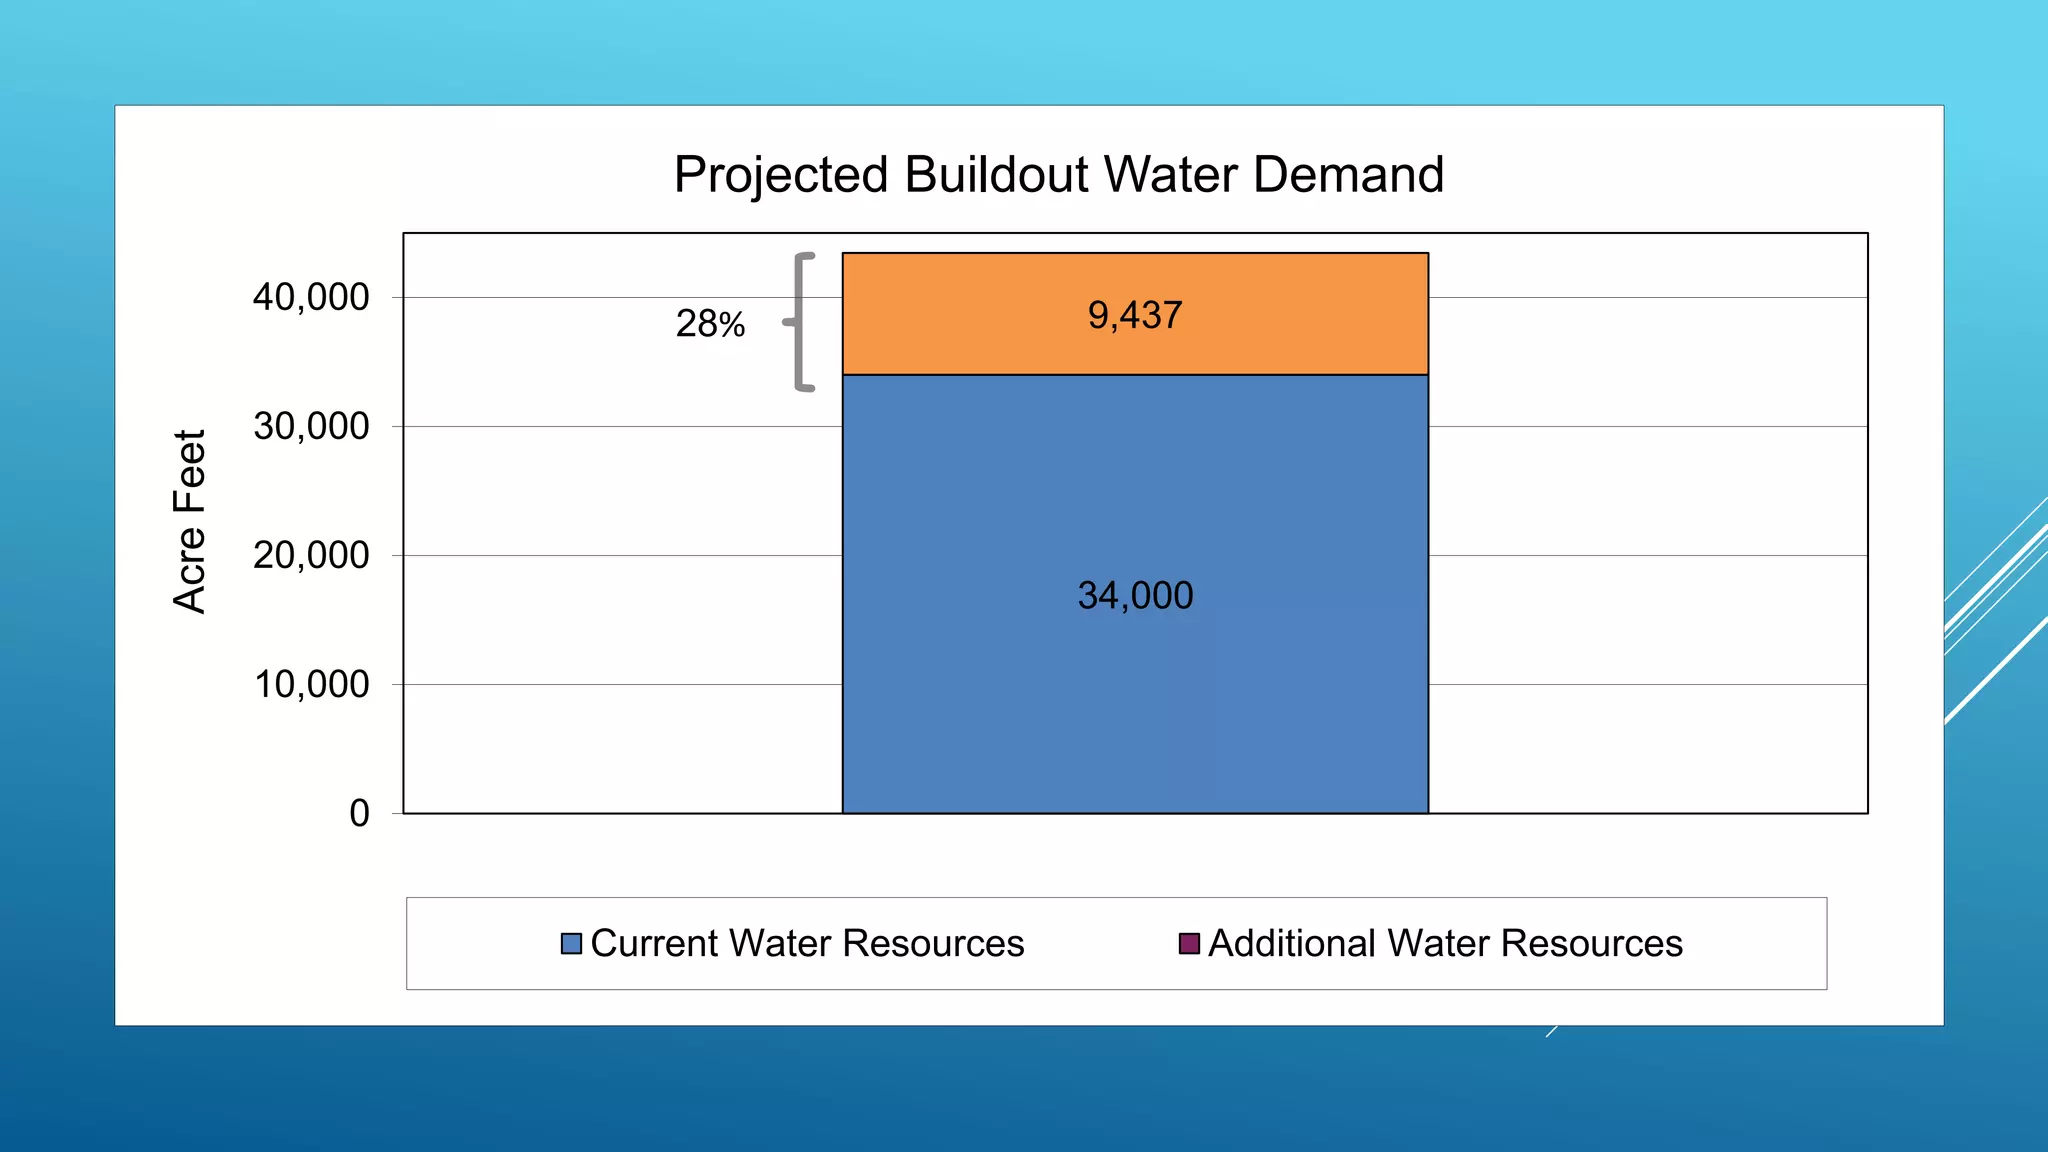
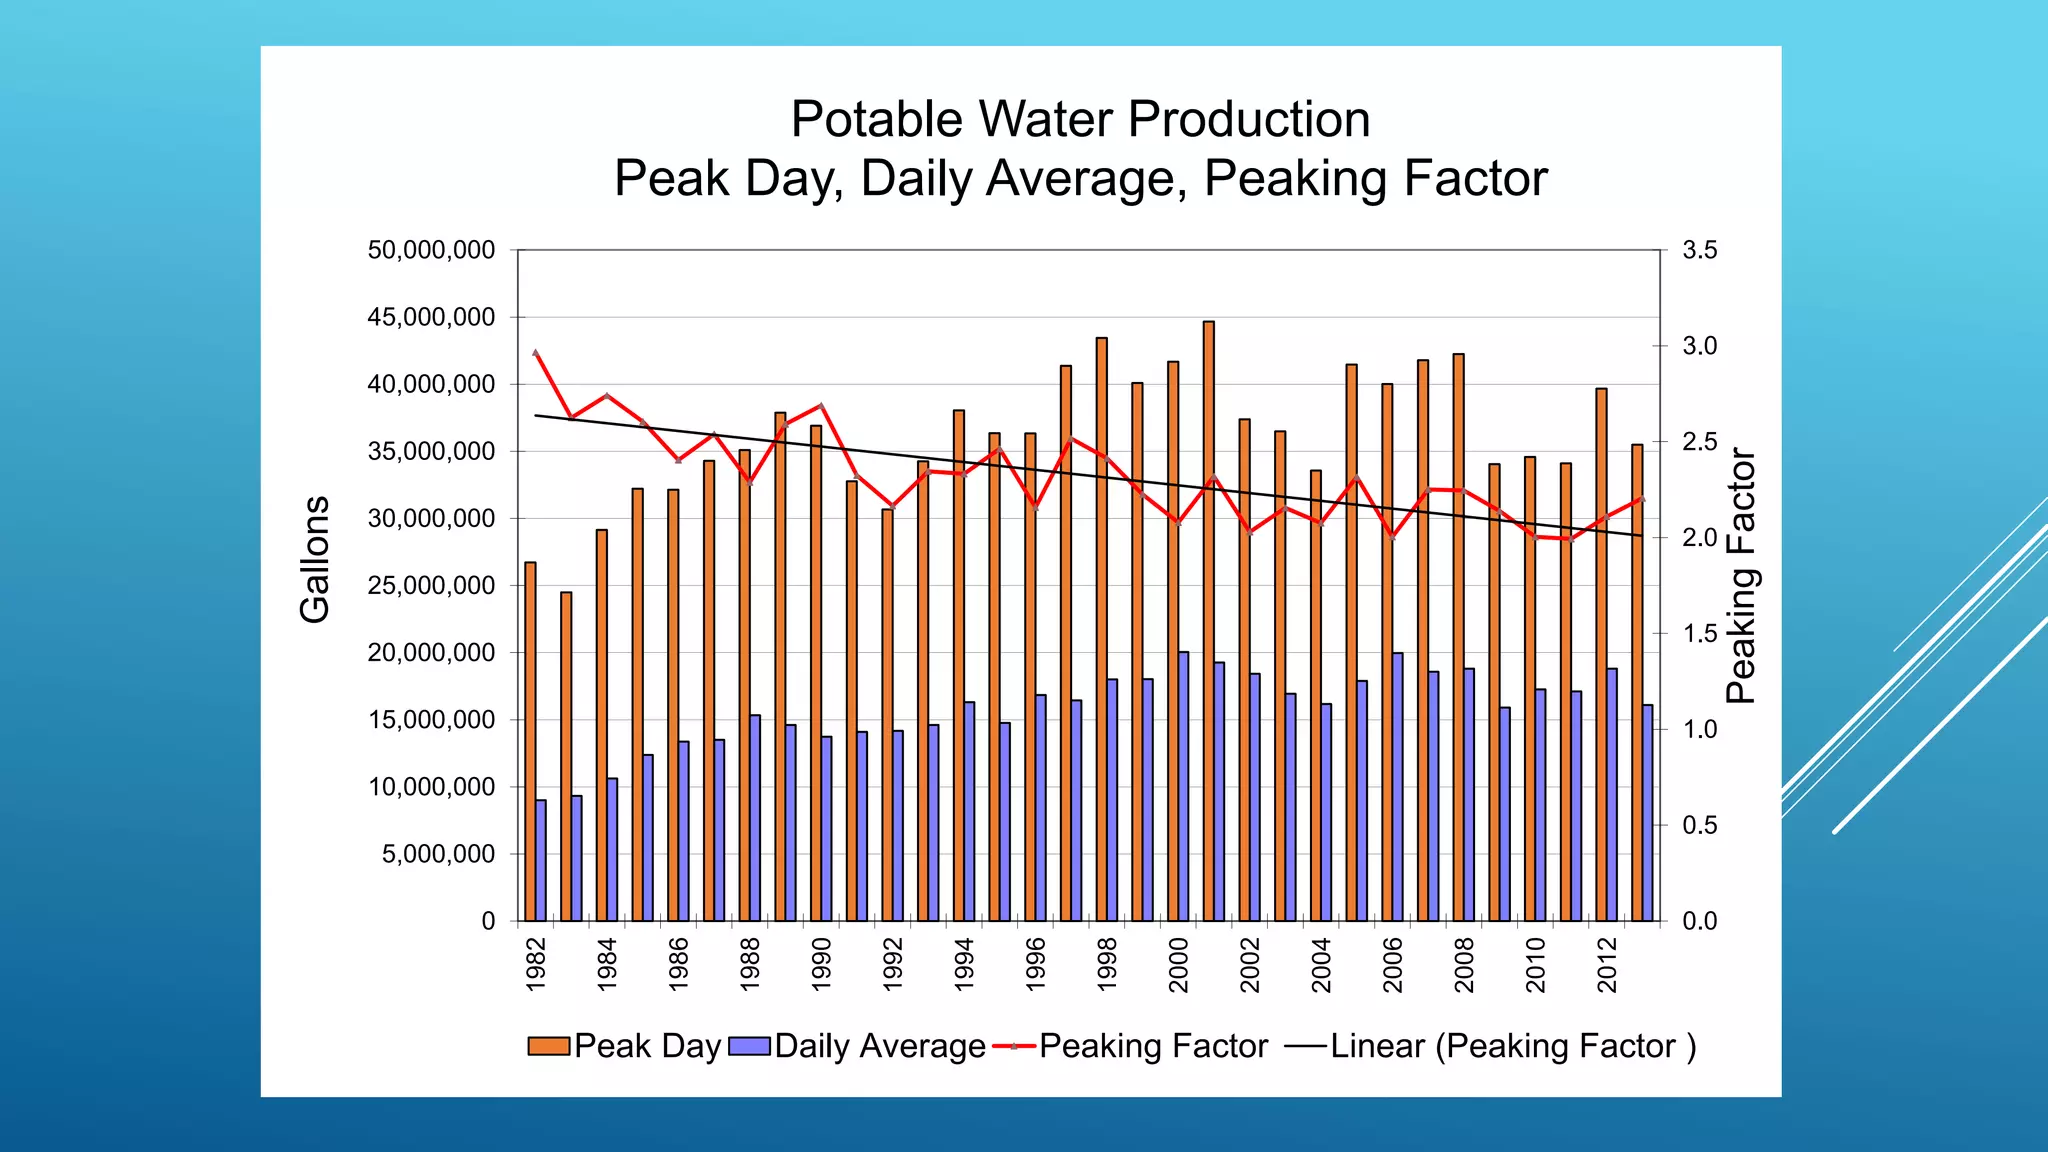
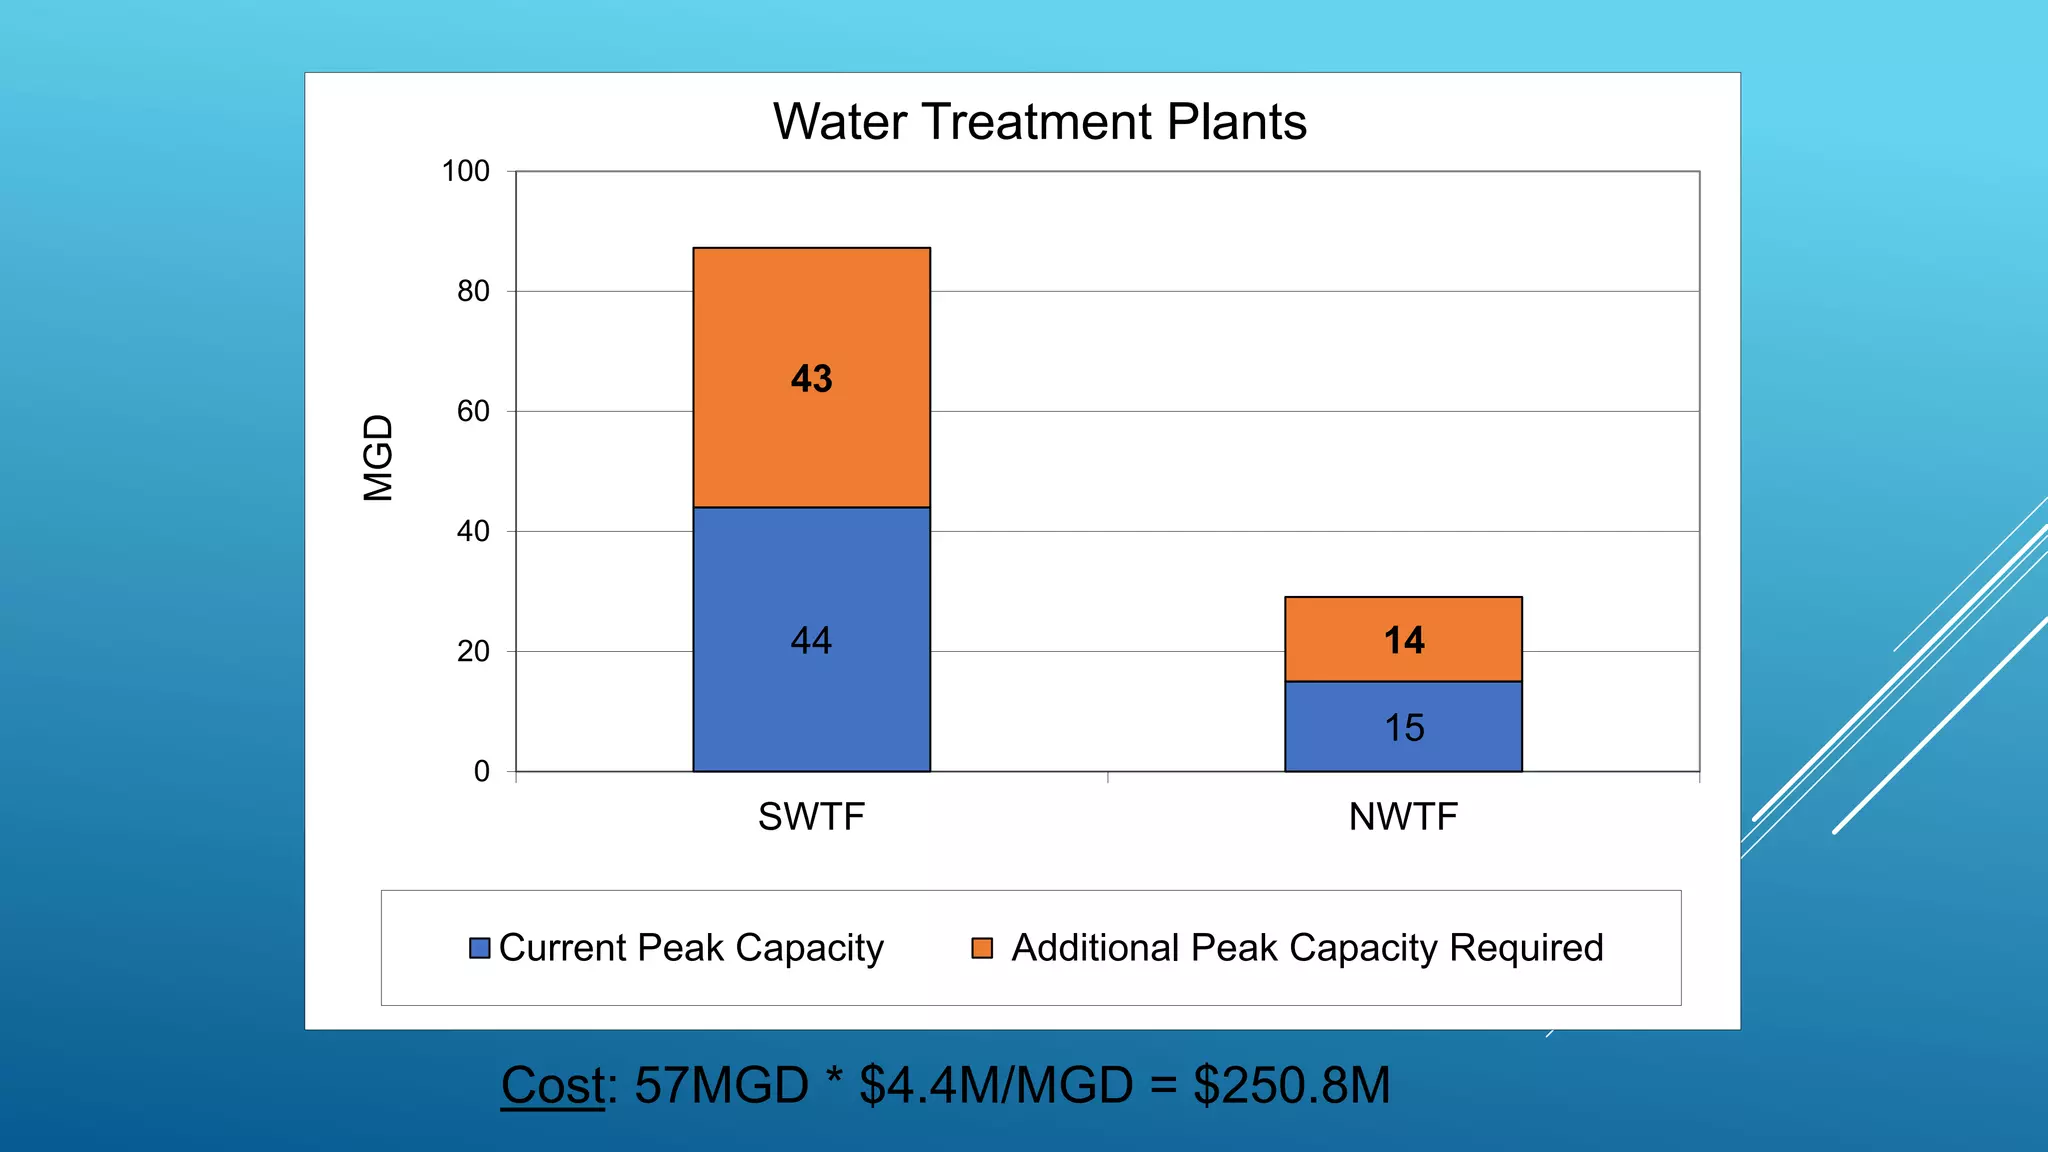
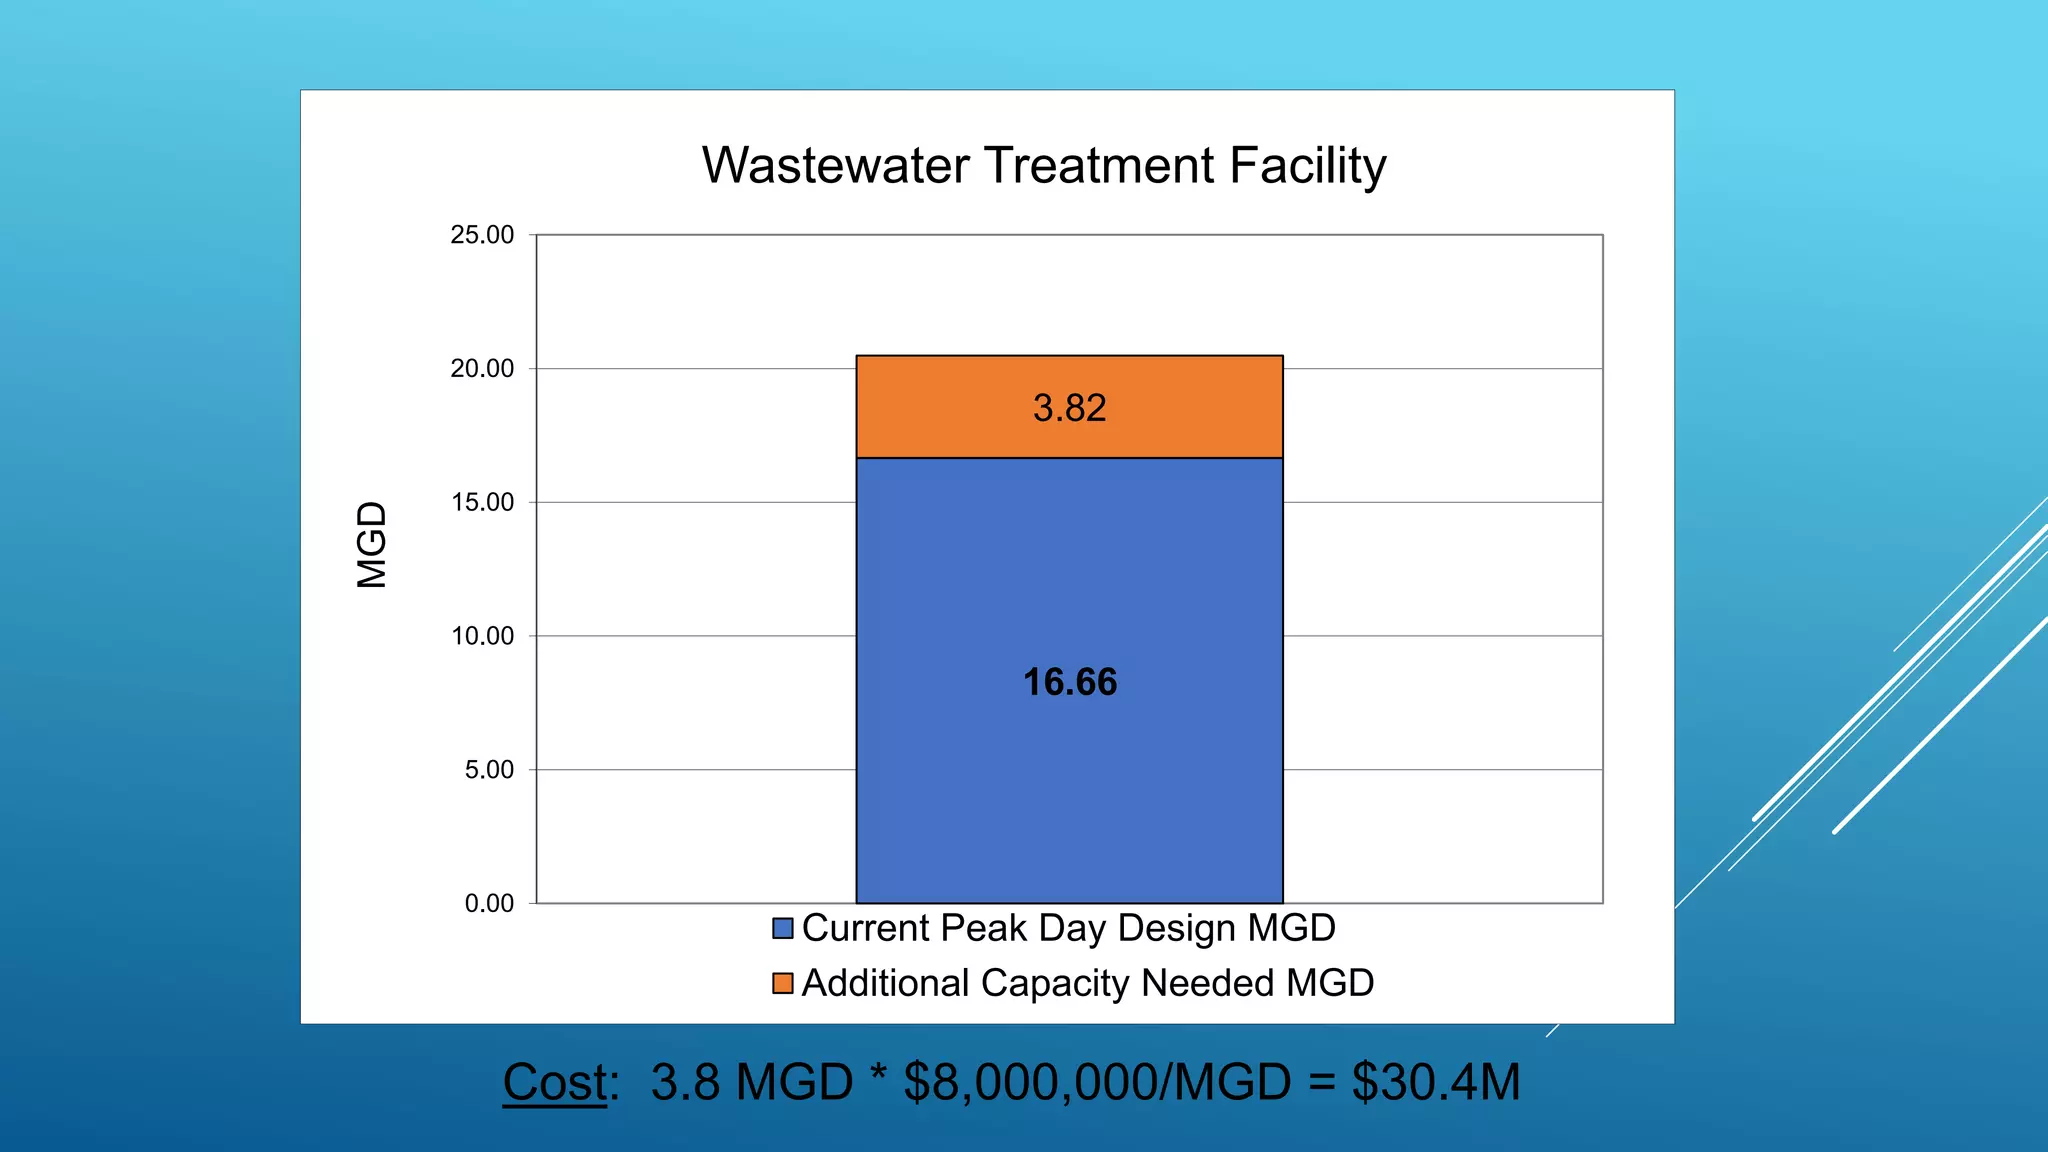
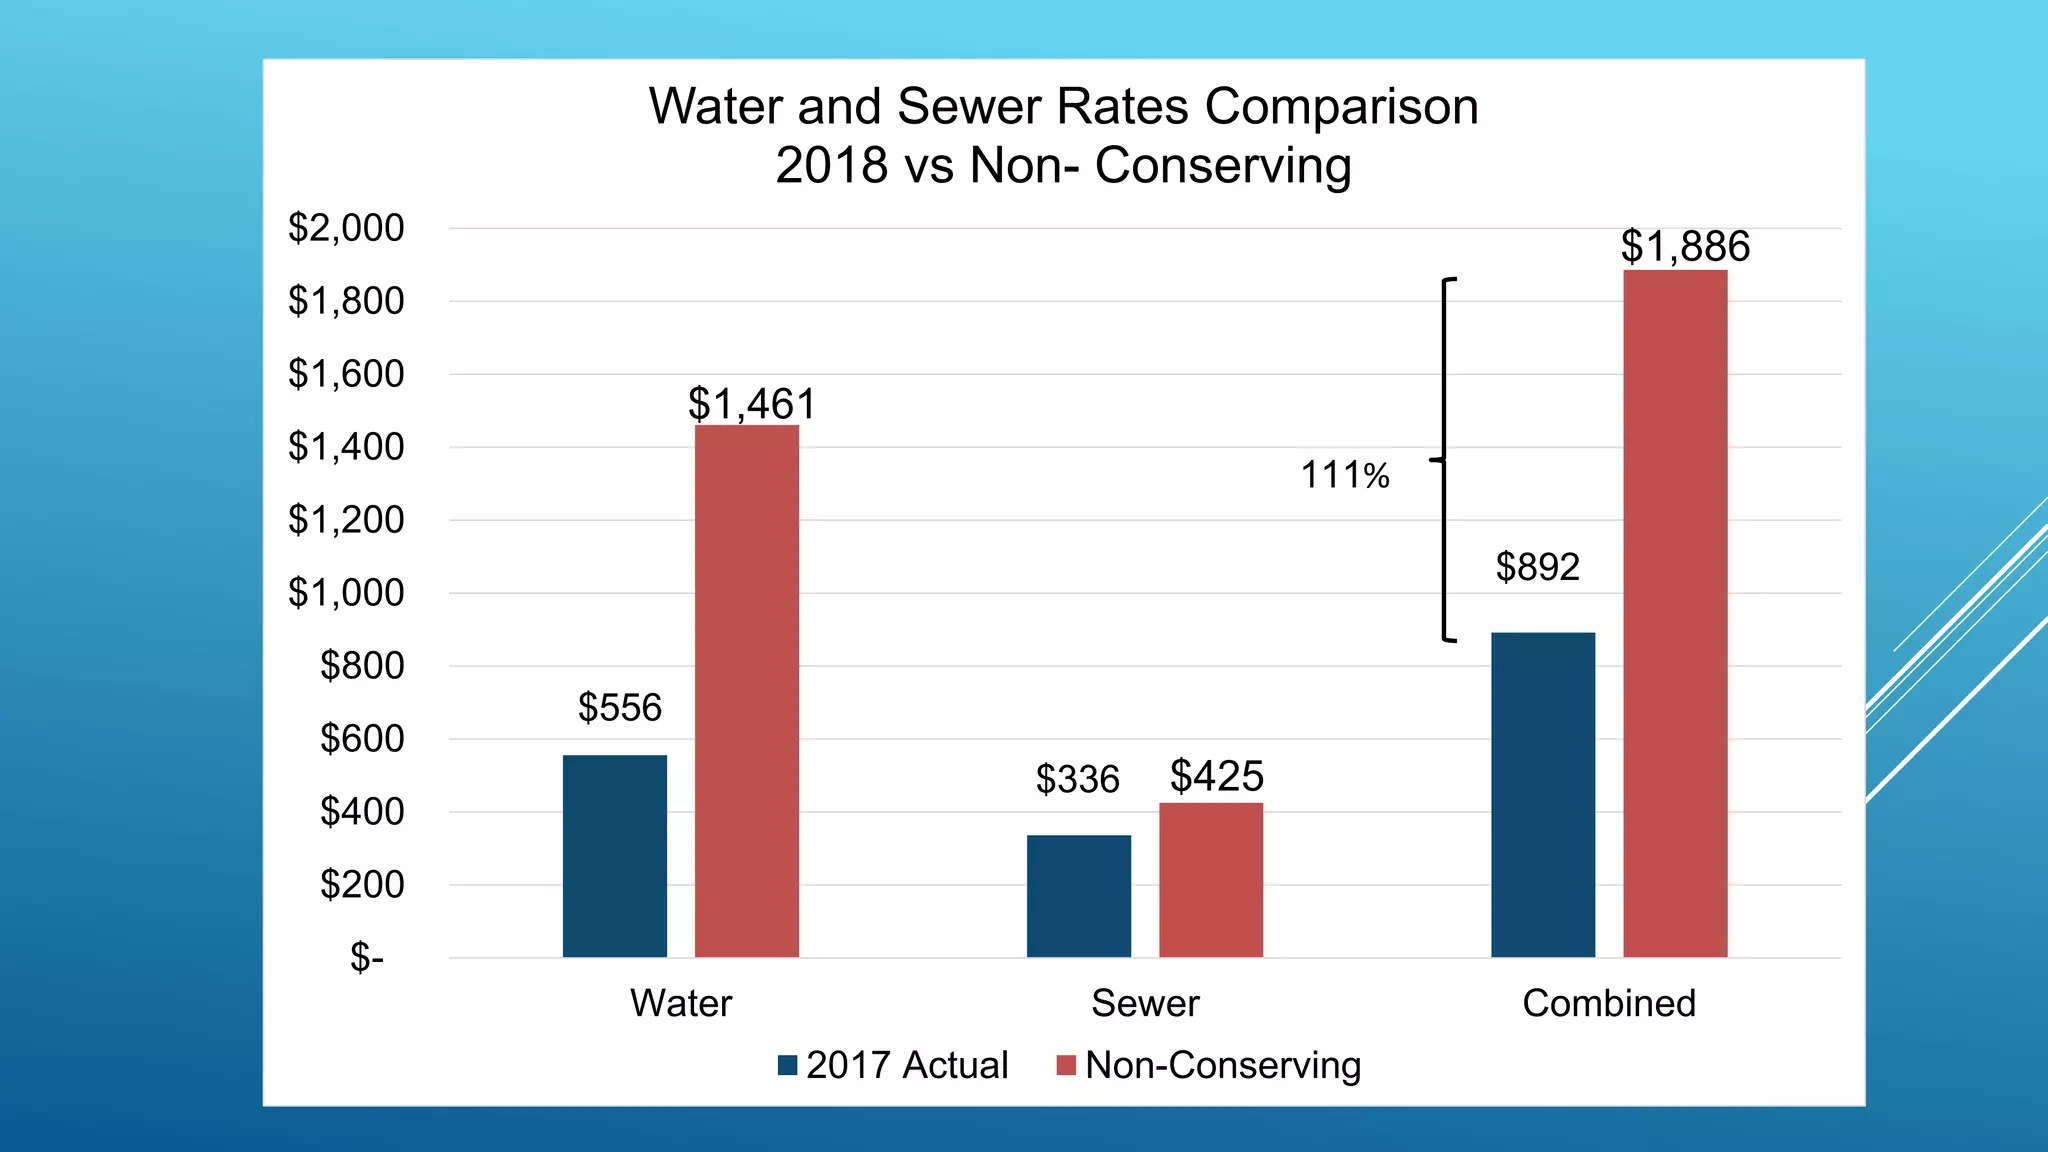
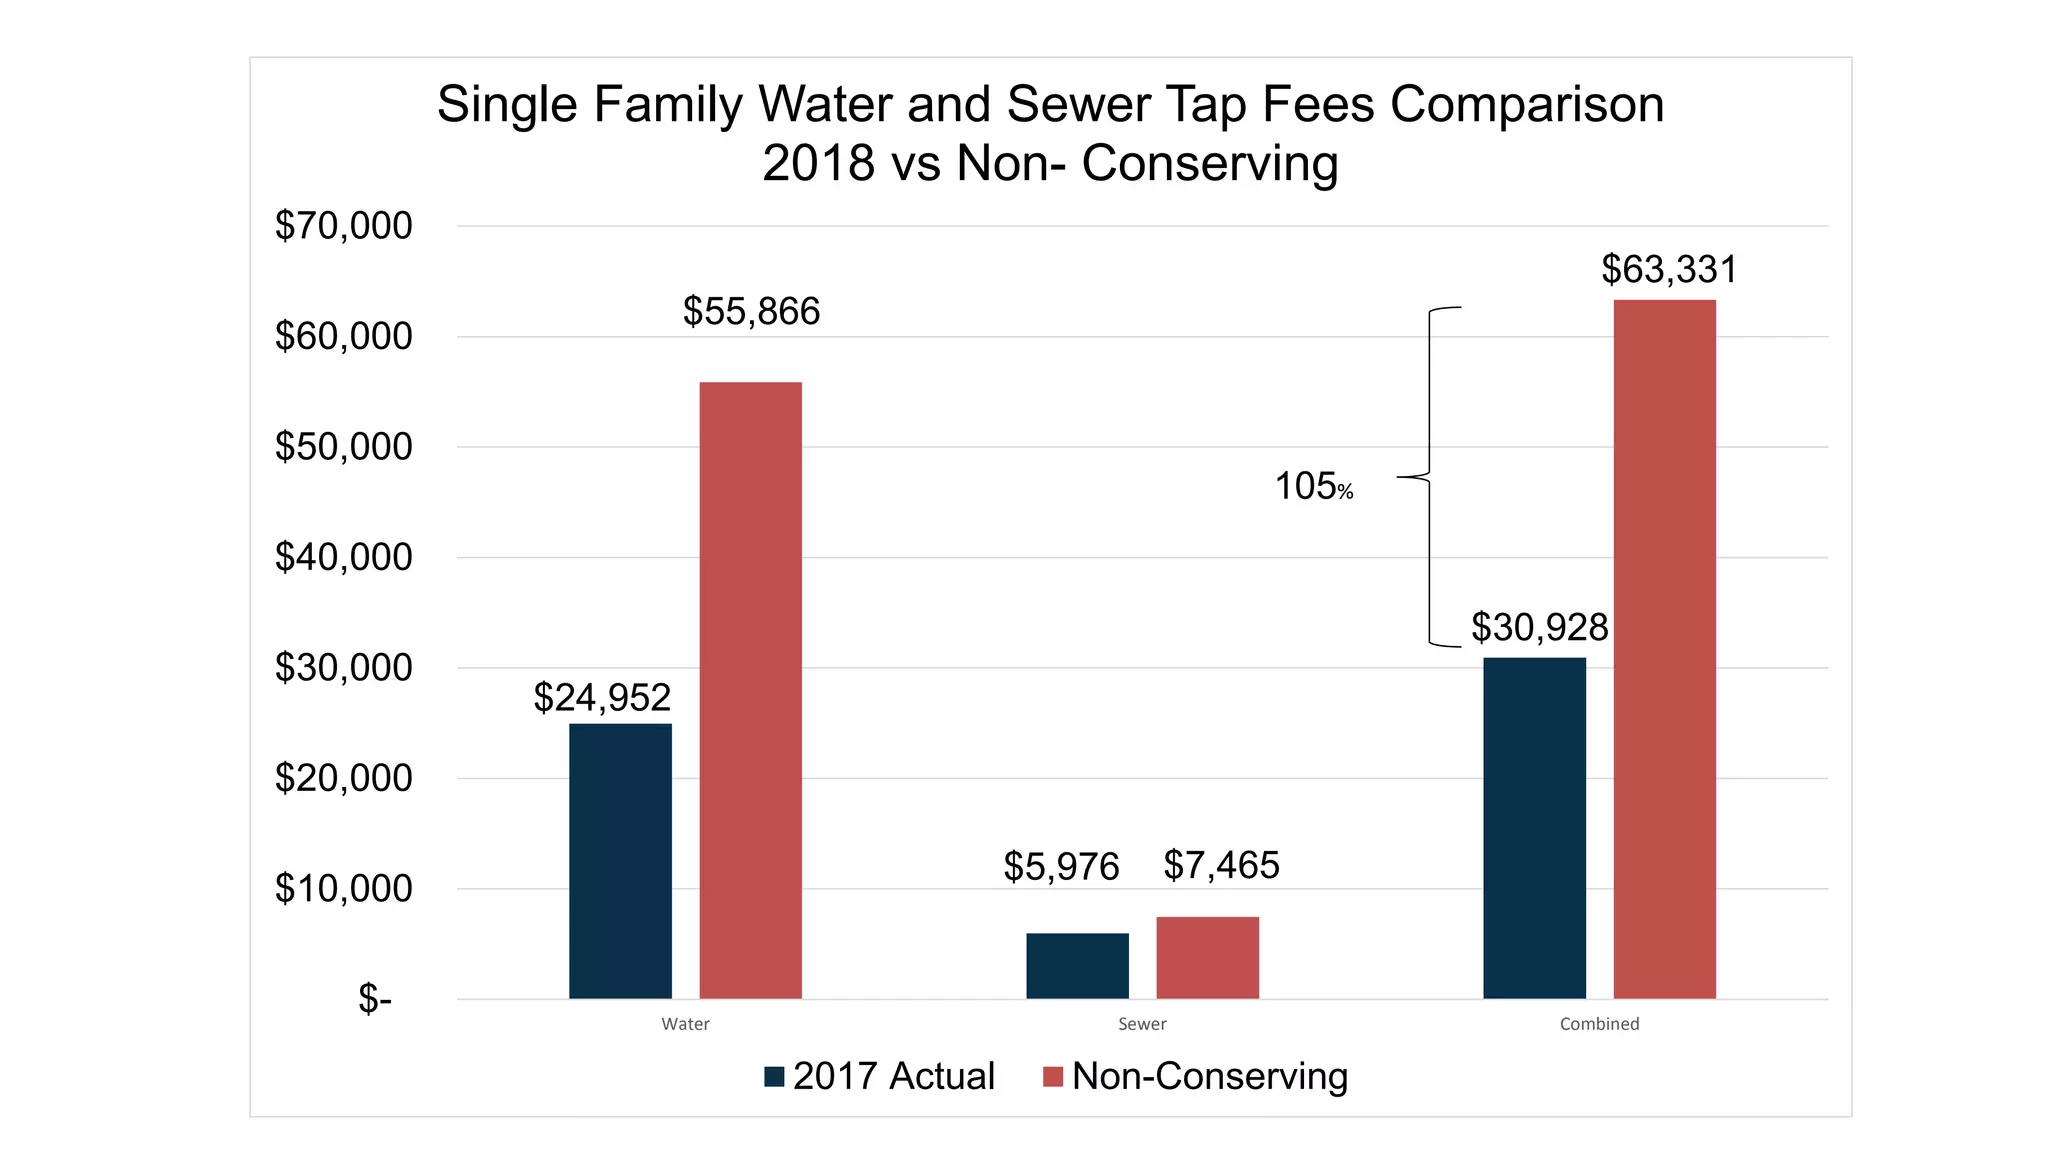
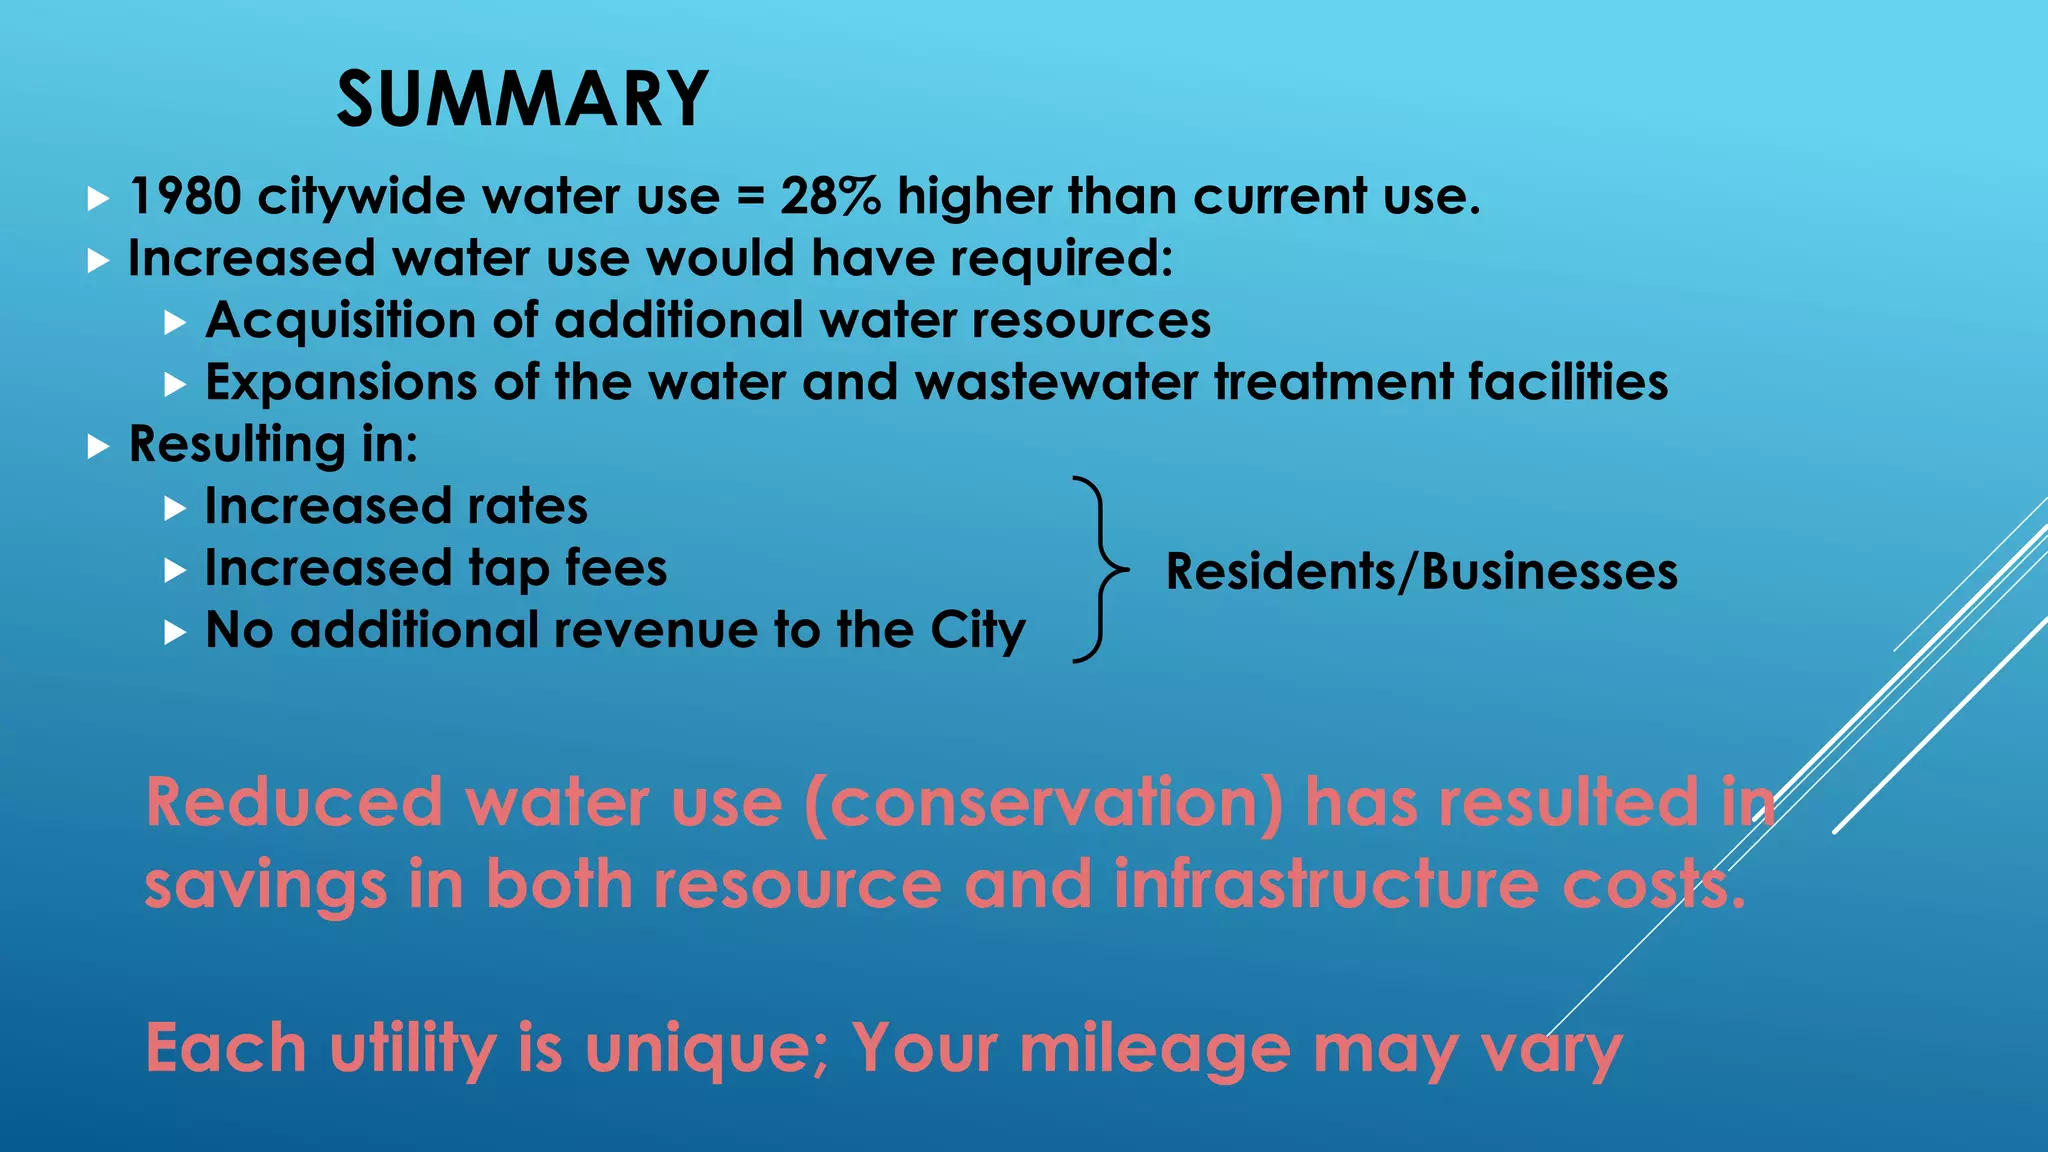
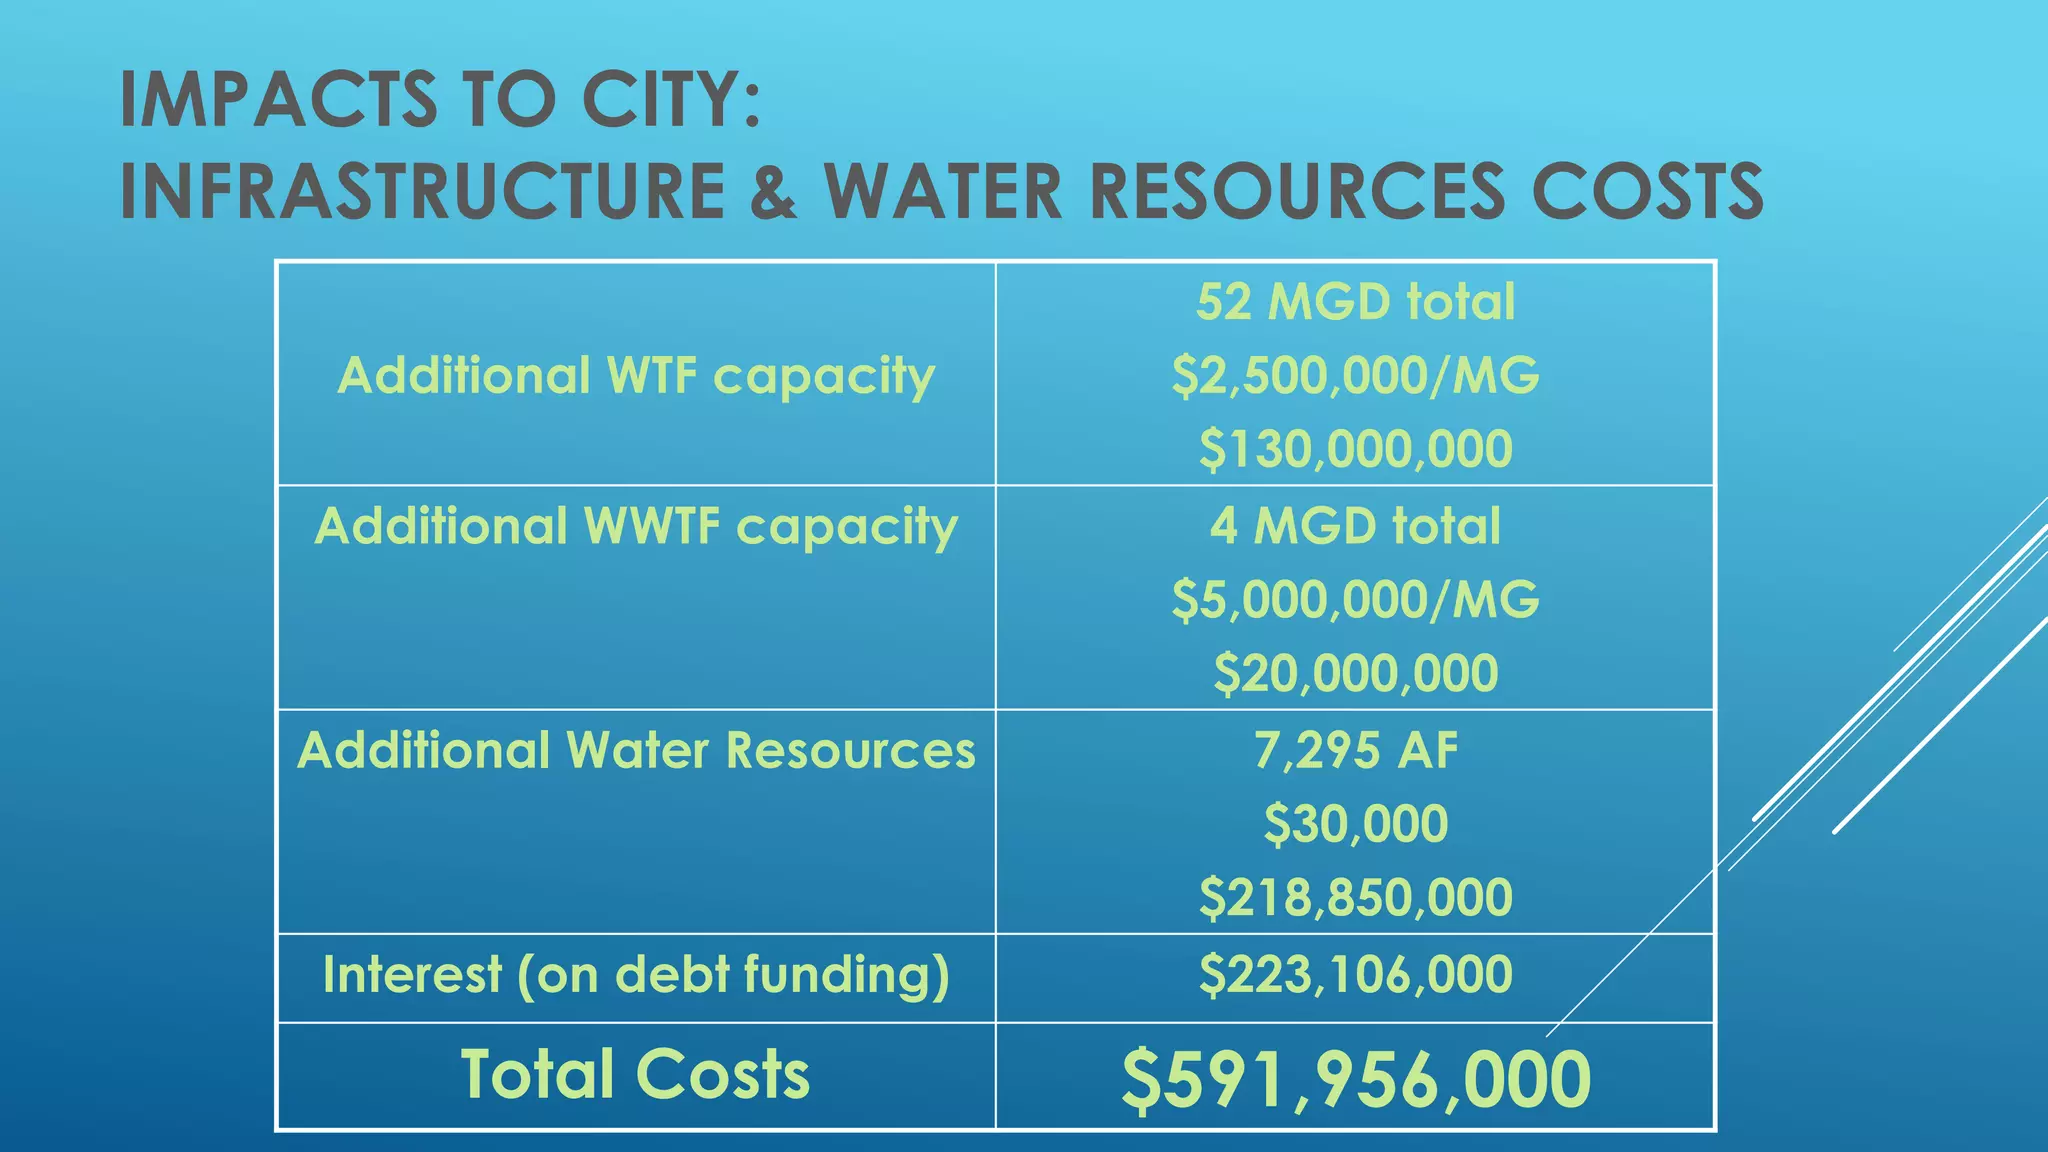
CONSERVATION LIMITS RATE
INCREASES FOR COLORADO
UTILITY
DEMAND REDUCTIONS OVER 30 YEARS HAVE
DRAMATICALLY REDUCED CAPITAL COSTS
Stu Feinglas, Senior Analyst, City of Westminster
WESTMINSTER, COLORADO
 Located between Boulder and Denver
 Municipal water and wastewater
 134,000
 32,600 accounts
 Water use
 75% residential
 25% commercial
 Buildout within a working generation
WHY ARE MY RATES GOING UP AGAIN
WHEN I KEEP CONSERVING WATER?
 Water and wastewater rates have increased faster than the
Consumer Price Index (CPI) over the past 15 years.
 Long term conservation coupled with short term drought
response has reduced demands.
 Some utilities have experienced revenue shortfalls.
 Customers are confused.
A BRIEF HISTORY OF DEMAND
FORECASTING IN SEATTLE
WESTMINSTER’S AVOIDED COST ANALYSIS
 To examine the impact of conservation on rates Westminster looked at
marginal costs due to the buildout requirements by removing conservation
from the equation.
Conclusion: Reduced water use in Westminster since 1980 has
resulted in significant savings in both water resource and
infrastructure costs, saving residents and businesses 105% in
tap fees and 111% in rates compared to what they would have
been without conservation.
 Reclaimed system not included
 Potable water use was
increased
 Sewer Savings not included
CONSERVATIVE SCENARIO ASSUMPTIONS
HYPOTHETICAL ROLLBACK OF CONSERVATION
 Rate structure changes
 Inclined blocks and seasonal
 Rebate programs
 HE fixtures and appliances
 Changes to plumbing codes
 Landscape regulations and
Xeriscape
 Education
 Attitude
PROJECT DESCRIPTION
 As a result of conservation, Westminster’s citywide per capita water
use has been reduced 28% since 1980.
 Since 1980 (37 years) rates have increased while water use has
gone down per SFD home
 Annual water cost increase per home =
22% 1980 to 2012 in 2012 dollars
 .7% increase per year
 Staff researched the effect on rates and tap fees (since 1980) had no
conservation measures been implemented.
1980 VS. 2017
Single Family Water Bills 1980 vs. 2017 Amount 37 Year Average
1980 Annual Water Bill $120.00
2017 Annual Average water Bill $515.00
1980 Annual Water Bill Adjusted to 2017 (CPI) $380.00 5.85%
(Total 216%)
1980-2017 Annual Unrelated to CPI $135.00 $3.65
Unrelated to CPI Monthly $11.25 $0.30
0
25
50
75
100
125
150
175
200
PerCapitaUse(GallonsperDay)
Year
Per Capita Water Use (Gallons per Day)
Since 1980
CONSERVATIVE SCENARIO ASSUMPTIONS
 Higher water resource costs
 Higher rates
 Limited economic growth
Increased regional water demands would have placed stress on limited
supply of South Platte basin water, which would have resulted in:
34,000
9,437
0
10,000
20,000
30,000
40,000
AcreFeet Projected Buildout Water Demand
Current Water Resources Additional Water Resources
28%
0.0
0.5
1.0
1.5
2.0
2.5
3.0
3.5
0
5,000,000
10,000,000
15,000,000
20,000,000
25,000,000
30,000,000
35,000,000
40,000,000
45,000,000
50,000,000
1982
1984
1986
1988
1990
1992
1994
1996
1998
2000
2002
2004
2006
2008
2010
2012
PeakingFactor
Gallons
Potable Water Production
Peak Day, Daily Average, Peaking Factor
Peak Day Daily Average Peaking Factor Linear (Peaking Factor )
Total peak day = 111 MGD
Cost: 57MGD * $4.4M/MGD = $250.8M
44
15
43
14
0
20
40
60
80
100
SWTF NWTF
MGD
Water Treatment Plants
Current Peak Capacity Additional Peak Capacity Required
Cost: 3.8 MGD * $8,000,000/MGD = $30.4M
16.66
3.82
0.00
5.00
10.00
15.00
20.00
25.00
MGD
Wastewater Treatment Facility
Current Peak Day Design MGD
Additional Capacity Needed MGD
FINANCING INFRASTRUCTURE PROJECTS
 20-30 year terms for projects with adequate lifespans
 3.5% to 5% interest
 Rates pay for debt
 Debt issuers want payments tied to more secure revenues
 Increases rates
 Growth pays for growth vs. Generational equity
$556
$336
$892
$1,461
$425
$1,886
$-
$200
$400
$600
$800
$1,000
$1,200
$1,400
$1,600
$1,800
$2,000
Water Sewer Combined
Water and Sewer Rates Comparison
2018 vs Non- Conserving
2017 Actual Non-Conserving
111%
$24,952
$5,976
$30,928
$55,866
$7,465
$63,331
$-
$10,000
$20,000
$30,000
$40,000
$50,000
$60,000
$70,000
Water Sewer Combined
Single Family Water and Sewer Tap Fees Comparison
2018 vs Non- Conserving
2017 Actual Non-Conserving
105%
CONSERVATION
 Rebate programs 2003-2012
 Toilets – Clothes Washers – Urinals
 Landscape Regulations -2004
 Limited turf areas
 Irrigation audit
 Weather based controllers
 Soil amendment inspection
 Funded staff
 Conservation based tap fees
 Linking water supply with Comprehensive Plan
 WaterSense Fixtures (Colorado State Regulation)
RATES OVER TIME
1954-1992
 Winter/Summer
 Summer Less
Expensive
1993-2005
 3 tiers
 1st tier “Lifeline”
2006-2018
 System generally
developed for buildout
 R & R and growth
through tap fees
Future
 Additional Tiers
 Tap Fee surcharge
0.00%
1.00%
2.00%
3.00%
4.00%
5.00%
6.00%
7.00%
8.00%
9.00%
10.00%
1995 1996 1997 1998 1999 2000 2001 2002 2003 2004 2005 2006 2007 2008 2009 2010 2011 2012 2013 2014 2015 2016 2017 2018
RATE COMMUNICATIONS
 Started to feel rate increase stress in 2017-2018 cycle
 8% water 6% sewer
 Trying to get out ahead of the 2019-2020 cycle
 Direct mailers
 Quarterly articles
 Focused on understanding our system
 Ongoing Value of Water campaign
 Include level of service discussions
 More to do
WATER AND WASTEWATER RATE STUDY
 Data based Utility
 Comprehensive infrastructure study
 10,000 staff hours initial site visits
 2,500 hours update 2017
 Detailed usage data
 Biggest Challenges
 Infrastructure R&R driving future increases
 Use reductions from rising rates
SUMMARY
 1980 citywide water use = 28% higher than current use.
 Increased water use would have required:
 Acquisition of additional water resources
 Expansions of the water and wastewater treatment facilities
 Resulting in:
 Increased rates
 Increased tap fees
 No additional revenue to the City
Residents/Businesses
Reduced water use (conservation) has resulted in
savings in both resource and infrastructure costs.
Each utility is unique; Your mileage may vary
THANK YOU.
QUESTIONS?
Stu Feinglas, Senior Analyst, City of Westminster
IMPACTS TO CITY:
INFRASTRUCTURE & WATER RESOURCES COSTS
Additional WTF capacity
52 MGD total
$2,500,000/MG
$130,000,000
Additional WWTF capacity 4 MGD total
$5,000,000/MG
$20,000,000
Additional Water Resources 7,295 AF
$30,000
$218,850,000
Interest (on debt funding) $223,106,000
Total Costs $591,956,000
IMPACTS TO CITY: OPERATING COSTS*
Additional annual
operating cost of WTF
21% increase
$480,400
Additional annual
operating cost of
BDCWWTF & Metro
20% increase
$757,600
Total additional
operating costs
$1,238,000
* No Additional Personnel
IMPACTS TO RESIDENTS AND
BUSINESSES
2 SOURCES OF REVENUE/2 WAYS TO FUND ALL
COSTS
Revenue Source: Rates
Pays for: O&M
R&R
Debt Service
Revenue Source: Tap Fees
Pays for: New Infrastructure
New Water Resources
R&R
IMPACT TO RESIDENTS:
SINGLE FAMILY RATES –ANNUAL BILL (WATER &
SEWER)
2012
Additional
Charge
Total Annual SF
Water/Sewer Bill
% Increase to
2012 Charge
Water $410 $561 $971 137%
Sewer $245 $63 $308 26%
Total $655 $624 $1,279 95%
IMPACT TO RESIDENTS/BUSINESSES:
SINGLE FAMILY TAP FEES
2012
Additional
Charge
Total Annual
SF Tap Fee
% Increase
Water $16,325 $16,086 $32,411 99%
Sewer $4,904 $866 $5,770 18%
Total $21,229 $16,952 $38,181 80%
CONCLUSION
 Each water system is unique. Results from Westminster may not
apply.
 Utilities can perform a similar analysis.
 The $591 million dollar cost reveals the significant hardship
associated with expanding supply and infrastructure today.
 The cost highlights the inherent value in our current infrastructure.
The cheapest water (by far) is the water we already have
and the best way to keep rates and tap fees low is to
conserve the water we already have.

How Come My Rates Keep Going Up When I'm Saving Water?: Conservation Limits Rate Increases

  • 1.
    CONSERVATION LIMITS RATE INCREASESFOR COLORADO UTILITY DEMAND REDUCTIONS OVER 30 YEARS HAVE DRAMATICALLY REDUCED CAPITAL COSTS Stu Feinglas, Senior Analyst, City of Westminster
  • 2.
    WESTMINSTER, COLORADO  Locatedbetween Boulder and Denver  Municipal water and wastewater  134,000  32,600 accounts  Water use  75% residential  25% commercial  Buildout within a working generation
  • 3.
    WHY ARE MYRATES GOING UP AGAIN WHEN I KEEP CONSERVING WATER?  Water and wastewater rates have increased faster than the Consumer Price Index (CPI) over the past 15 years.  Long term conservation coupled with short term drought response has reduced demands.  Some utilities have experienced revenue shortfalls.  Customers are confused.
  • 6.
    A BRIEF HISTORYOF DEMAND FORECASTING IN SEATTLE
  • 7.
    WESTMINSTER’S AVOIDED COSTANALYSIS  To examine the impact of conservation on rates Westminster looked at marginal costs due to the buildout requirements by removing conservation from the equation. Conclusion: Reduced water use in Westminster since 1980 has resulted in significant savings in both water resource and infrastructure costs, saving residents and businesses 105% in tap fees and 111% in rates compared to what they would have been without conservation.
  • 8.
     Reclaimed systemnot included  Potable water use was increased  Sewer Savings not included CONSERVATIVE SCENARIO ASSUMPTIONS HYPOTHETICAL ROLLBACK OF CONSERVATION  Rate structure changes  Inclined blocks and seasonal  Rebate programs  HE fixtures and appliances  Changes to plumbing codes  Landscape regulations and Xeriscape  Education  Attitude
  • 9.
    PROJECT DESCRIPTION  Asa result of conservation, Westminster’s citywide per capita water use has been reduced 28% since 1980.  Since 1980 (37 years) rates have increased while water use has gone down per SFD home  Annual water cost increase per home = 22% 1980 to 2012 in 2012 dollars  .7% increase per year  Staff researched the effect on rates and tap fees (since 1980) had no conservation measures been implemented.
  • 10.
  • 11.
    Single Family WaterBills 1980 vs. 2017 Amount 37 Year Average 1980 Annual Water Bill $120.00 2017 Annual Average water Bill $515.00 1980 Annual Water Bill Adjusted to 2017 (CPI) $380.00 5.85% (Total 216%) 1980-2017 Annual Unrelated to CPI $135.00 $3.65 Unrelated to CPI Monthly $11.25 $0.30
  • 13.
  • 14.
    CONSERVATIVE SCENARIO ASSUMPTIONS Higher water resource costs  Higher rates  Limited economic growth Increased regional water demands would have placed stress on limited supply of South Platte basin water, which would have resulted in:
  • 15.
    34,000 9,437 0 10,000 20,000 30,000 40,000 AcreFeet Projected BuildoutWater Demand Current Water Resources Additional Water Resources 28%
  • 16.
  • 17.
    Total peak day= 111 MGD Cost: 57MGD * $4.4M/MGD = $250.8M 44 15 43 14 0 20 40 60 80 100 SWTF NWTF MGD Water Treatment Plants Current Peak Capacity Additional Peak Capacity Required
  • 18.
    Cost: 3.8 MGD* $8,000,000/MGD = $30.4M 16.66 3.82 0.00 5.00 10.00 15.00 20.00 25.00 MGD Wastewater Treatment Facility Current Peak Day Design MGD Additional Capacity Needed MGD
  • 19.
    FINANCING INFRASTRUCTURE PROJECTS 20-30 year terms for projects with adequate lifespans  3.5% to 5% interest  Rates pay for debt  Debt issuers want payments tied to more secure revenues  Increases rates  Growth pays for growth vs. Generational equity
  • 20.
  • 21.
    $24,952 $5,976 $30,928 $55,866 $7,465 $63,331 $- $10,000 $20,000 $30,000 $40,000 $50,000 $60,000 $70,000 Water Sewer Combined SingleFamily Water and Sewer Tap Fees Comparison 2018 vs Non- Conserving 2017 Actual Non-Conserving 105%
  • 22.
    CONSERVATION  Rebate programs2003-2012  Toilets – Clothes Washers – Urinals  Landscape Regulations -2004  Limited turf areas  Irrigation audit  Weather based controllers  Soil amendment inspection  Funded staff  Conservation based tap fees  Linking water supply with Comprehensive Plan  WaterSense Fixtures (Colorado State Regulation)
  • 23.
    RATES OVER TIME 1954-1992 Winter/Summer  Summer Less Expensive 1993-2005  3 tiers  1st tier “Lifeline” 2006-2018  System generally developed for buildout  R & R and growth through tap fees Future  Additional Tiers  Tap Fee surcharge 0.00% 1.00% 2.00% 3.00% 4.00% 5.00% 6.00% 7.00% 8.00% 9.00% 10.00% 1995 1996 1997 1998 1999 2000 2001 2002 2003 2004 2005 2006 2007 2008 2009 2010 2011 2012 2013 2014 2015 2016 2017 2018
  • 25.
    RATE COMMUNICATIONS  Startedto feel rate increase stress in 2017-2018 cycle  8% water 6% sewer  Trying to get out ahead of the 2019-2020 cycle  Direct mailers  Quarterly articles  Focused on understanding our system  Ongoing Value of Water campaign  Include level of service discussions  More to do
  • 26.
    WATER AND WASTEWATERRATE STUDY  Data based Utility  Comprehensive infrastructure study  10,000 staff hours initial site visits  2,500 hours update 2017  Detailed usage data  Biggest Challenges  Infrastructure R&R driving future increases  Use reductions from rising rates
  • 27.
    SUMMARY  1980 citywidewater use = 28% higher than current use.  Increased water use would have required:  Acquisition of additional water resources  Expansions of the water and wastewater treatment facilities  Resulting in:  Increased rates  Increased tap fees  No additional revenue to the City Residents/Businesses Reduced water use (conservation) has resulted in savings in both resource and infrastructure costs. Each utility is unique; Your mileage may vary
  • 28.
    THANK YOU. QUESTIONS? Stu Feinglas,Senior Analyst, City of Westminster
  • 30.
    IMPACTS TO CITY: INFRASTRUCTURE& WATER RESOURCES COSTS Additional WTF capacity 52 MGD total $2,500,000/MG $130,000,000 Additional WWTF capacity 4 MGD total $5,000,000/MG $20,000,000 Additional Water Resources 7,295 AF $30,000 $218,850,000 Interest (on debt funding) $223,106,000 Total Costs $591,956,000
  • 31.
    IMPACTS TO CITY:OPERATING COSTS* Additional annual operating cost of WTF 21% increase $480,400 Additional annual operating cost of BDCWWTF & Metro 20% increase $757,600 Total additional operating costs $1,238,000 * No Additional Personnel
  • 32.
    IMPACTS TO RESIDENTSAND BUSINESSES 2 SOURCES OF REVENUE/2 WAYS TO FUND ALL COSTS Revenue Source: Rates Pays for: O&M R&R Debt Service Revenue Source: Tap Fees Pays for: New Infrastructure New Water Resources R&R
  • 33.
    IMPACT TO RESIDENTS: SINGLEFAMILY RATES –ANNUAL BILL (WATER & SEWER) 2012 Additional Charge Total Annual SF Water/Sewer Bill % Increase to 2012 Charge Water $410 $561 $971 137% Sewer $245 $63 $308 26% Total $655 $624 $1,279 95%
  • 34.
    IMPACT TO RESIDENTS/BUSINESSES: SINGLEFAMILY TAP FEES 2012 Additional Charge Total Annual SF Tap Fee % Increase Water $16,325 $16,086 $32,411 99% Sewer $4,904 $866 $5,770 18% Total $21,229 $16,952 $38,181 80%
  • 35.
    CONCLUSION  Each watersystem is unique. Results from Westminster may not apply.  Utilities can perform a similar analysis.  The $591 million dollar cost reveals the significant hardship associated with expanding supply and infrastructure today.  The cost highlights the inherent value in our current infrastructure. The cheapest water (by far) is the water we already have and the best way to keep rates and tap fees low is to conserve the water we already have.