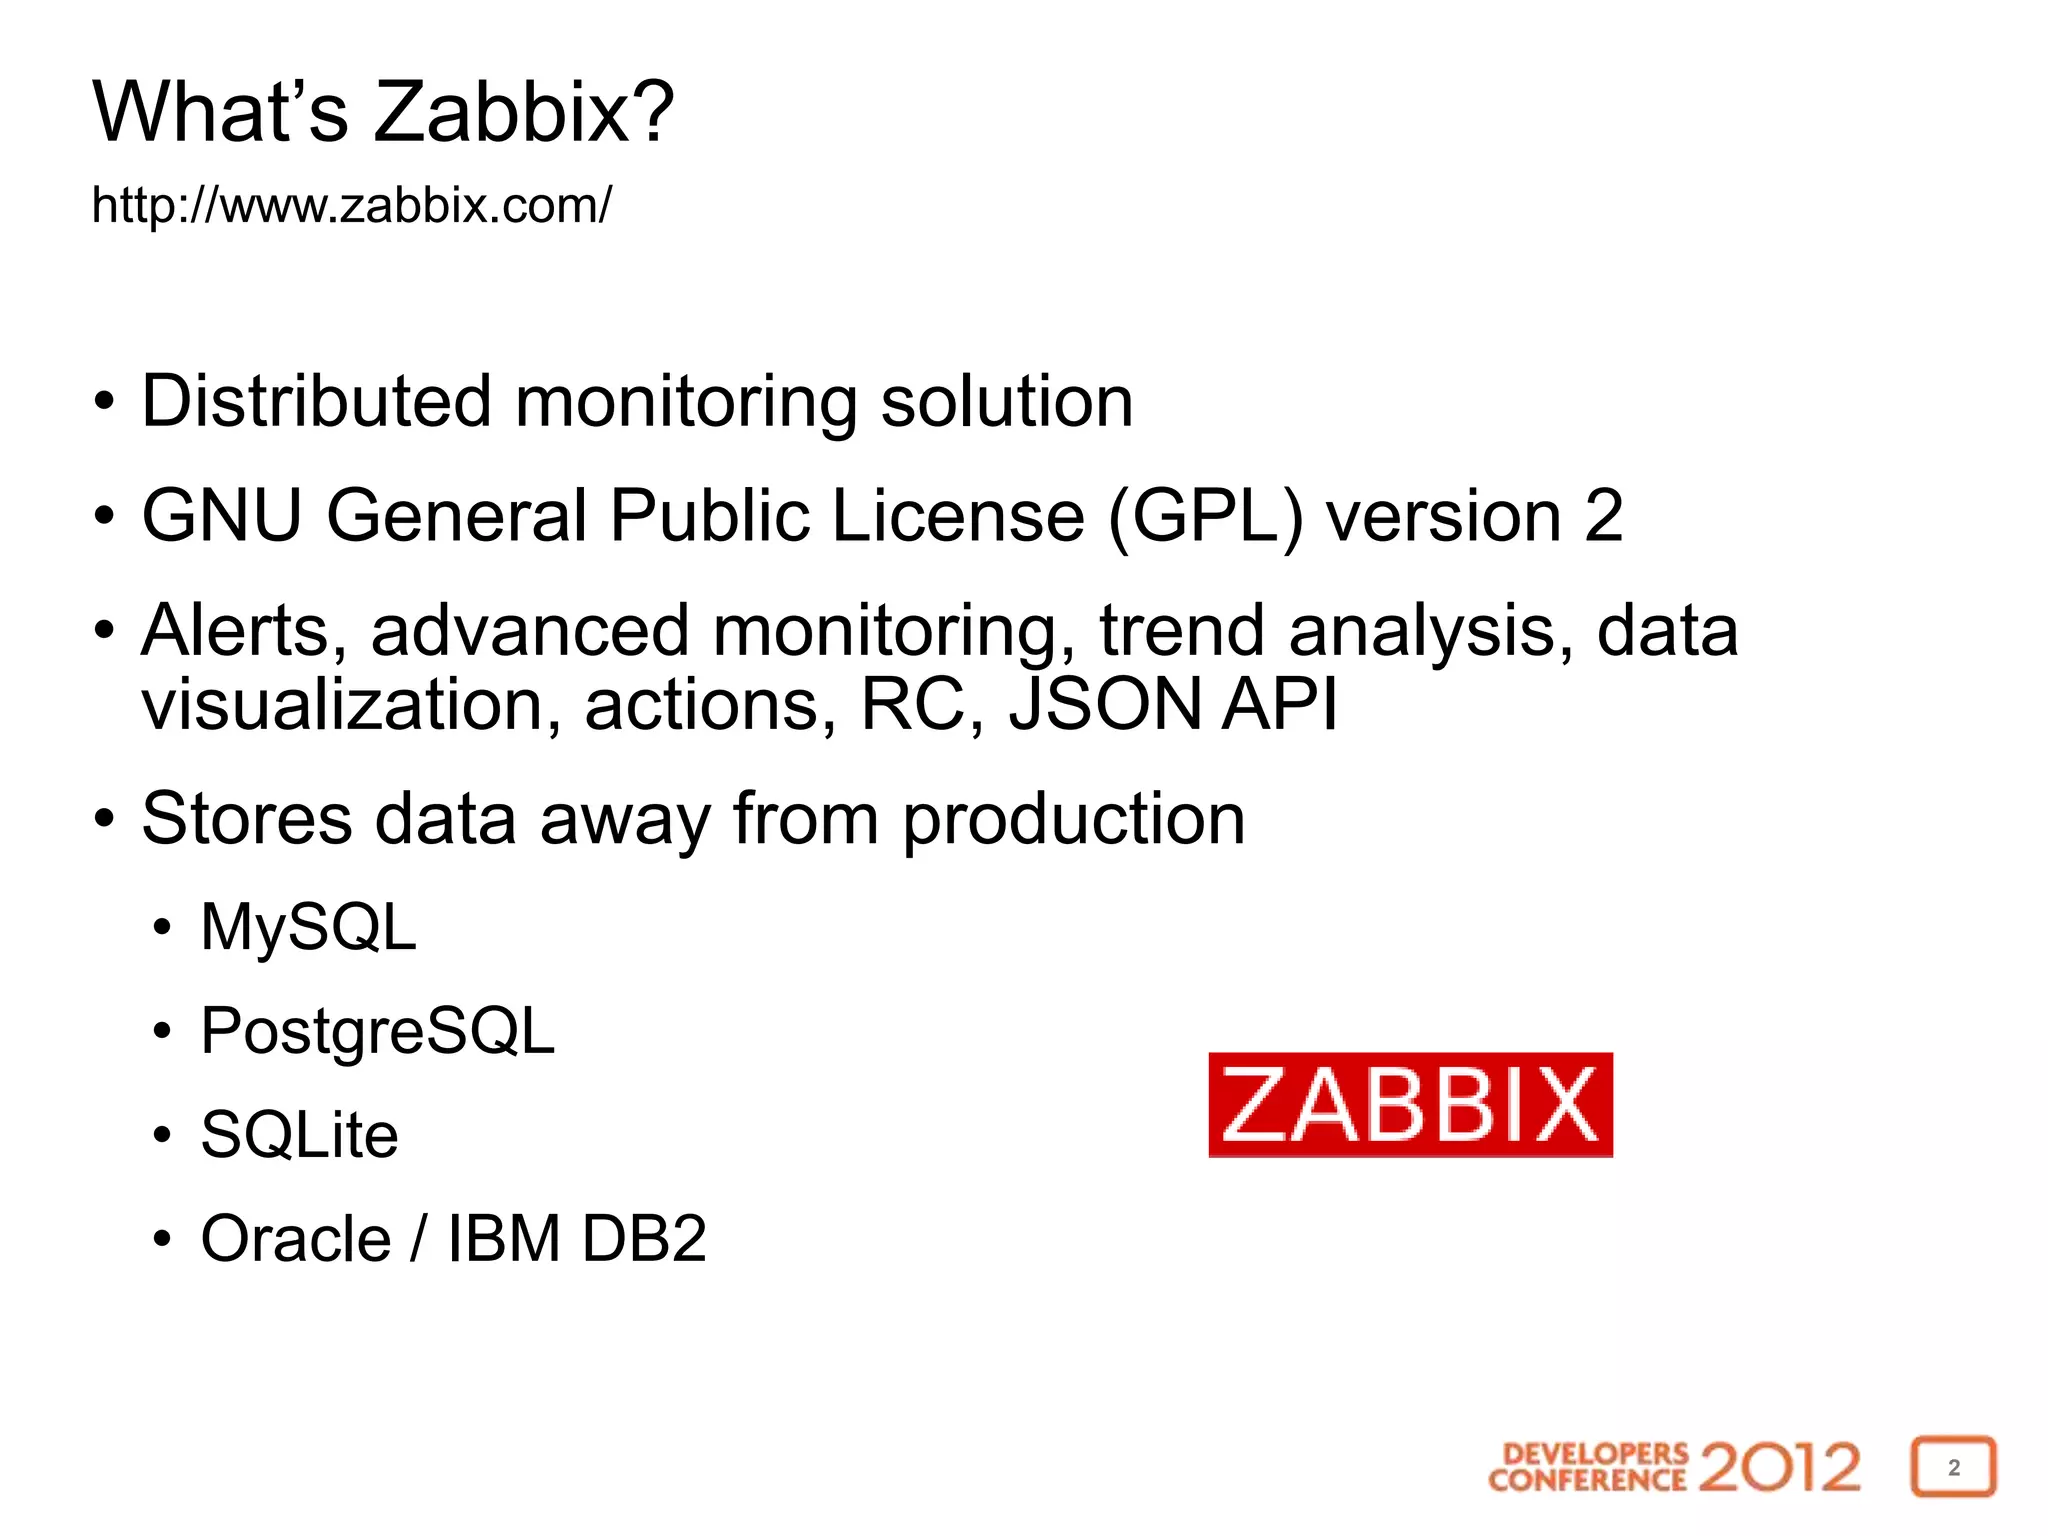
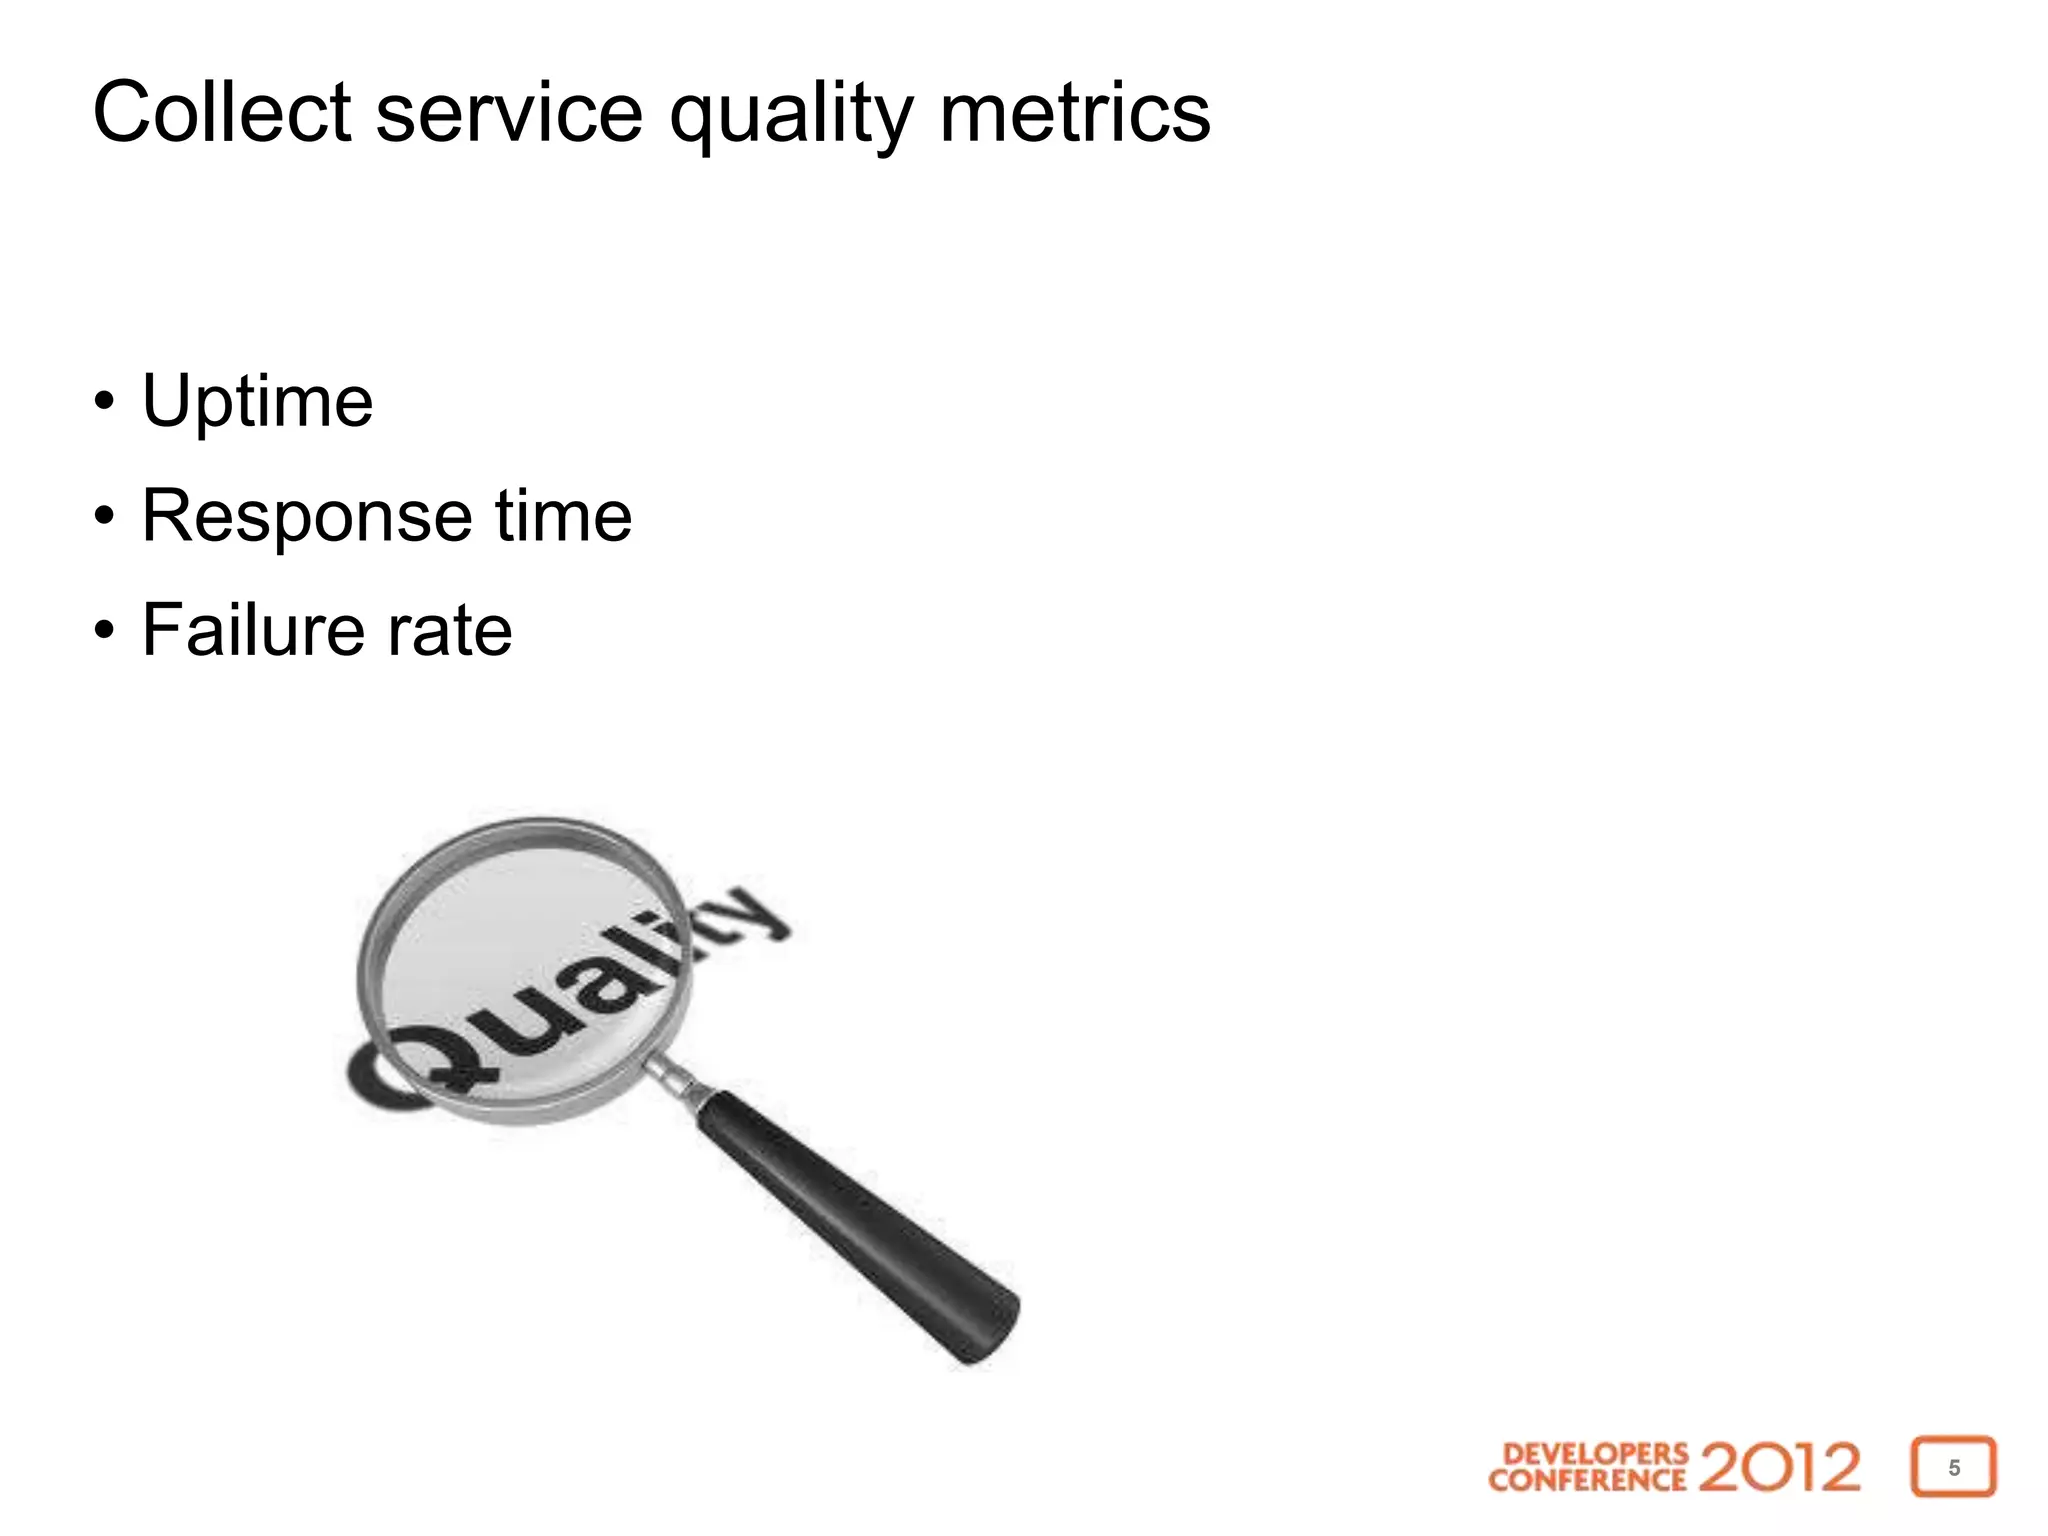
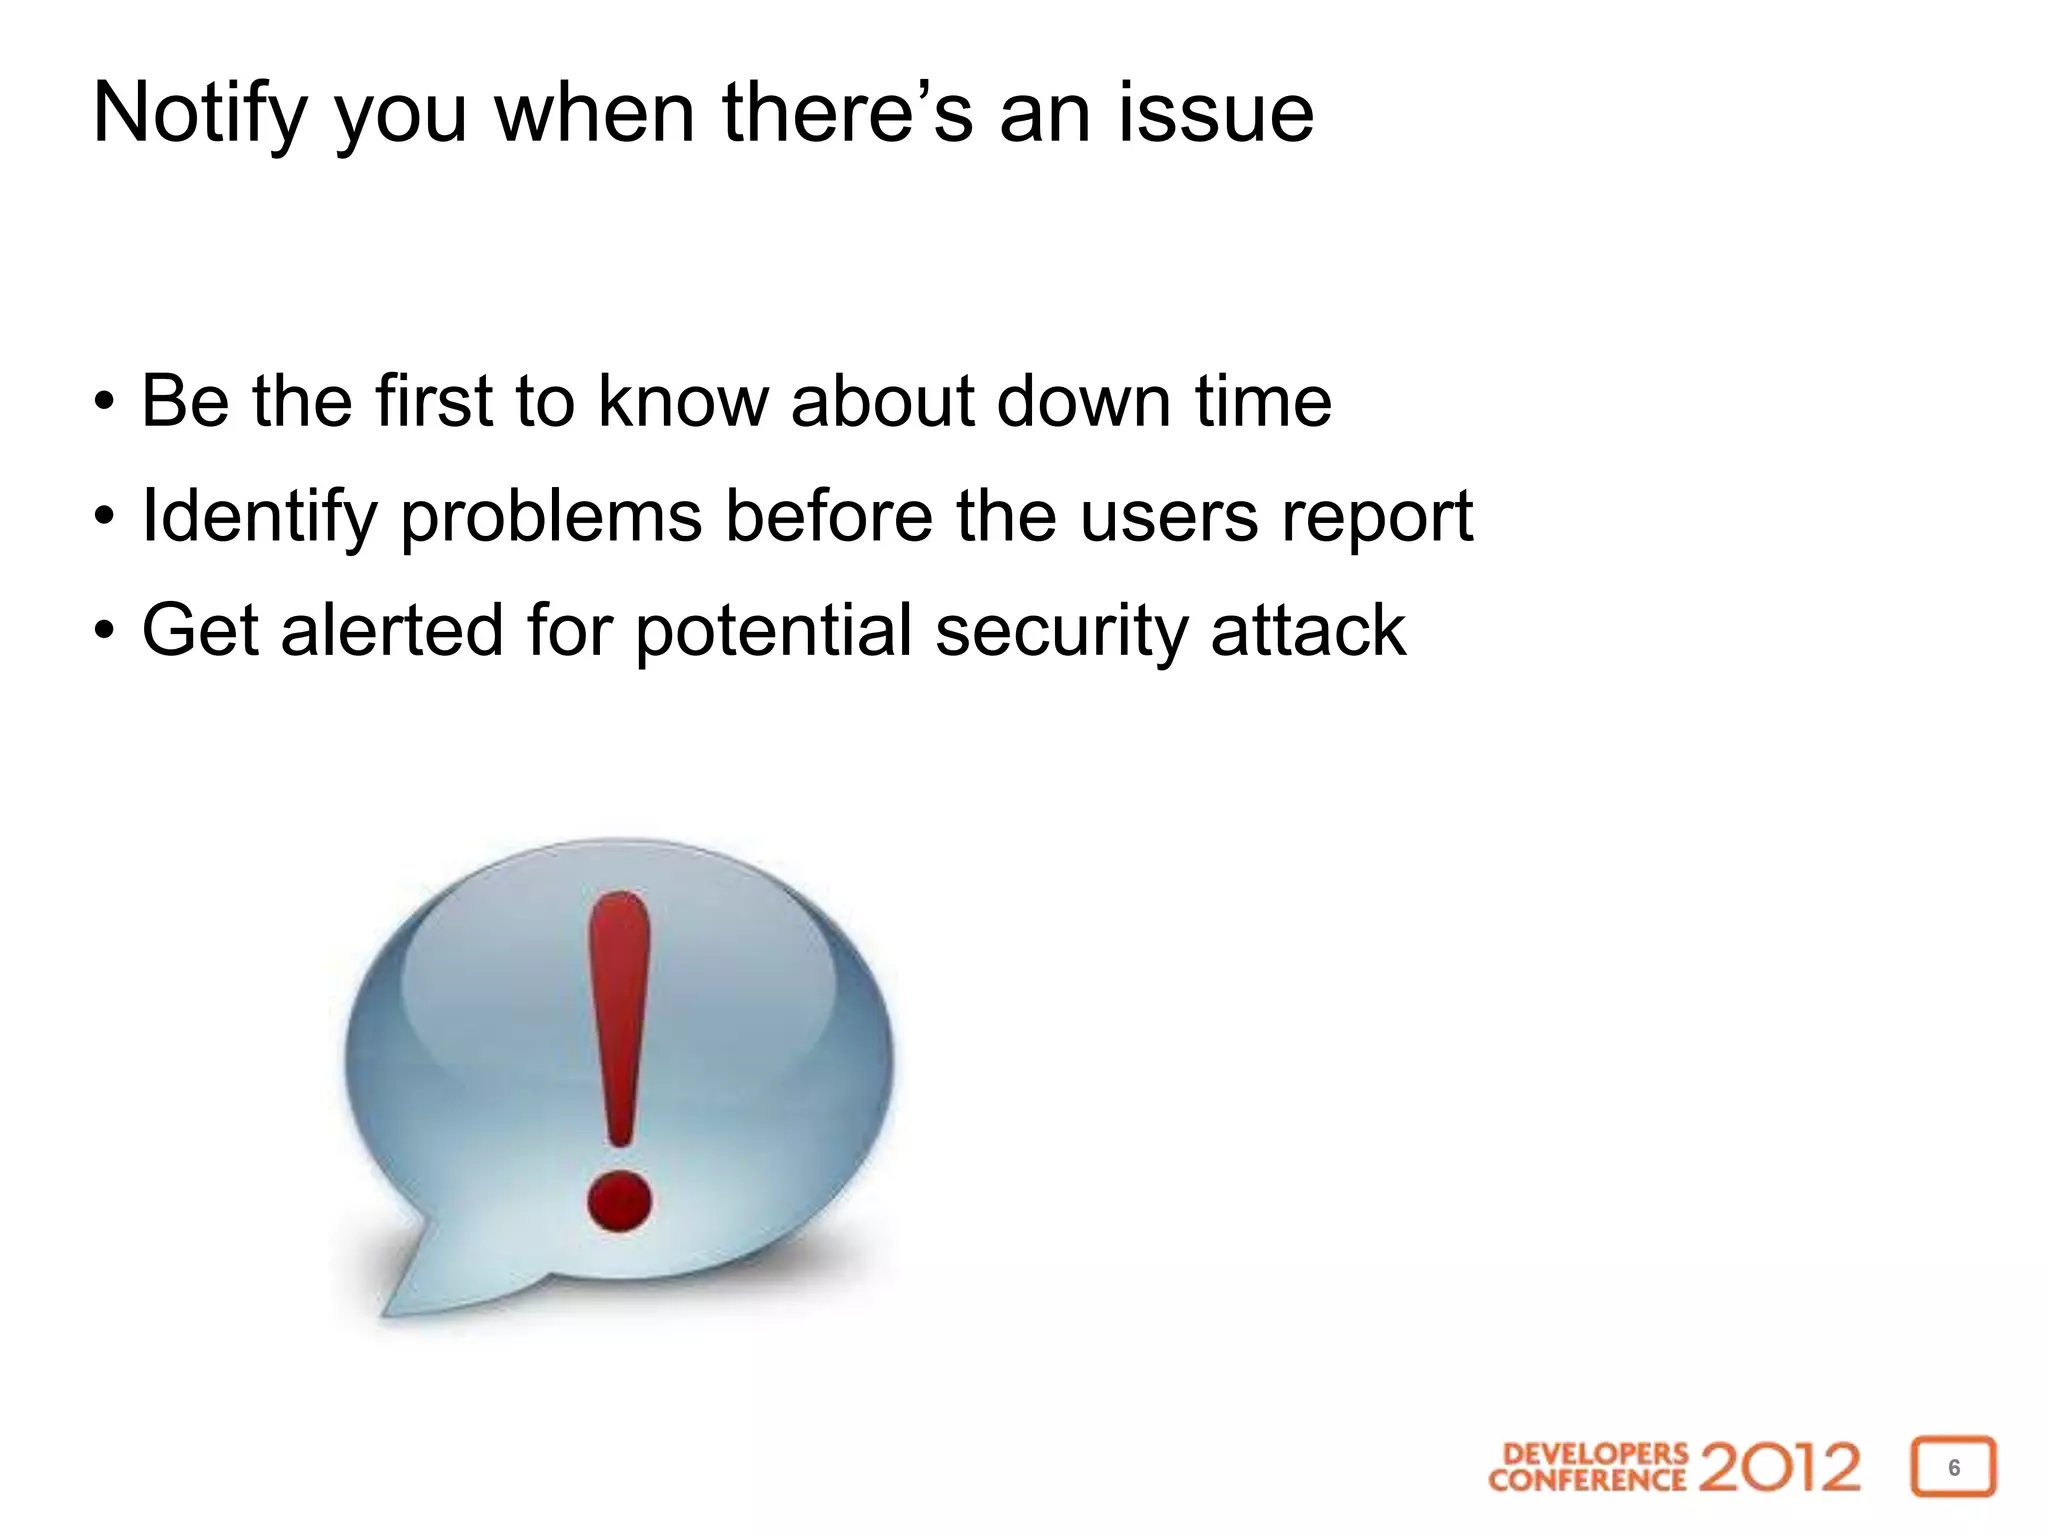
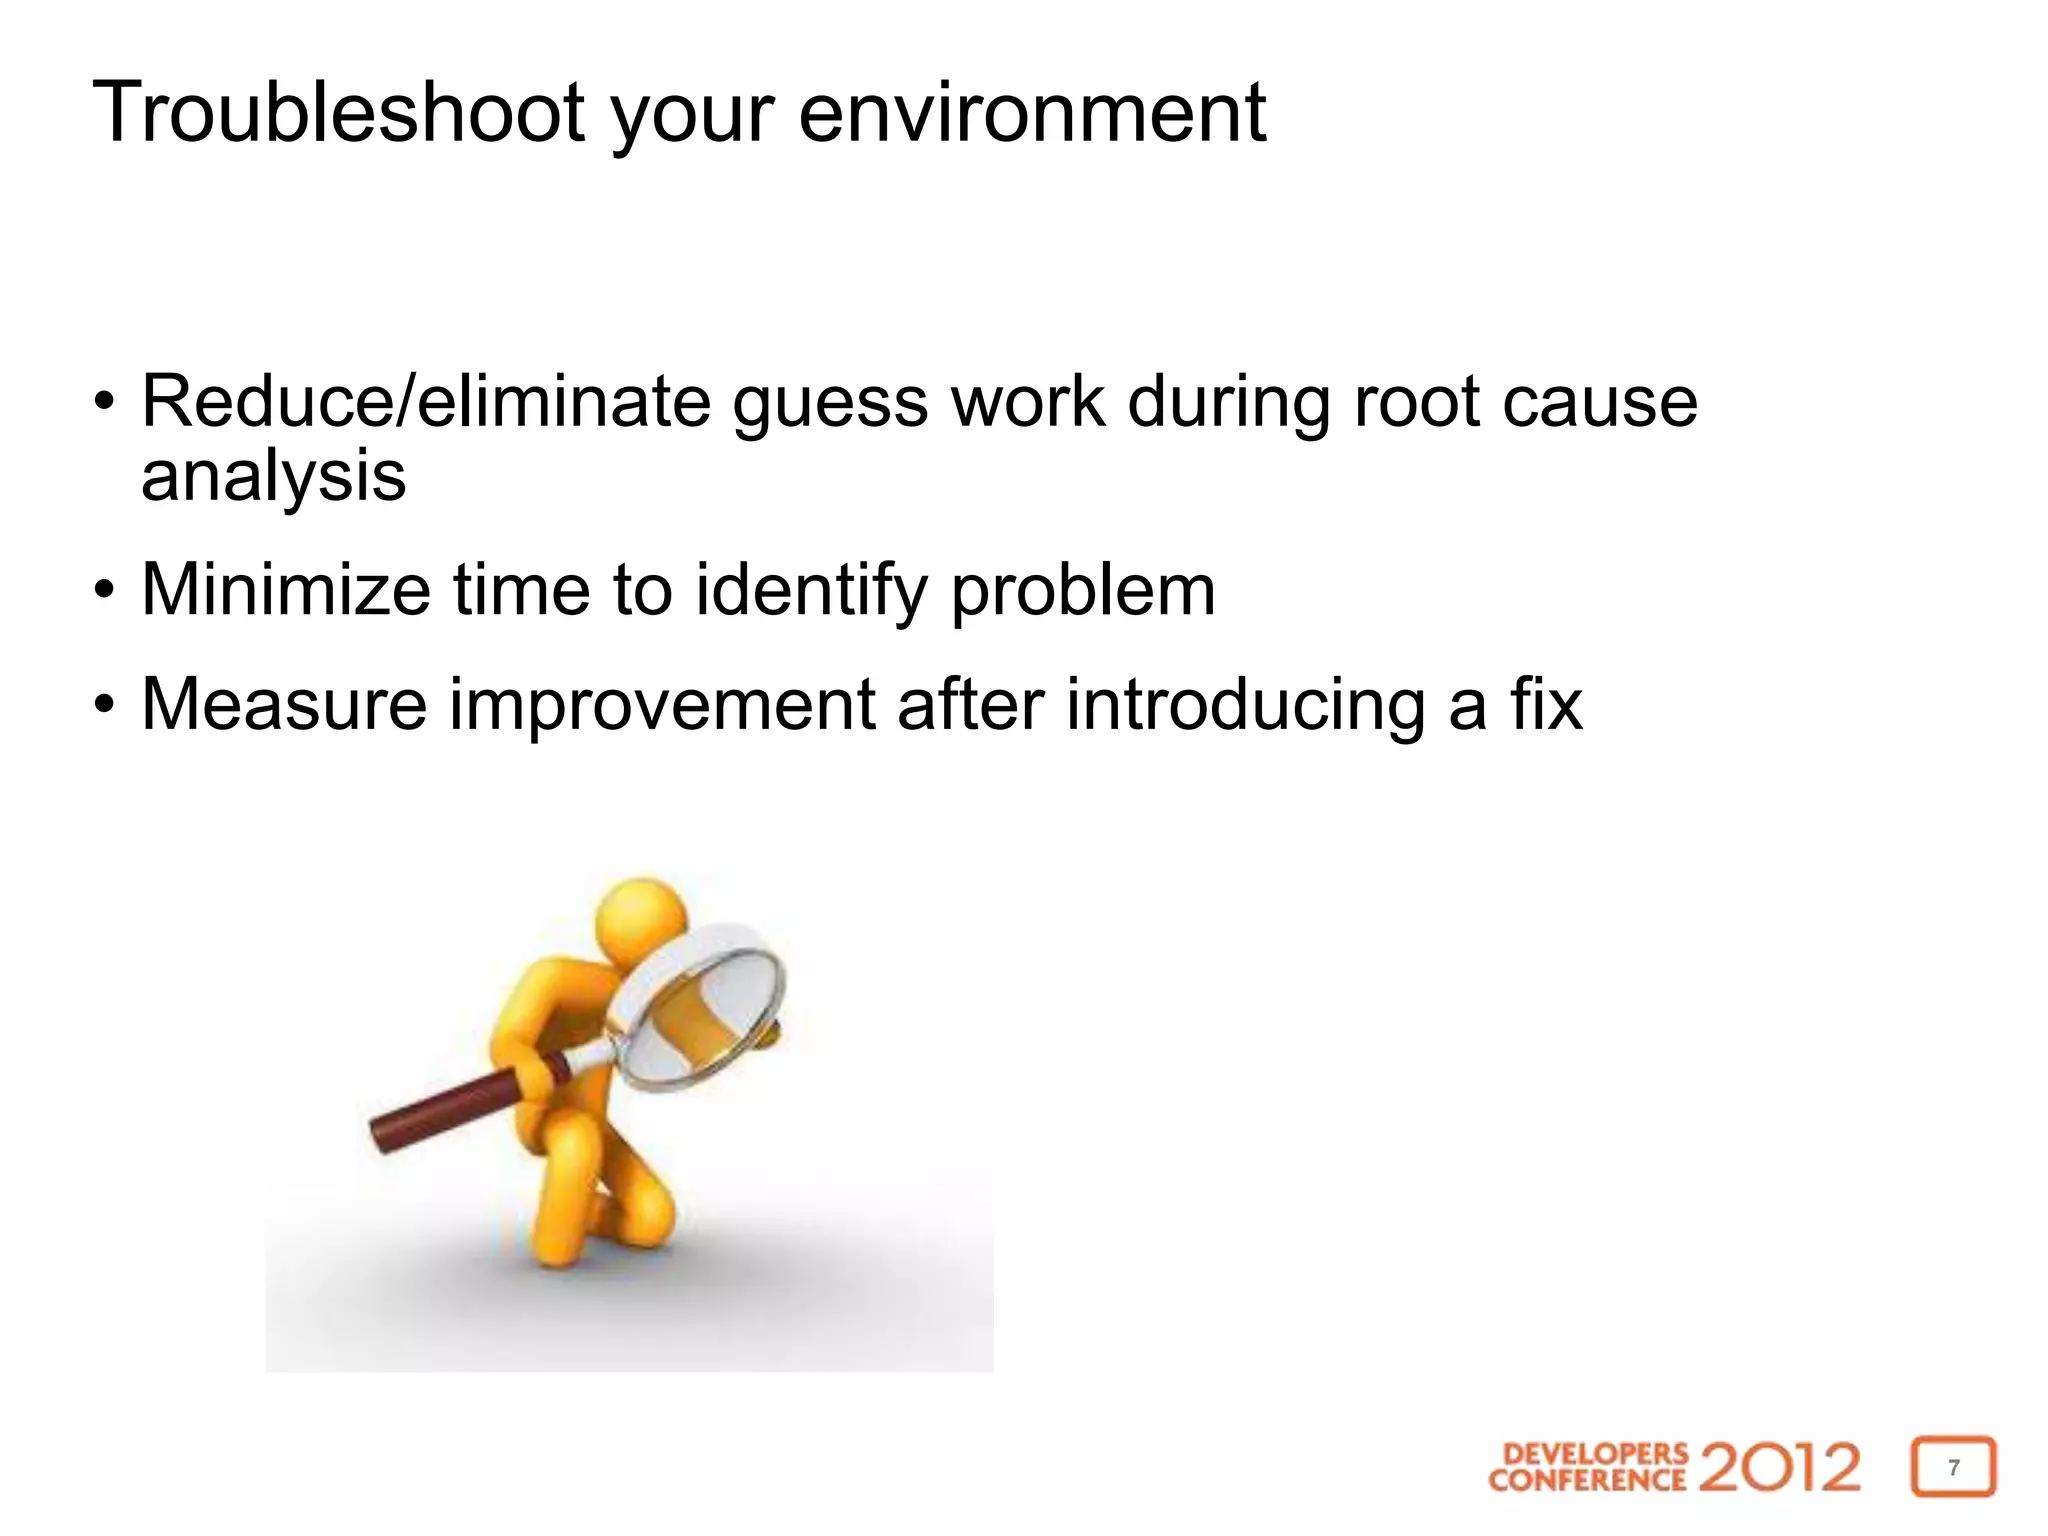
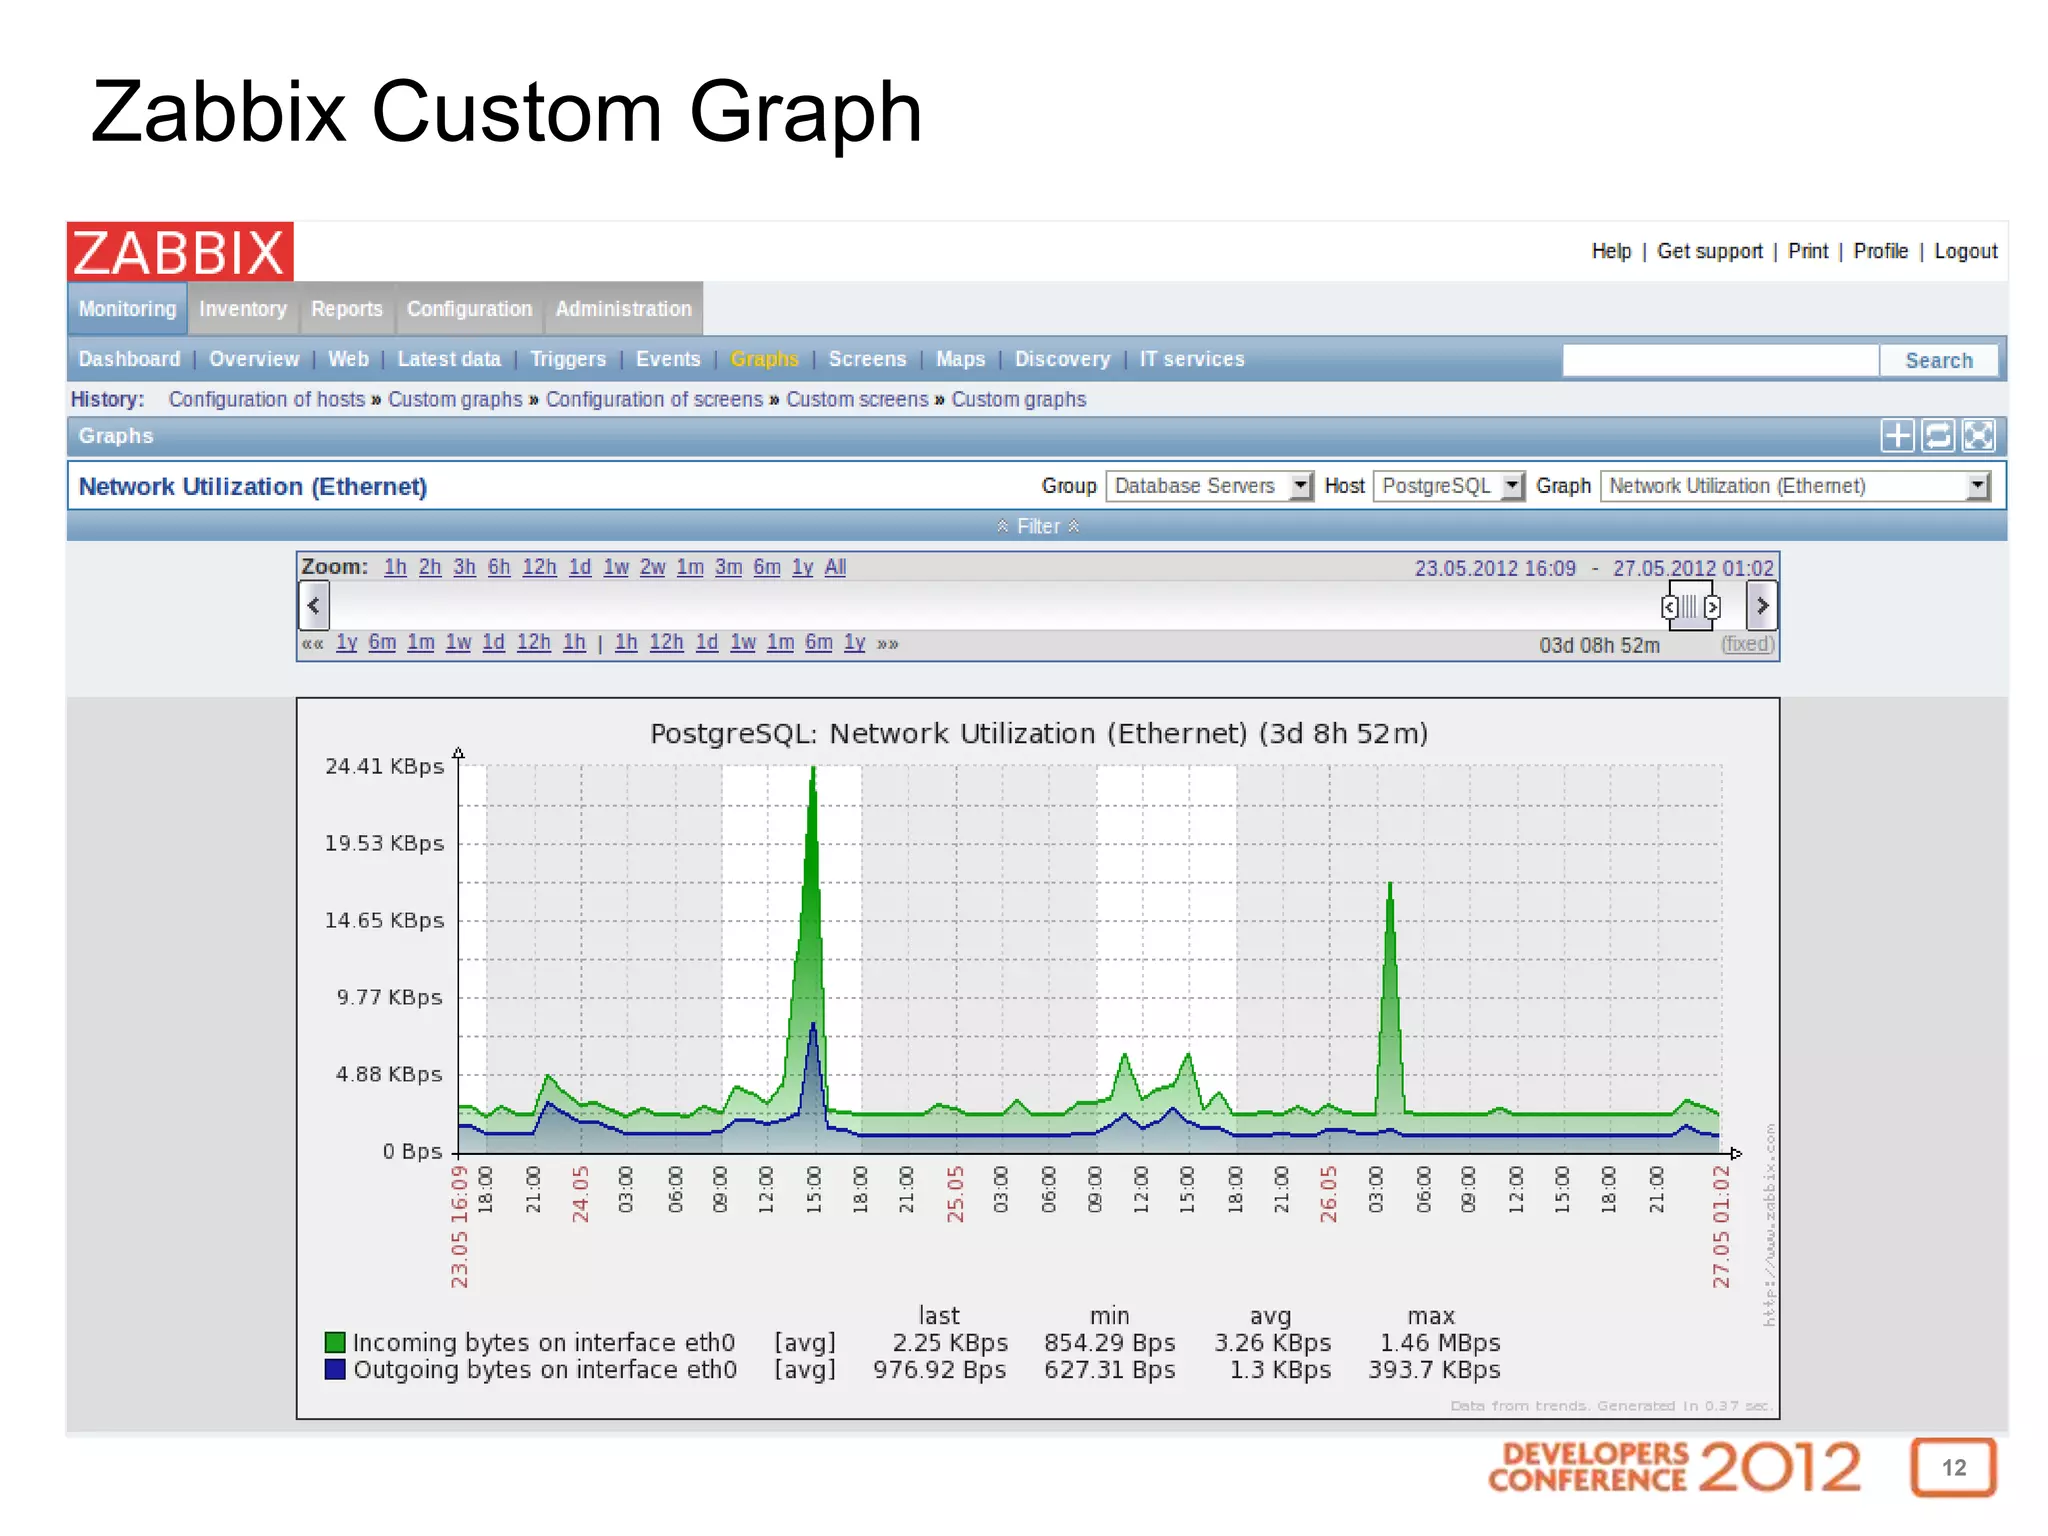
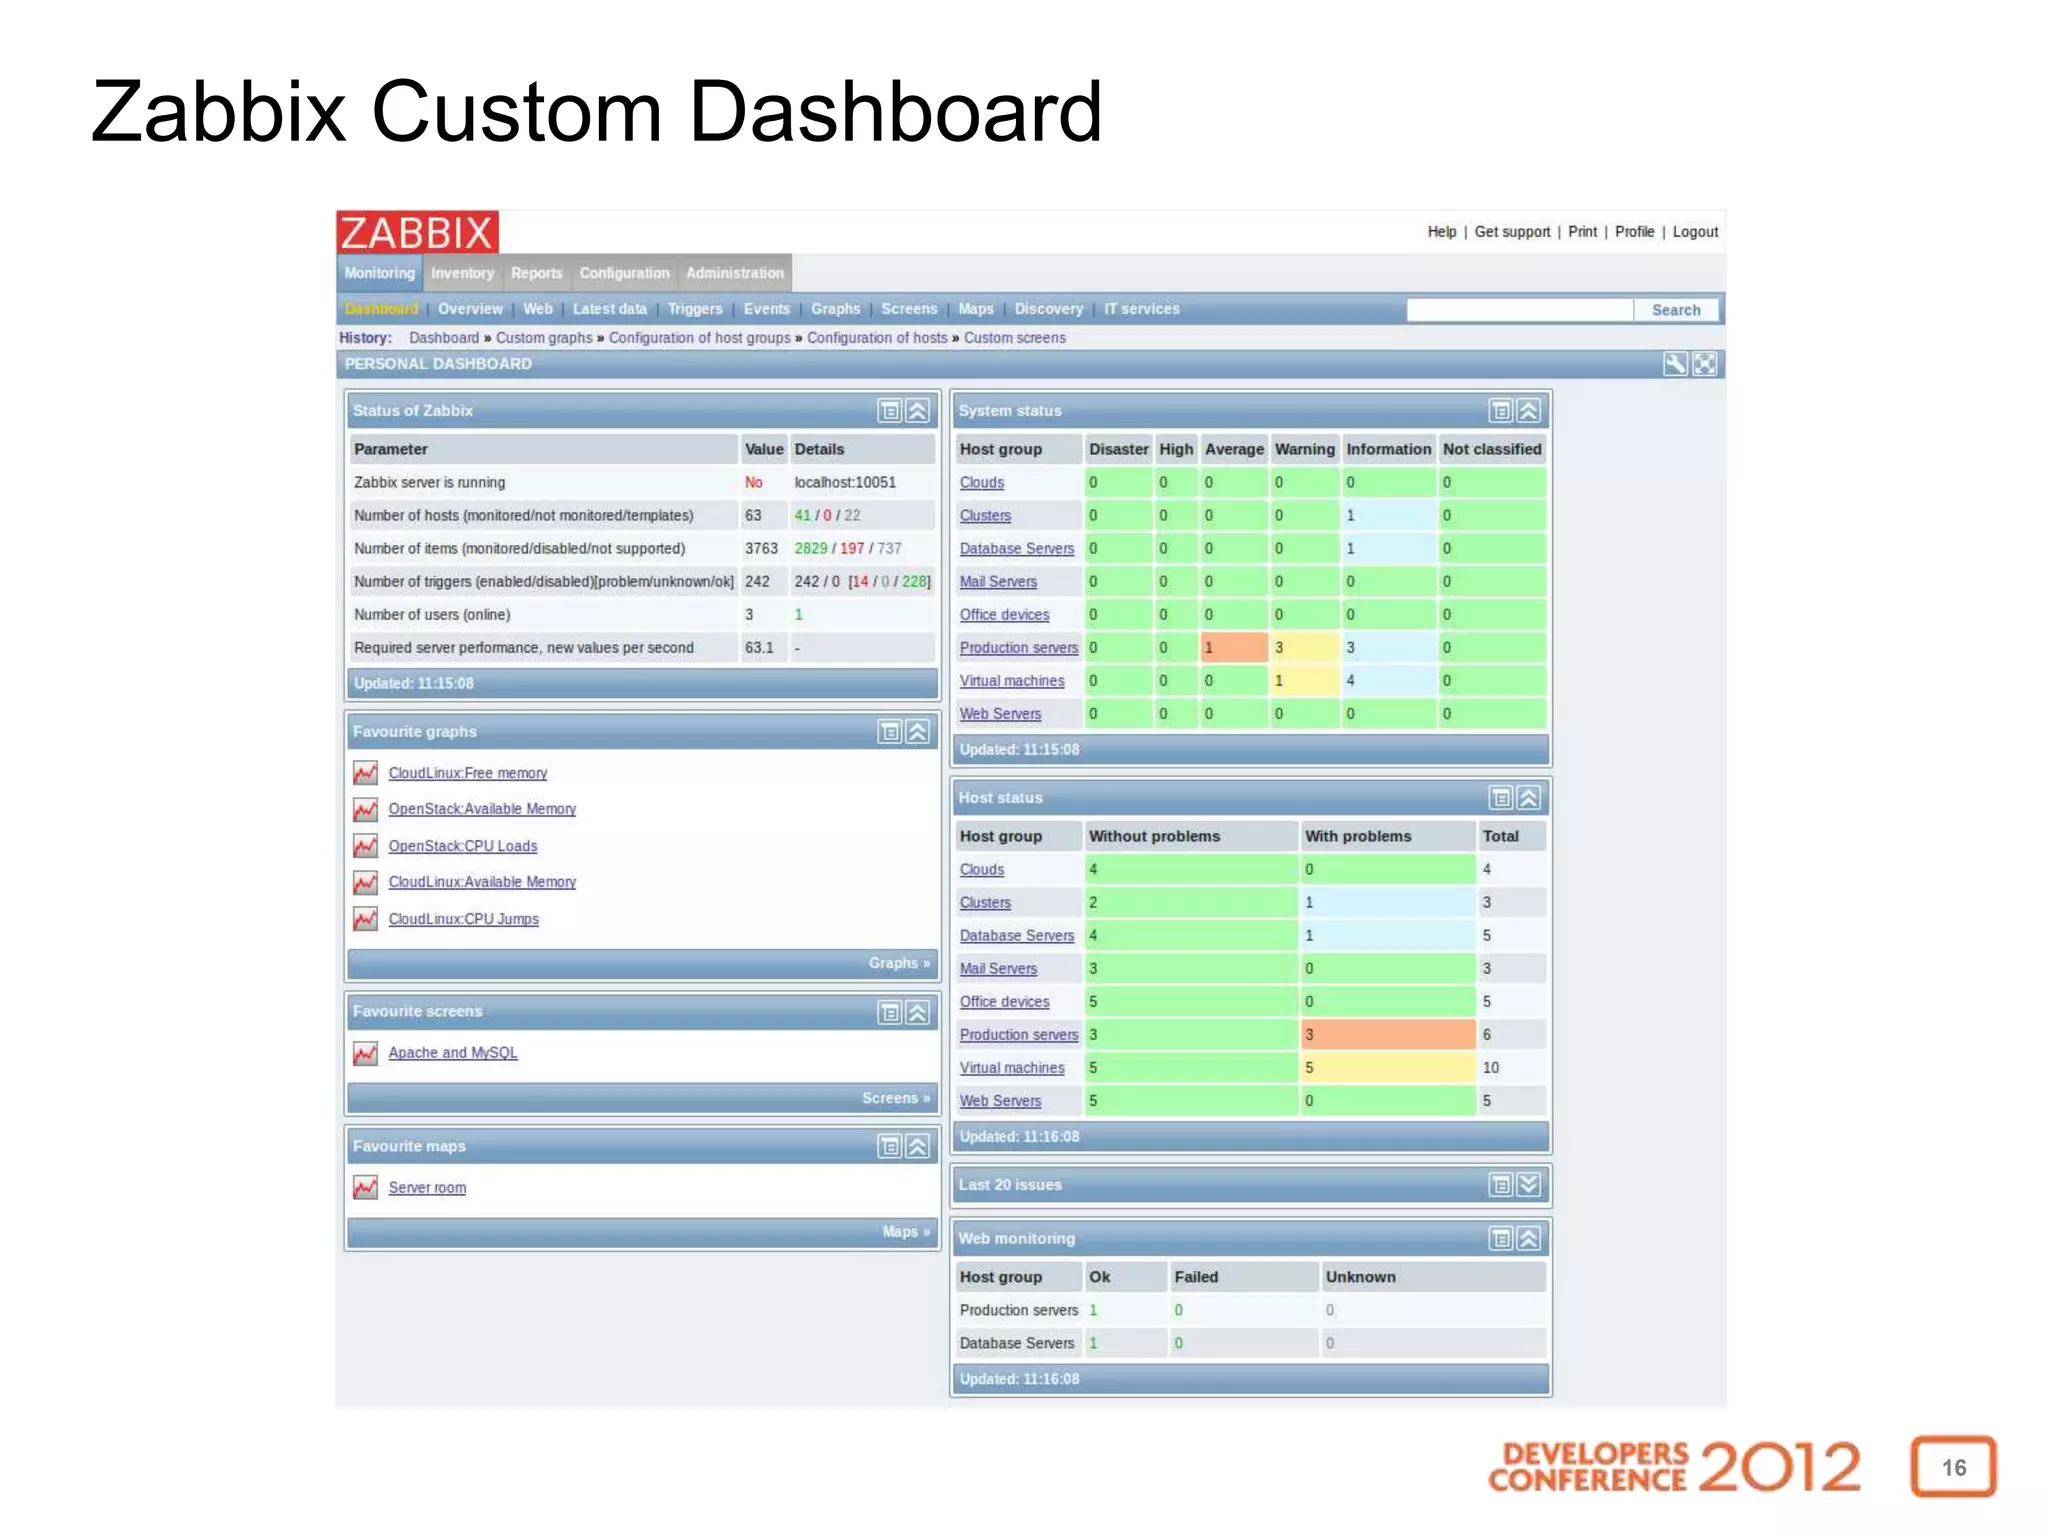
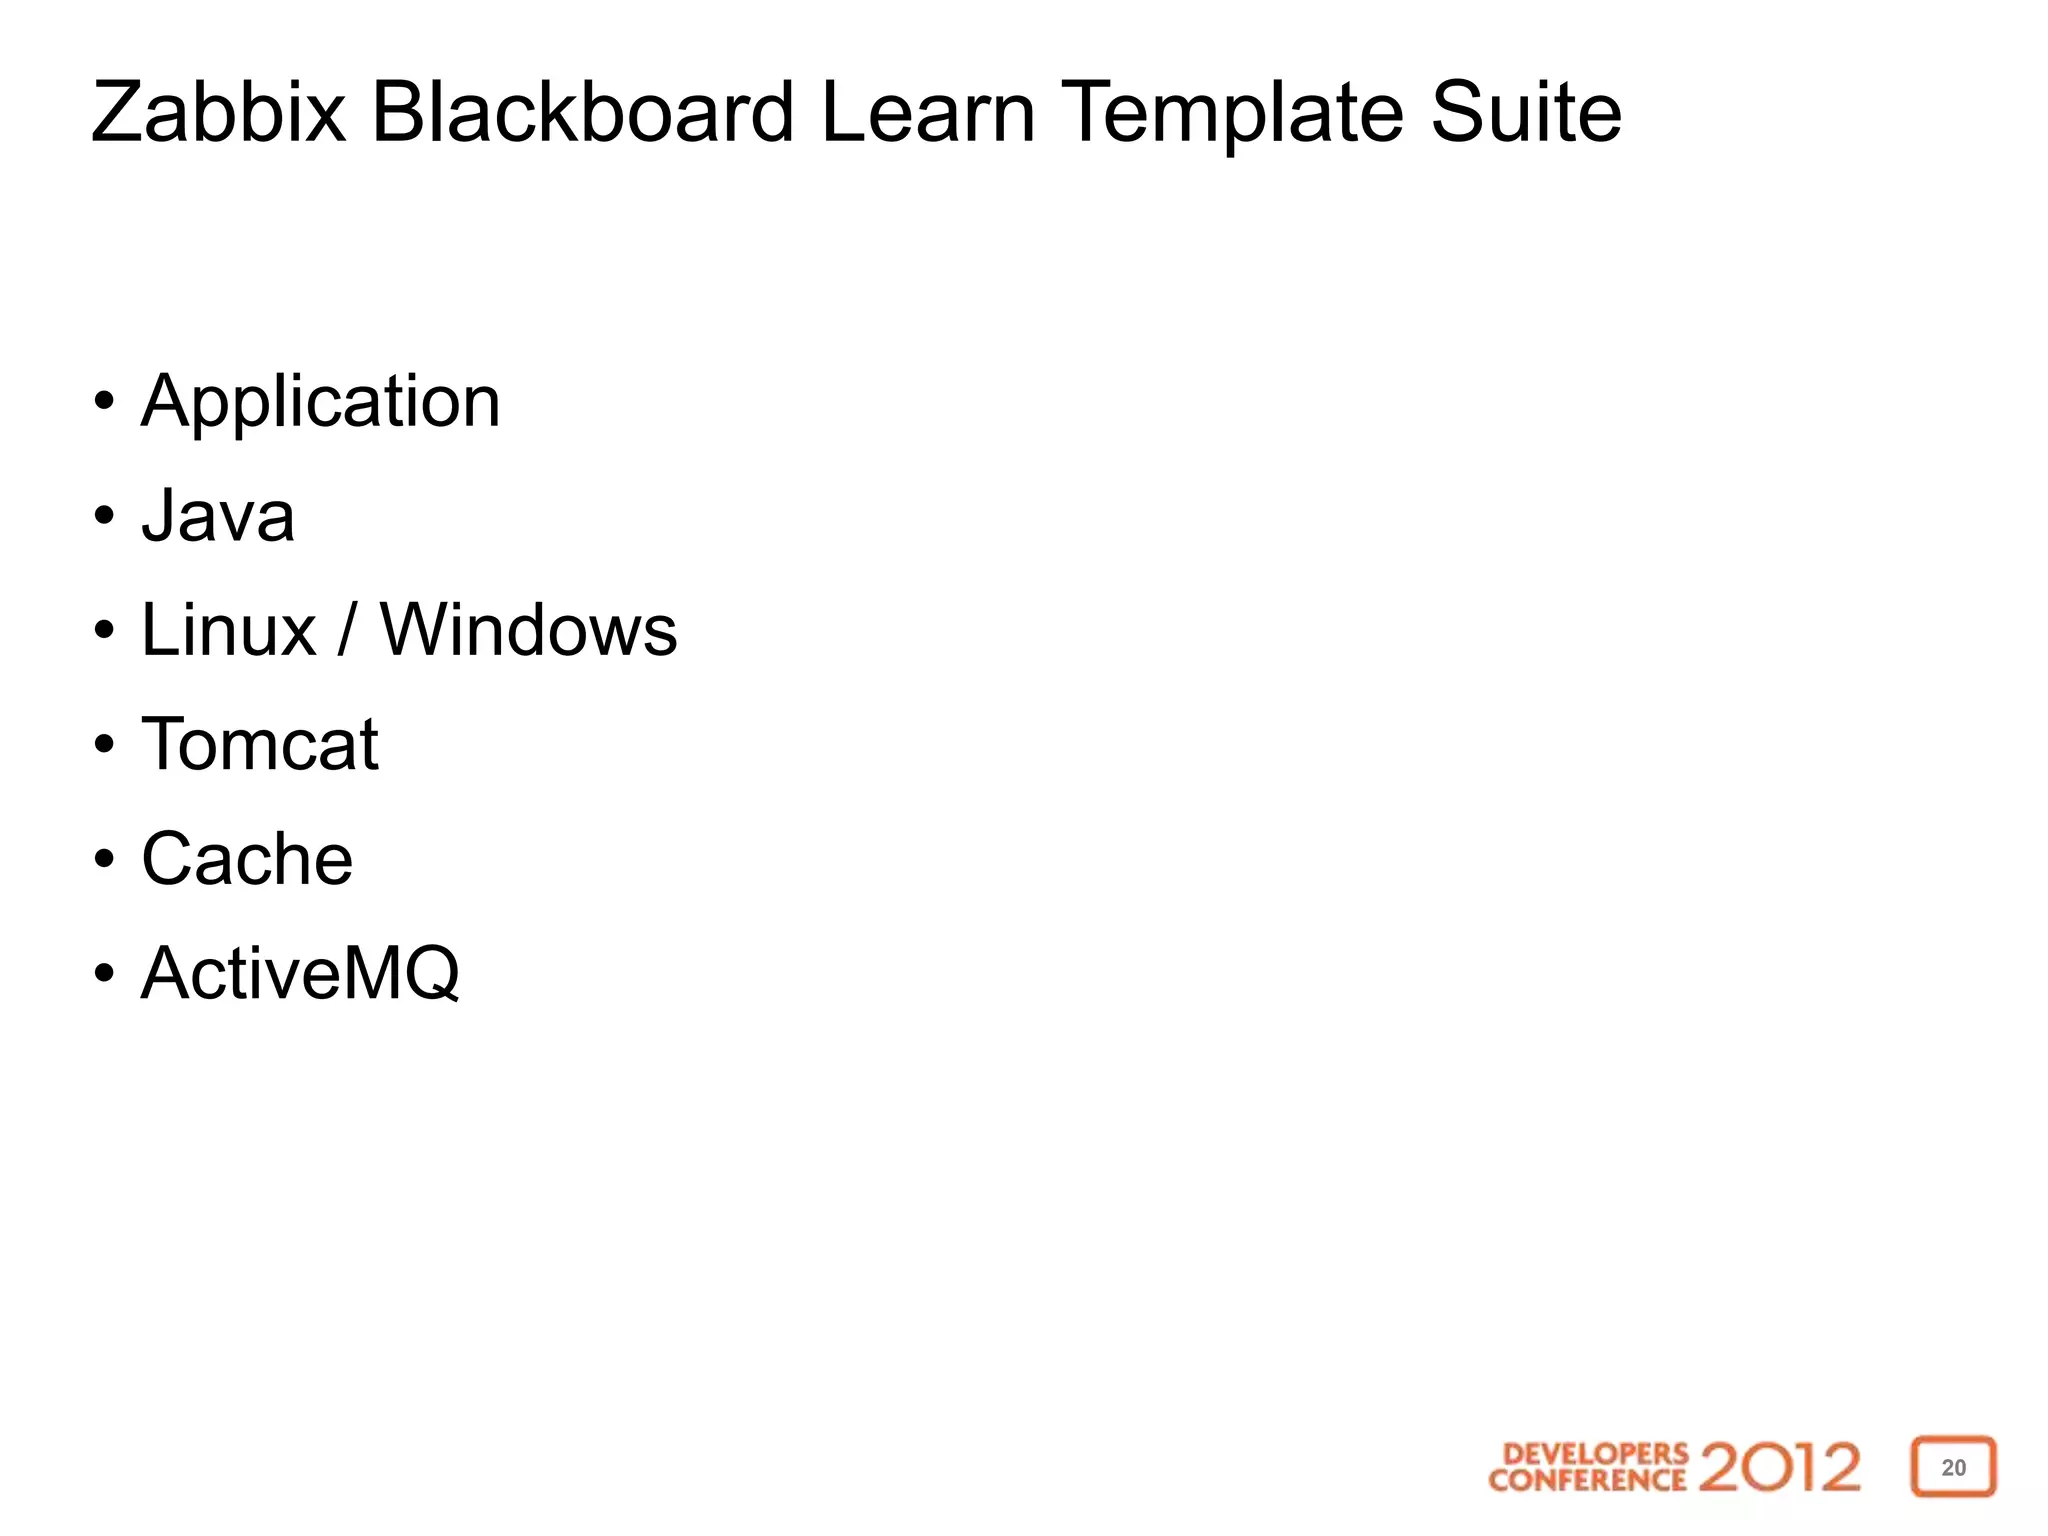
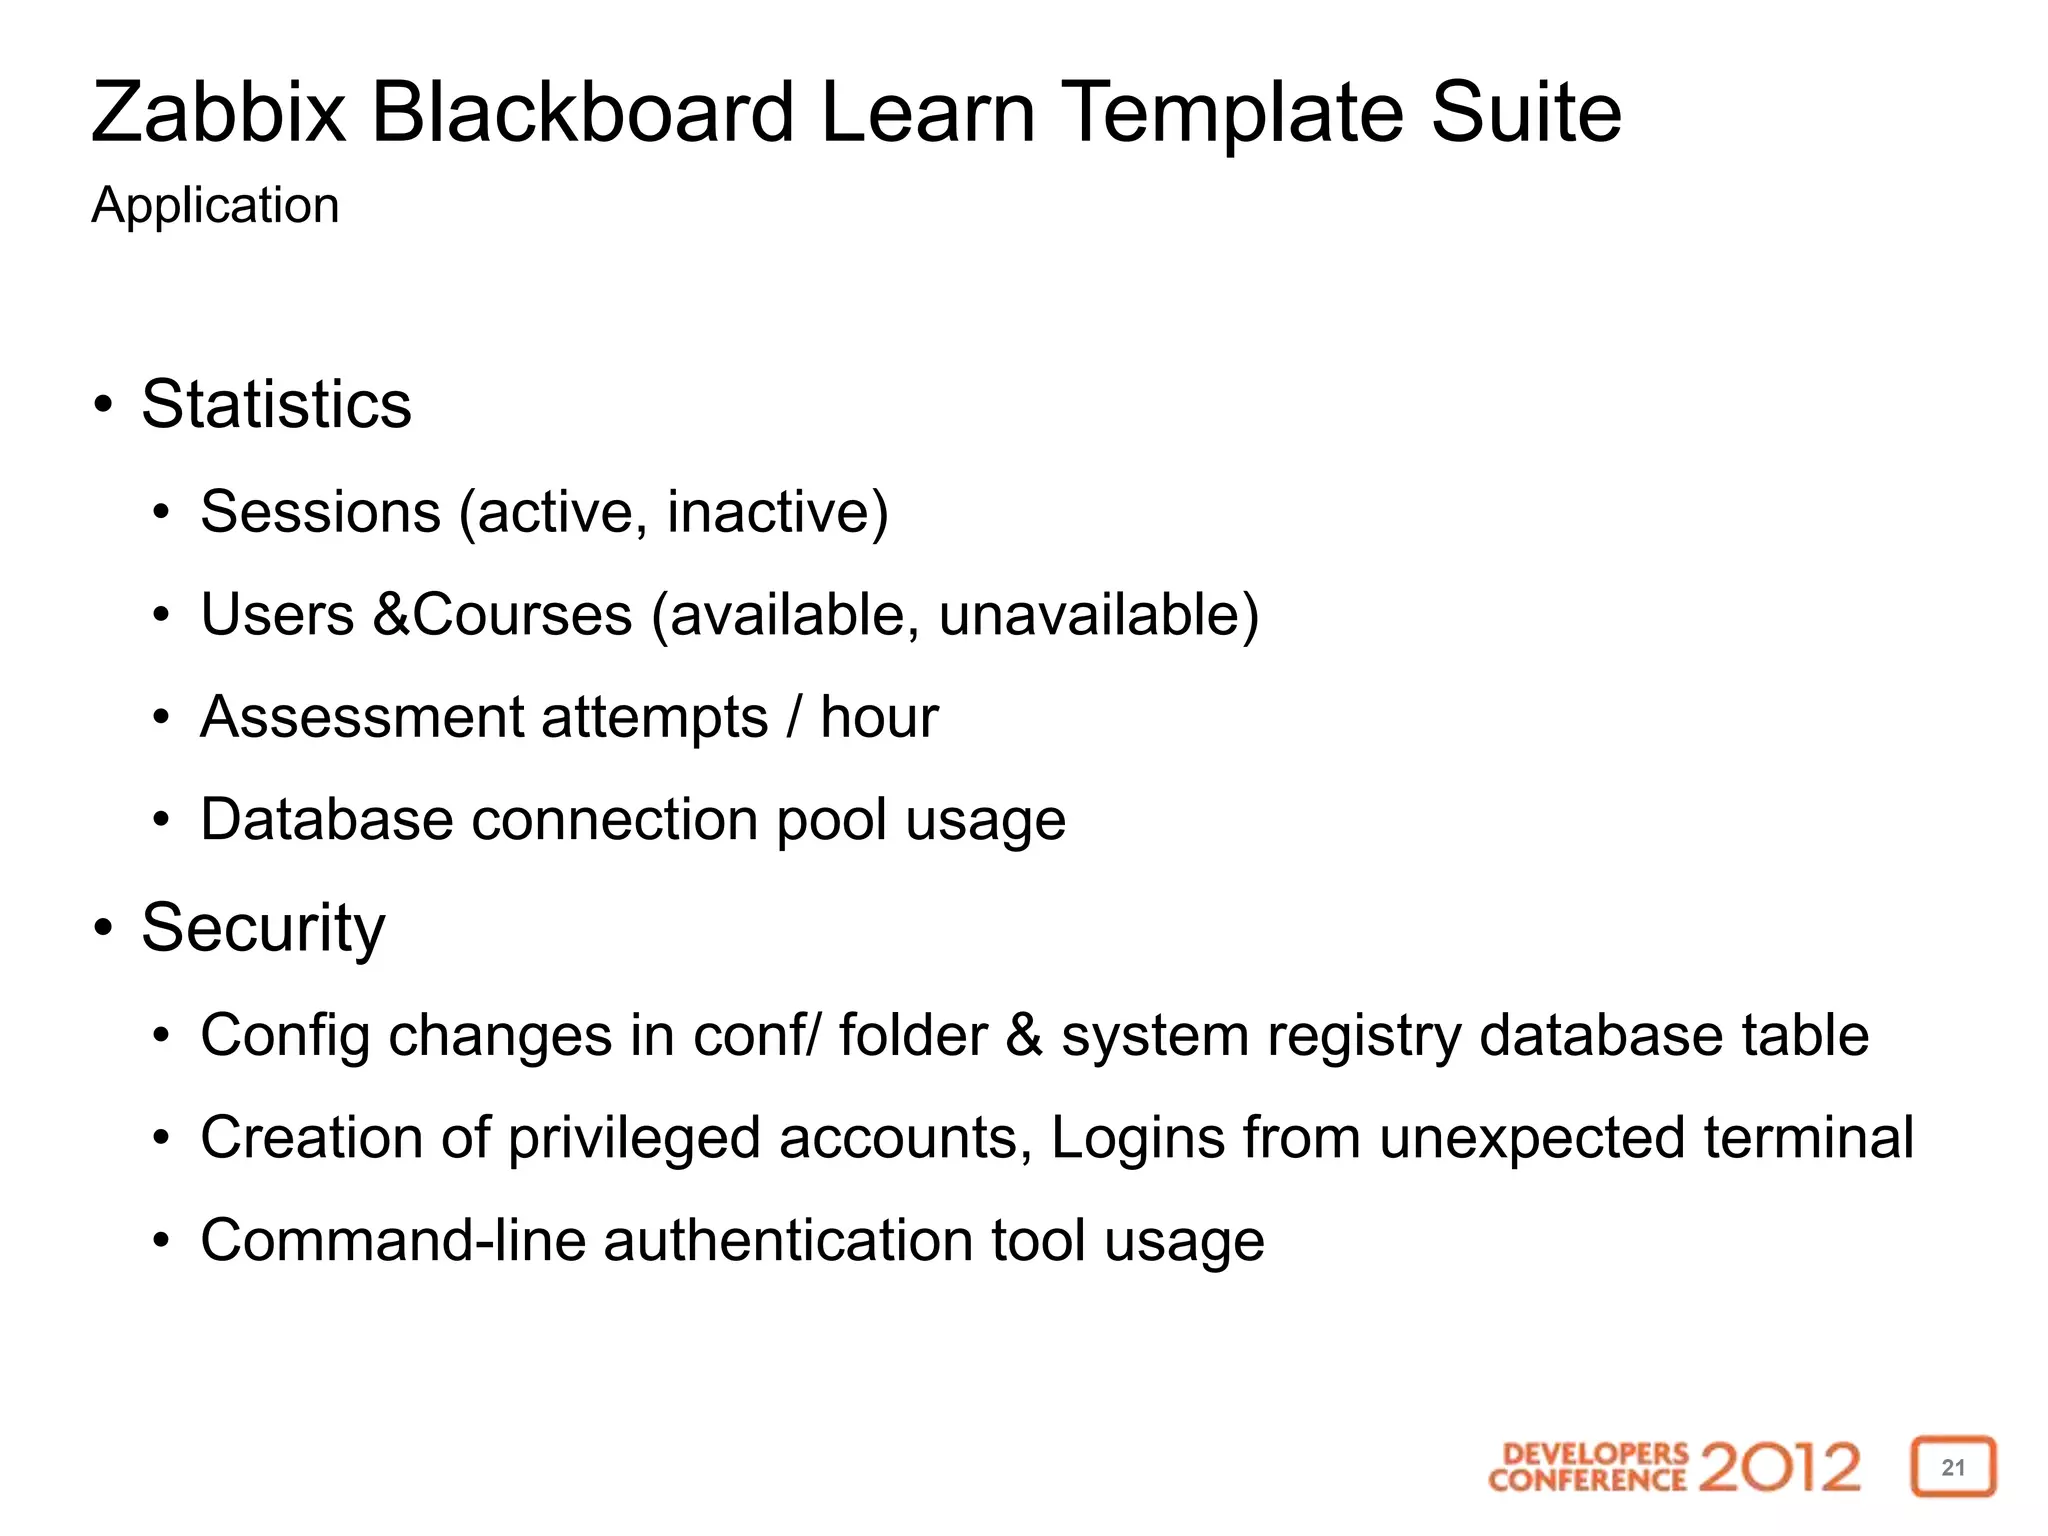
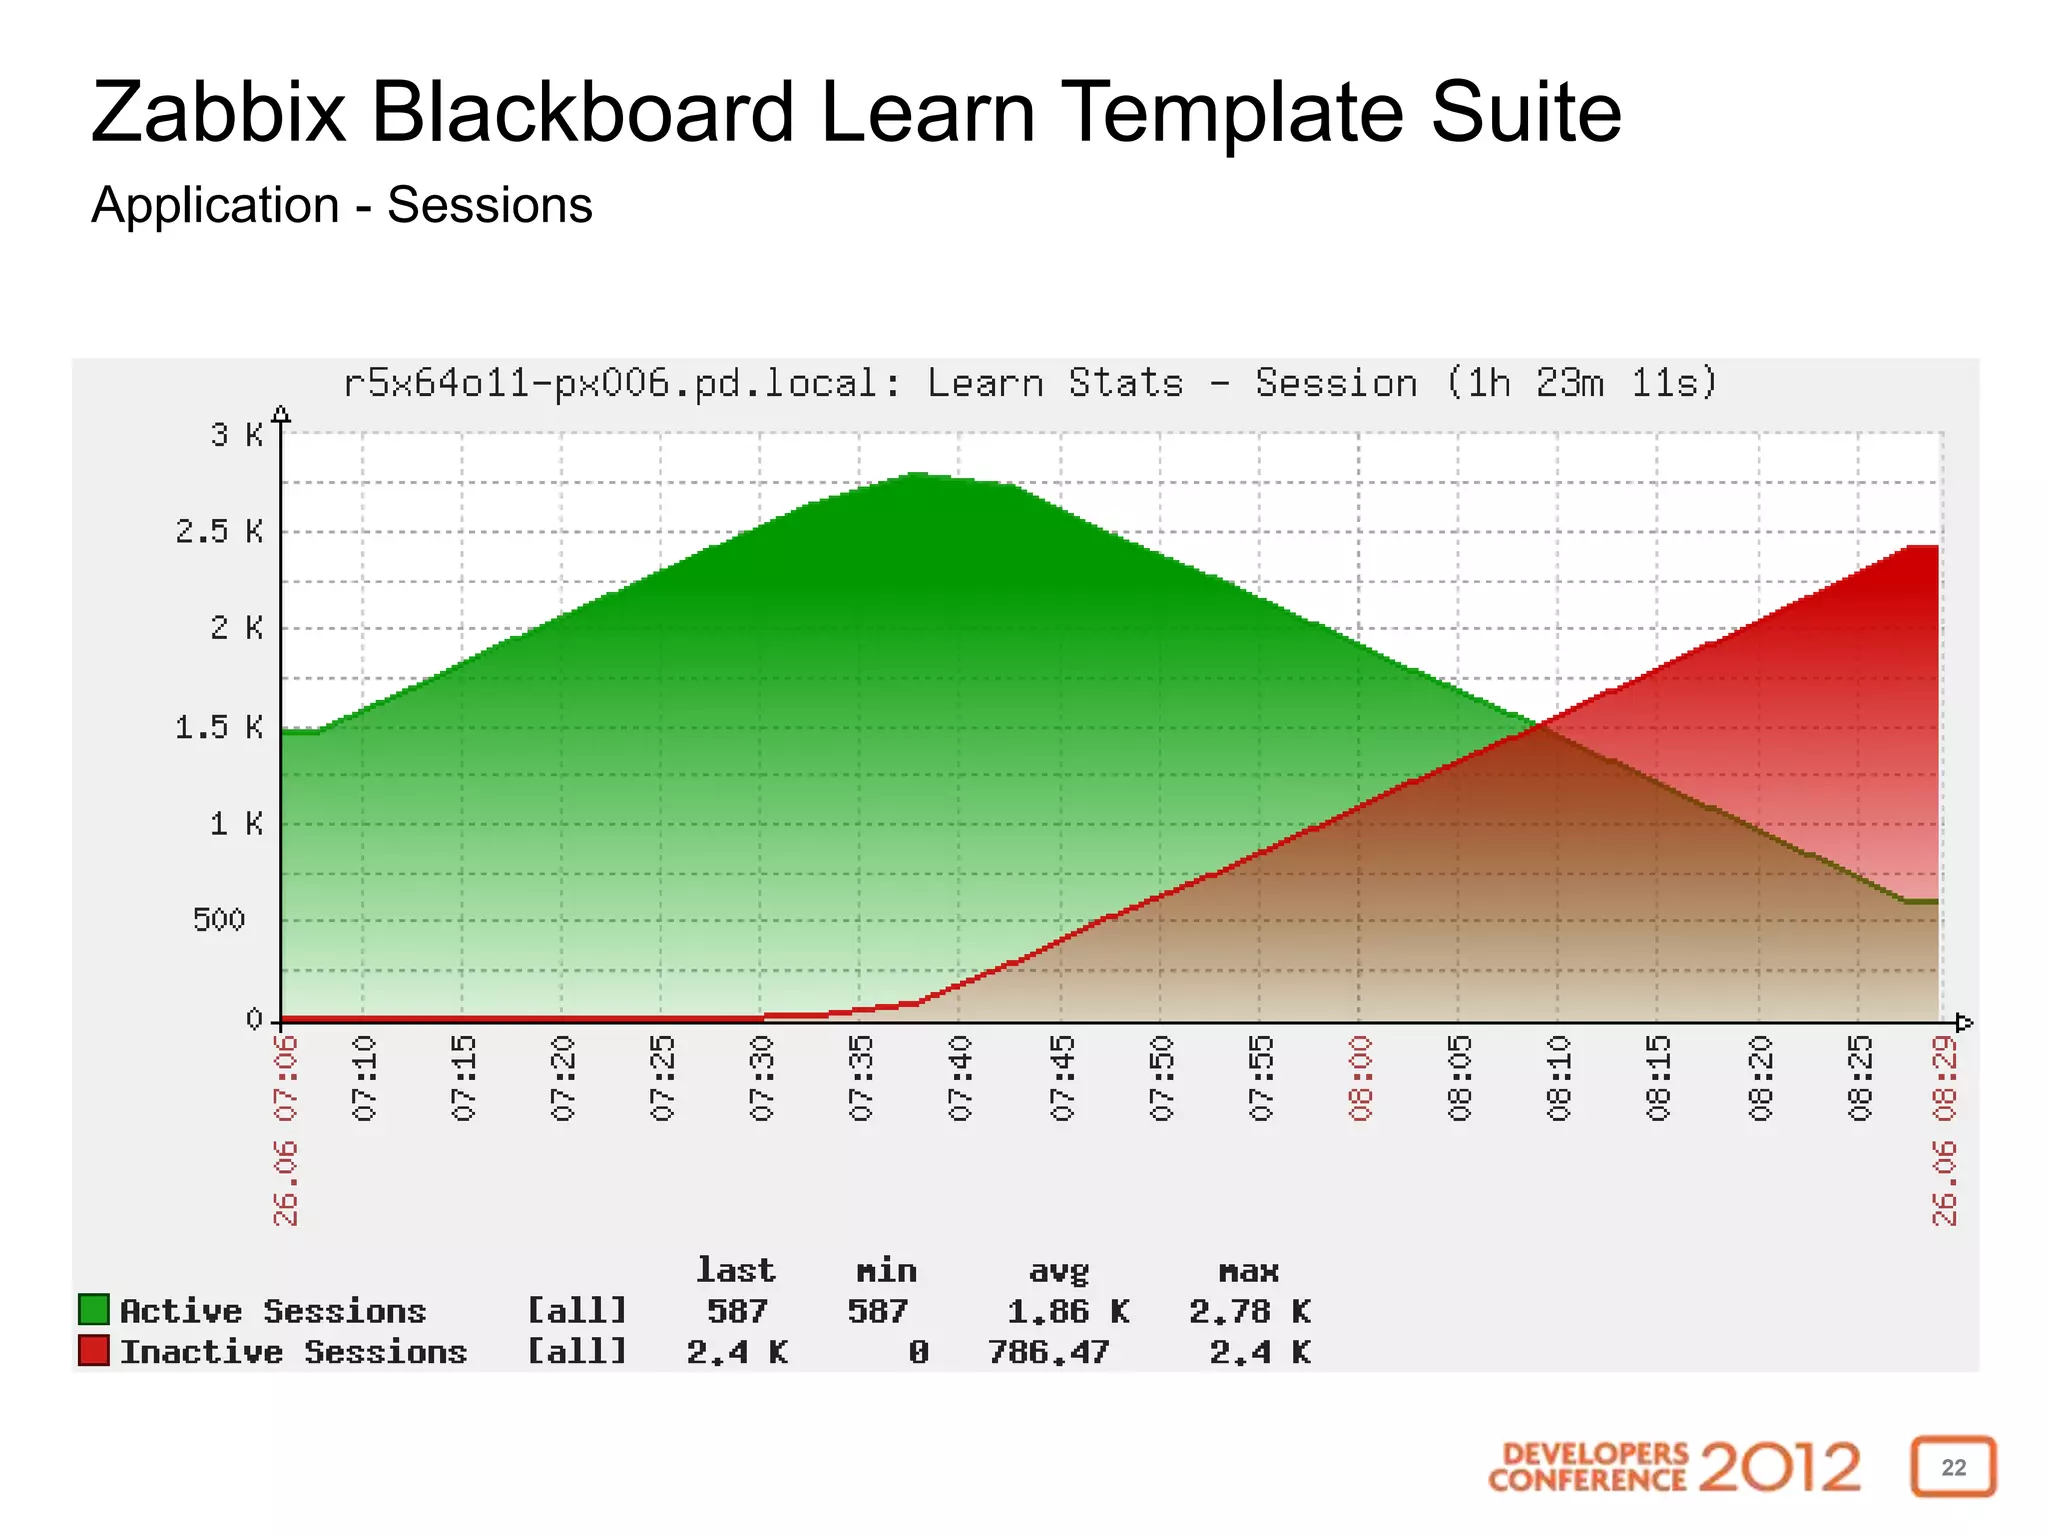
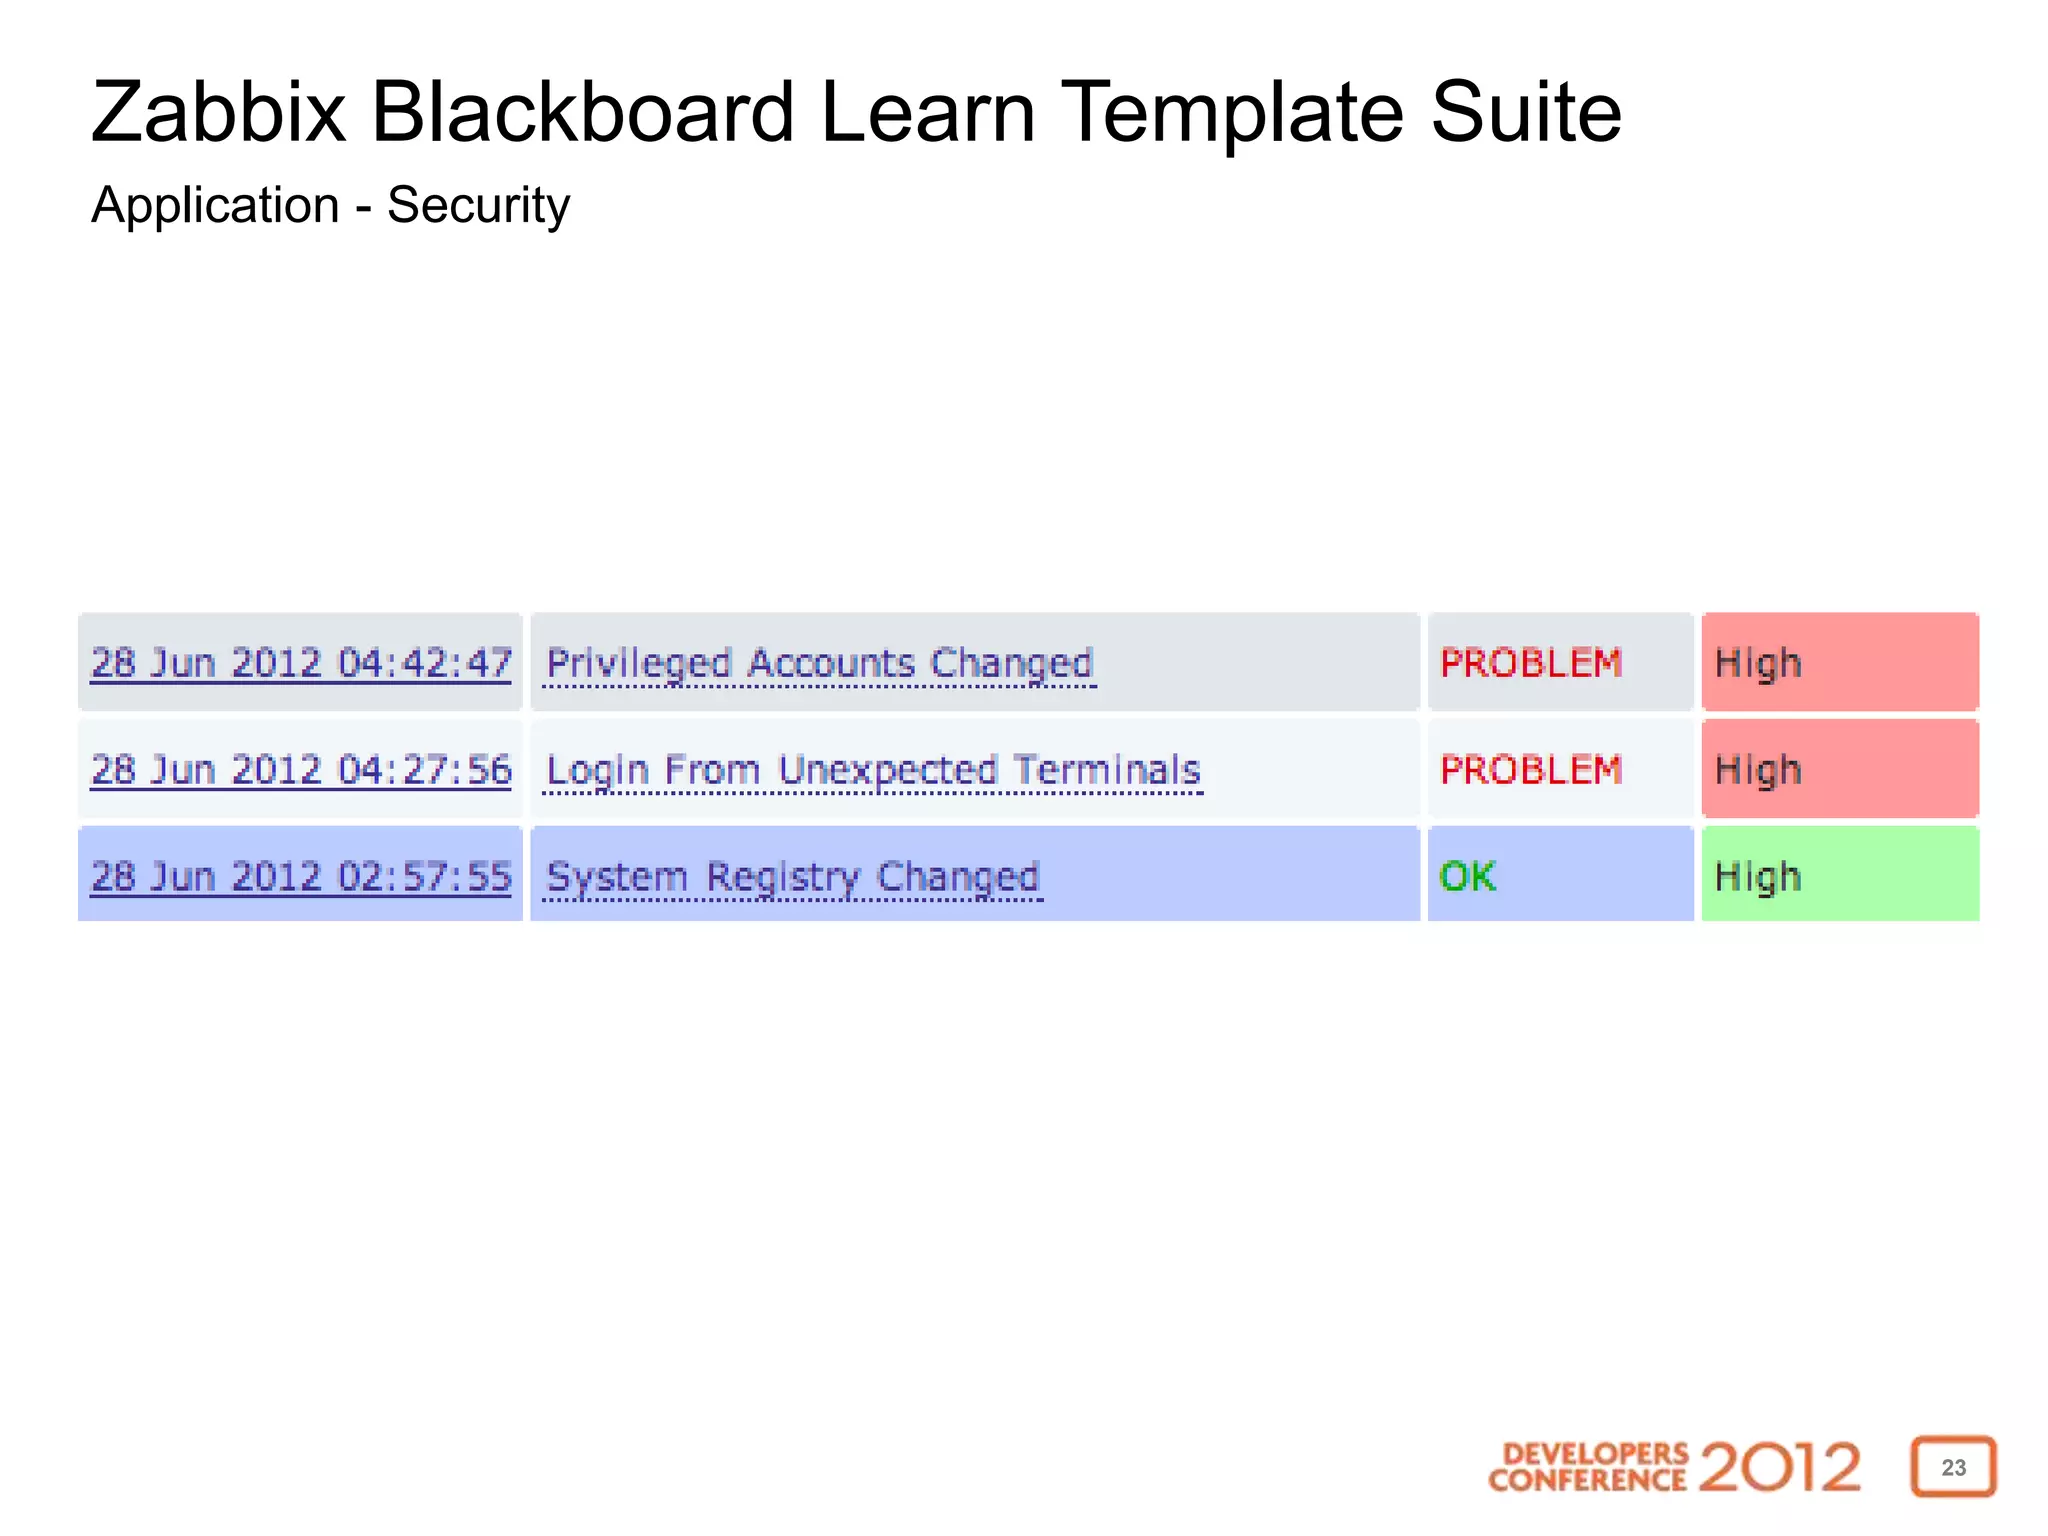
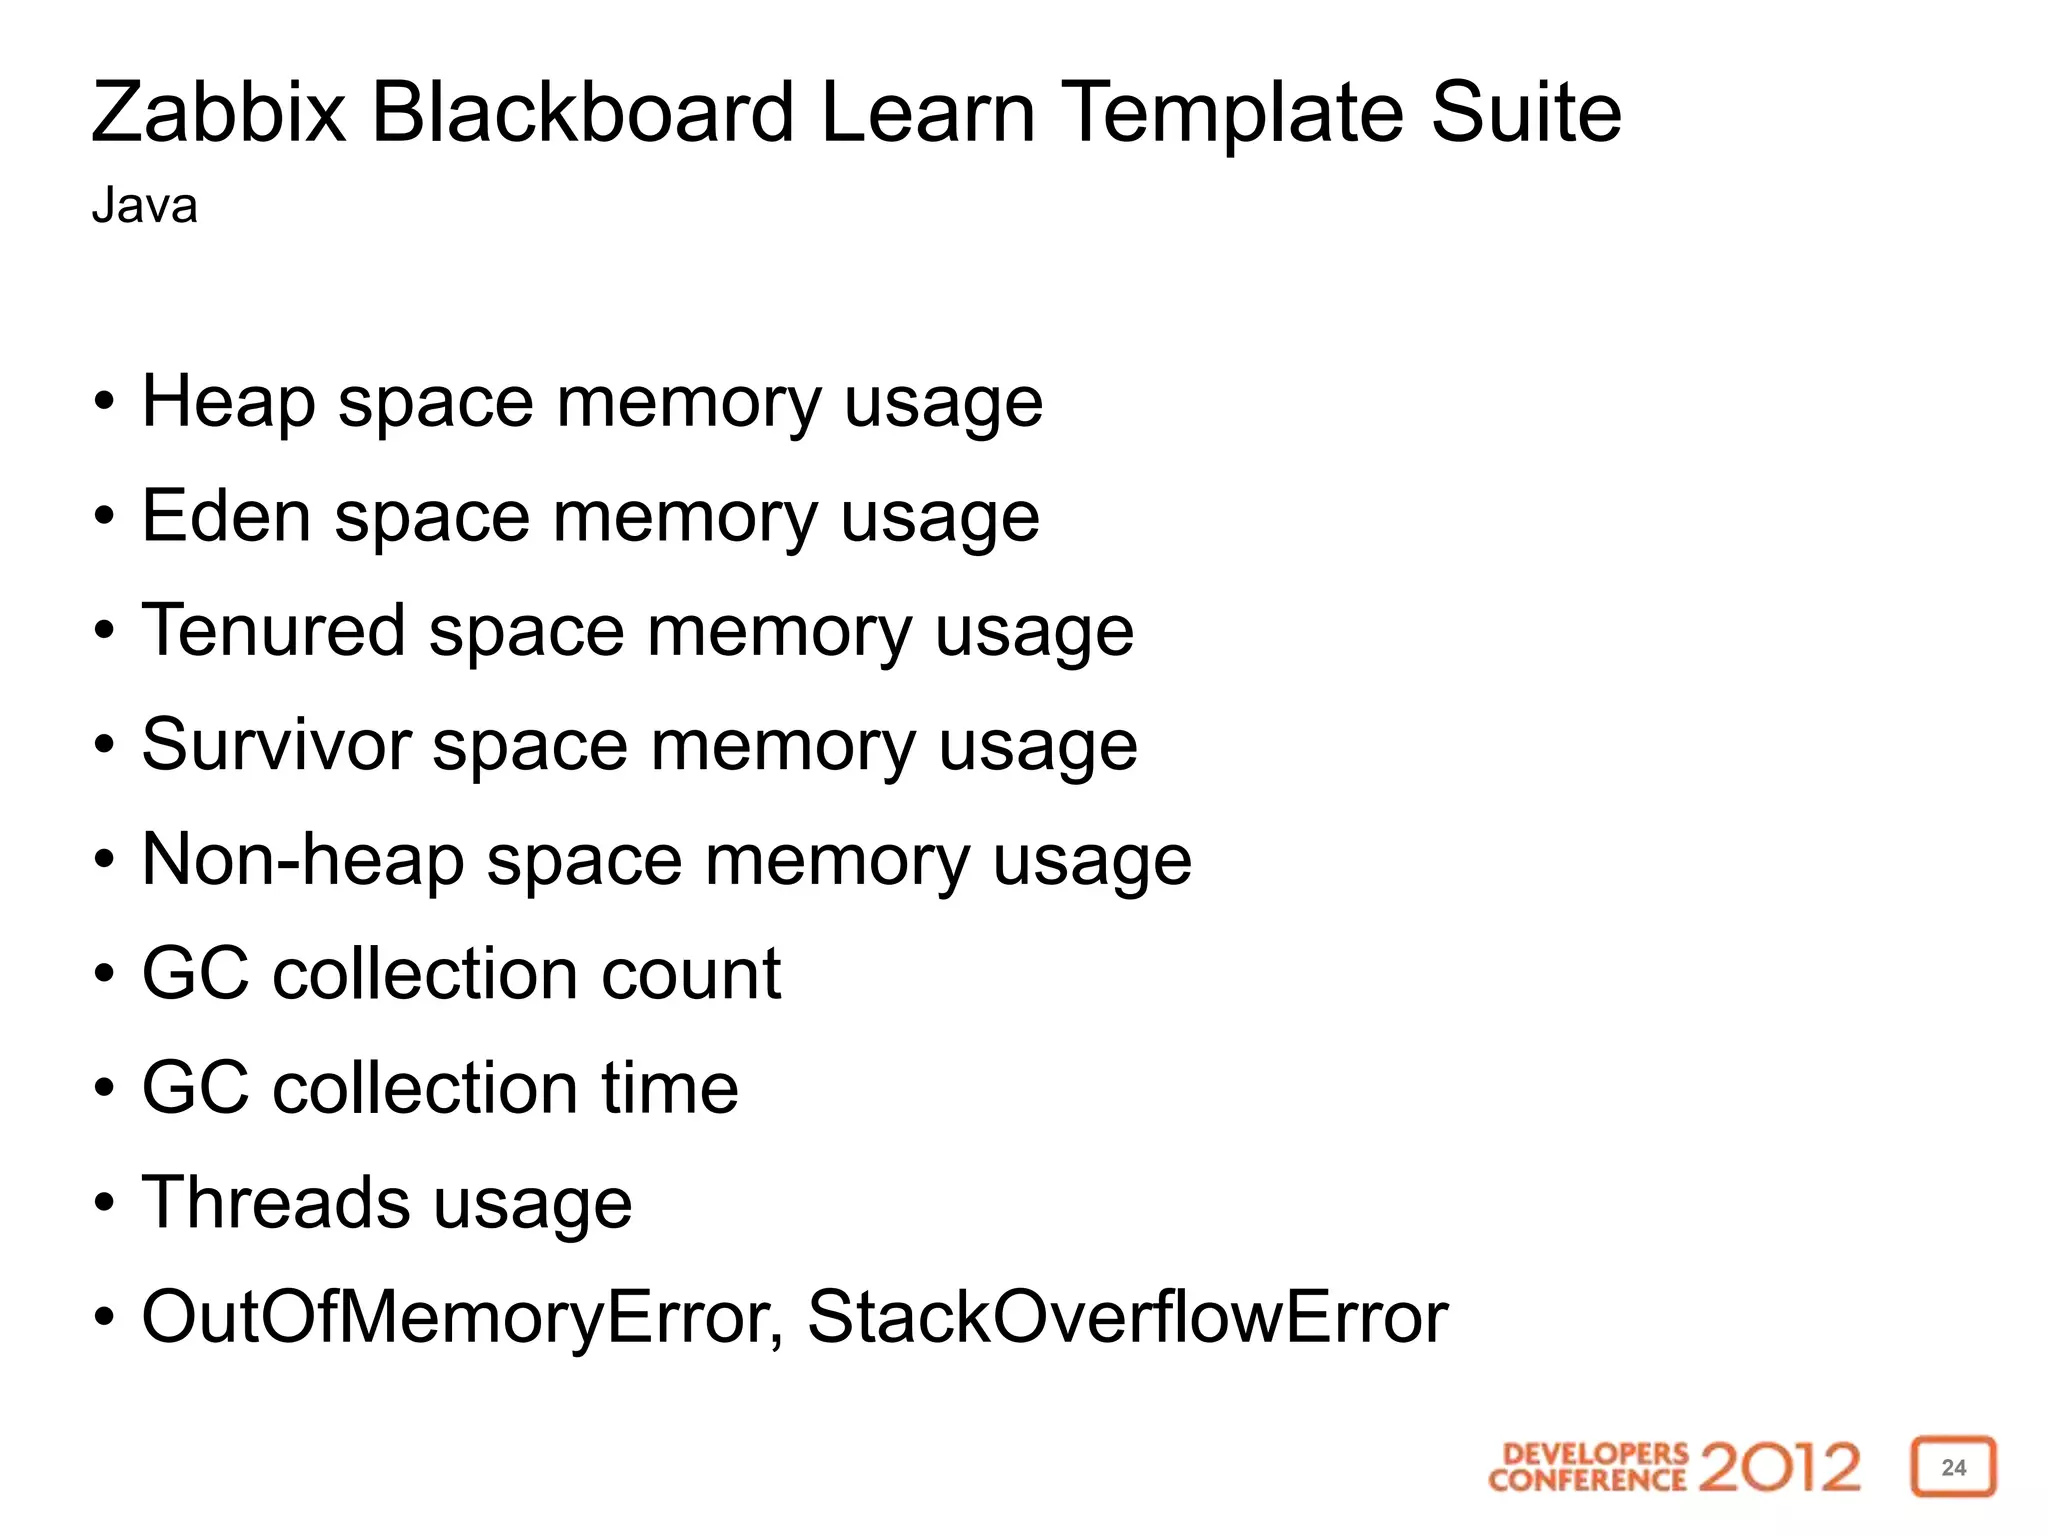
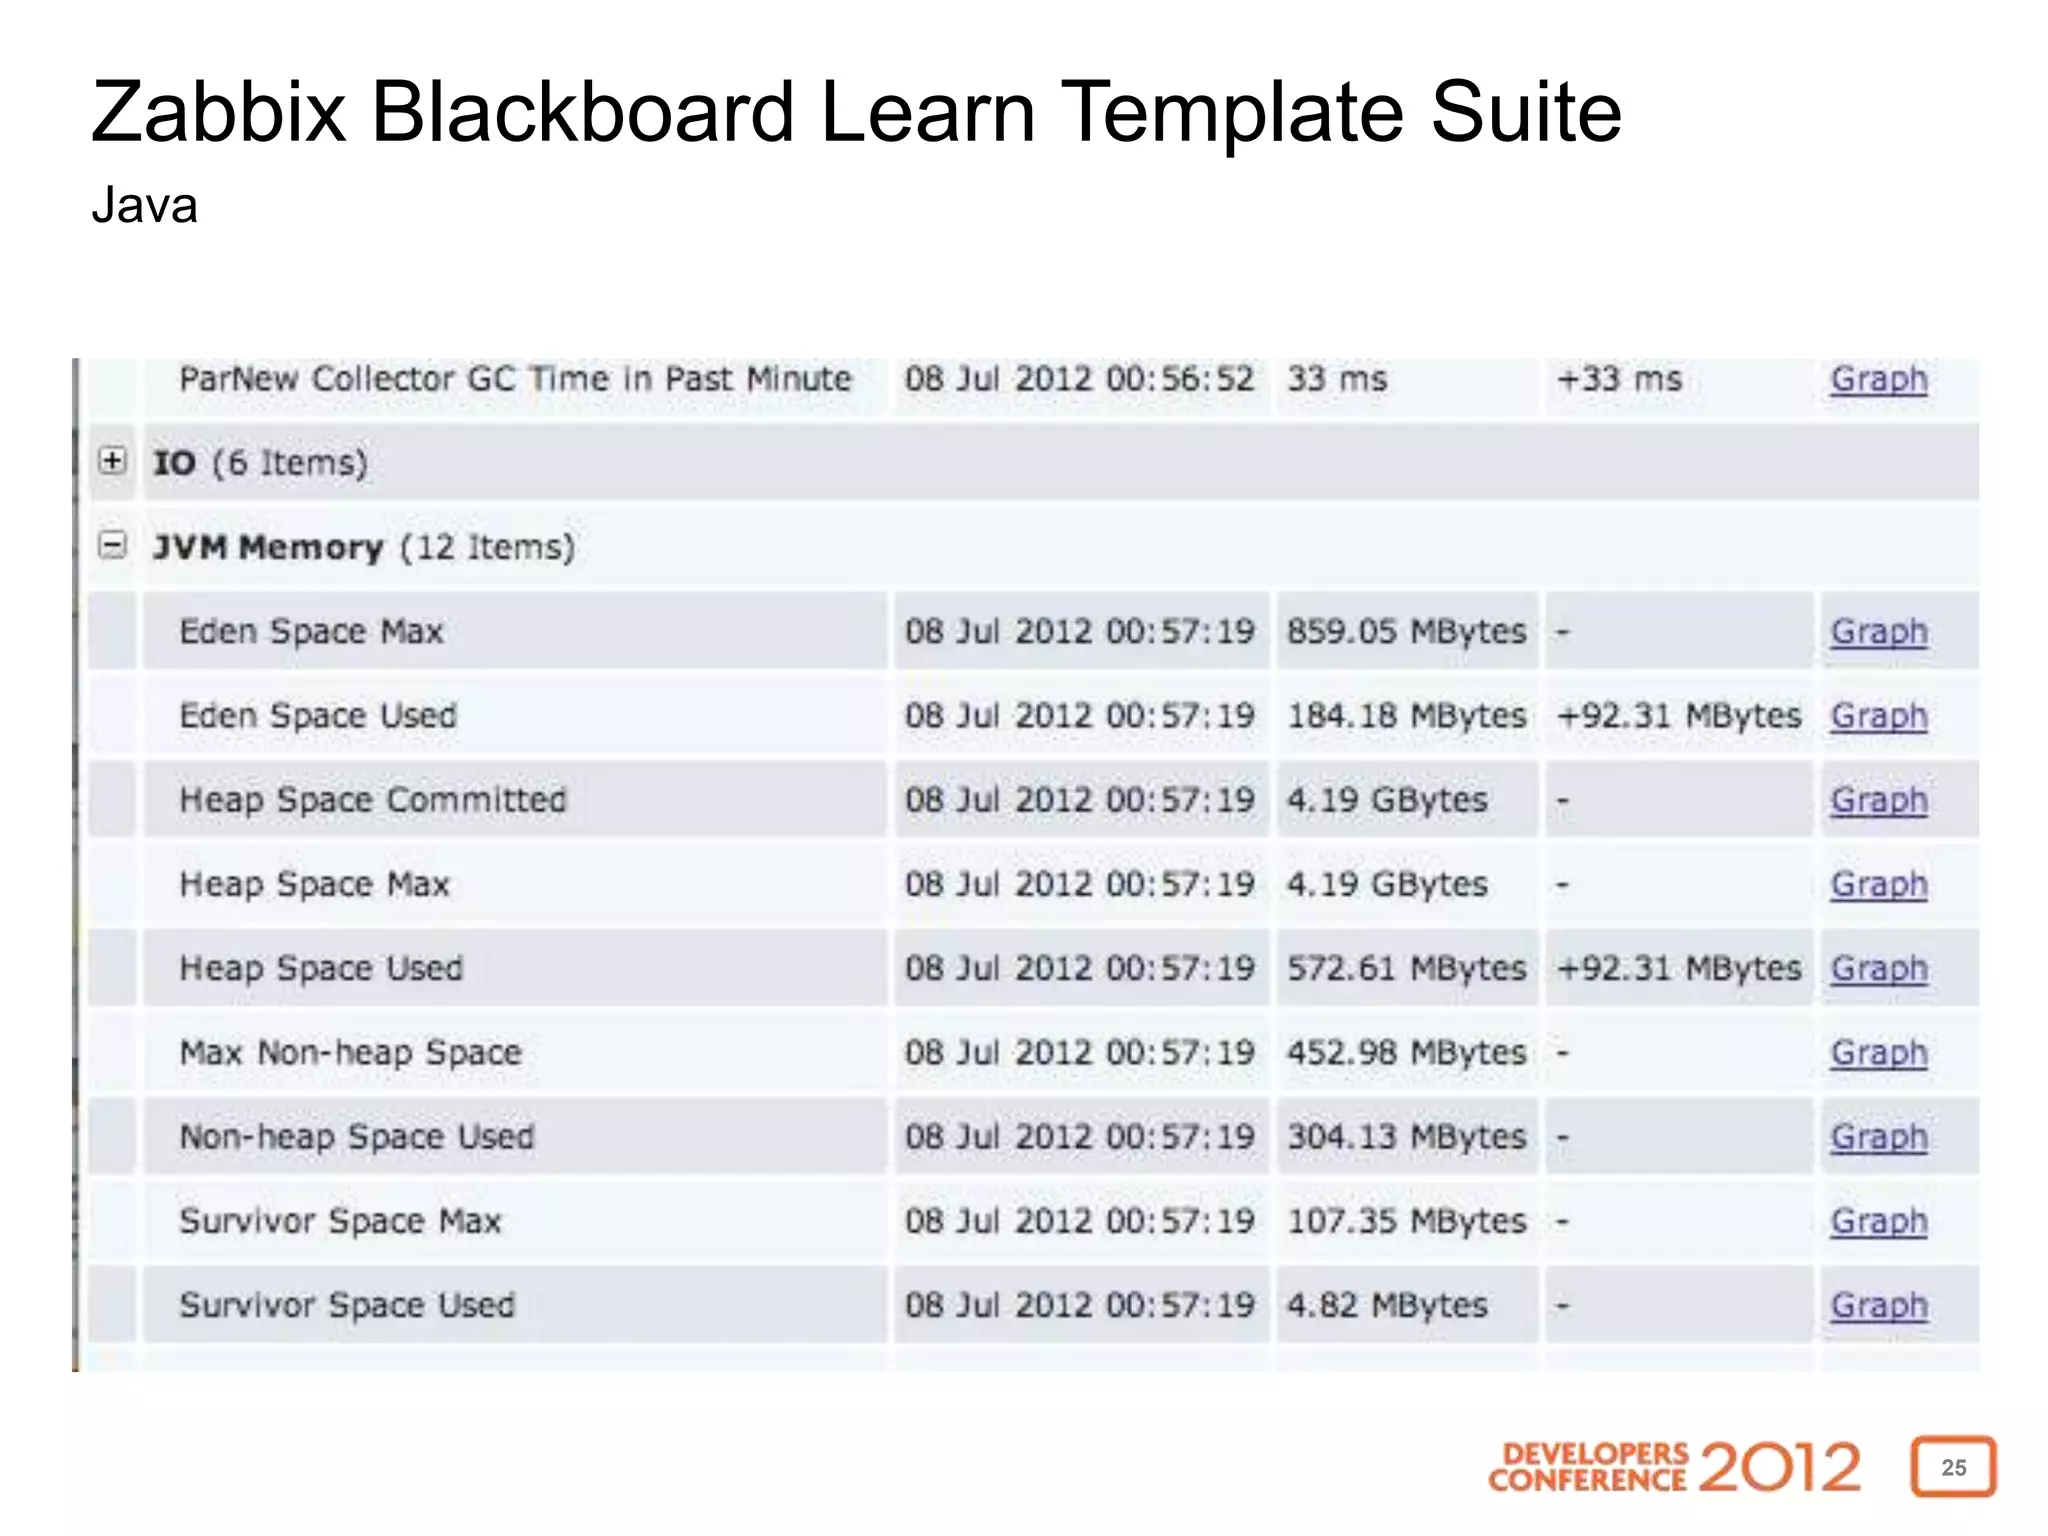
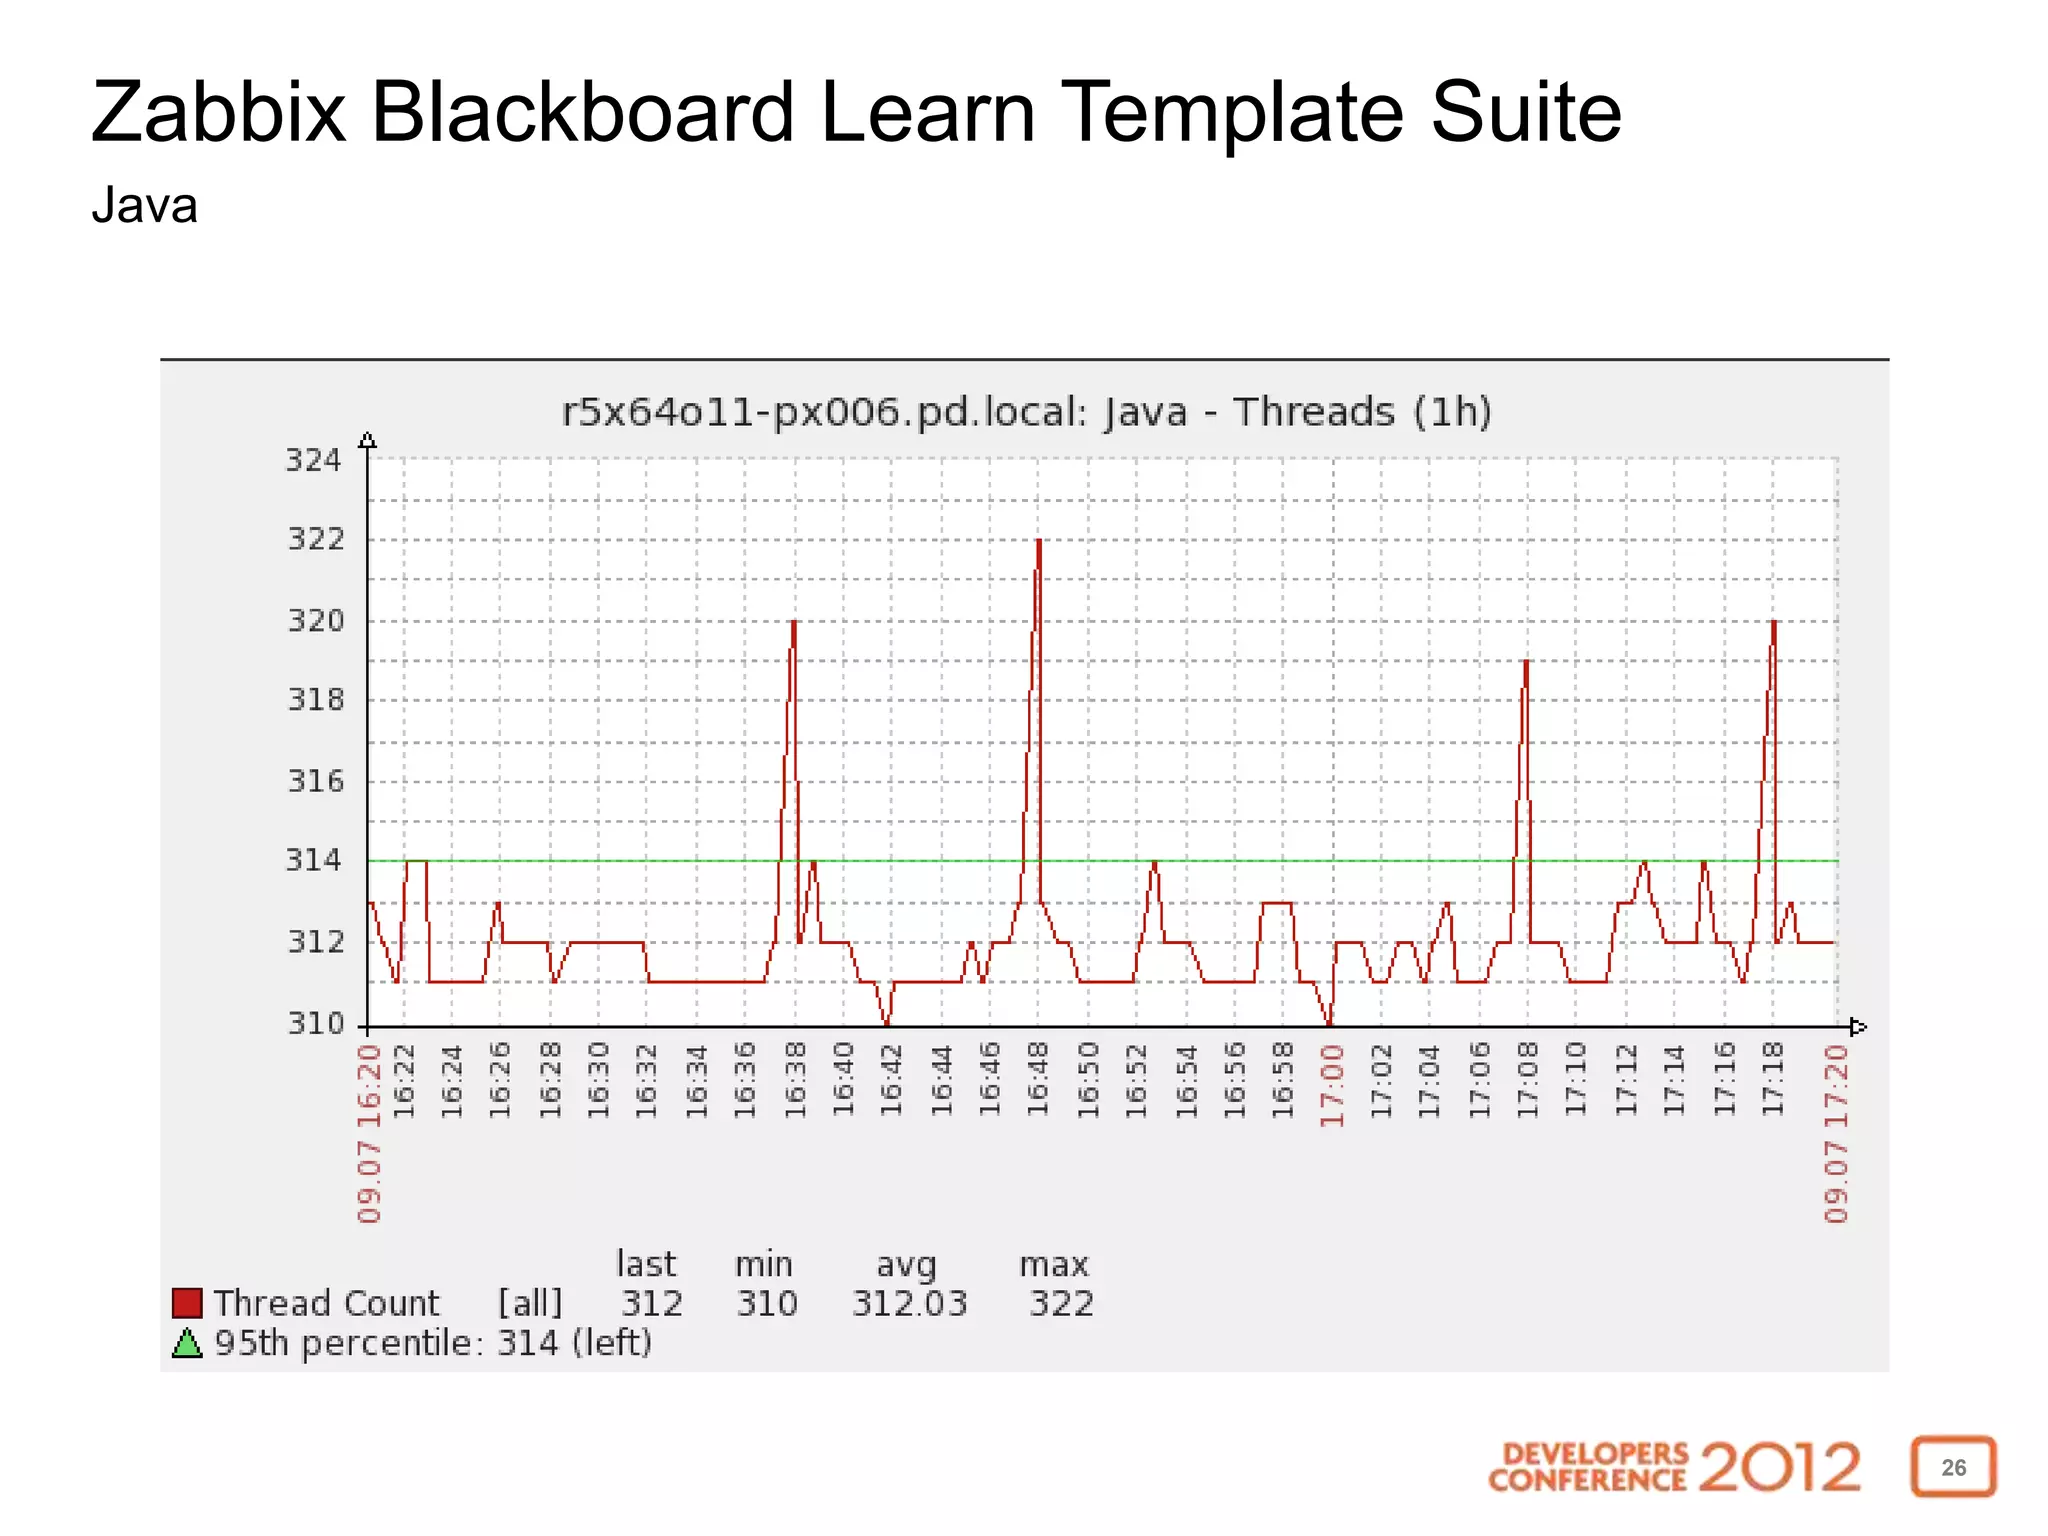
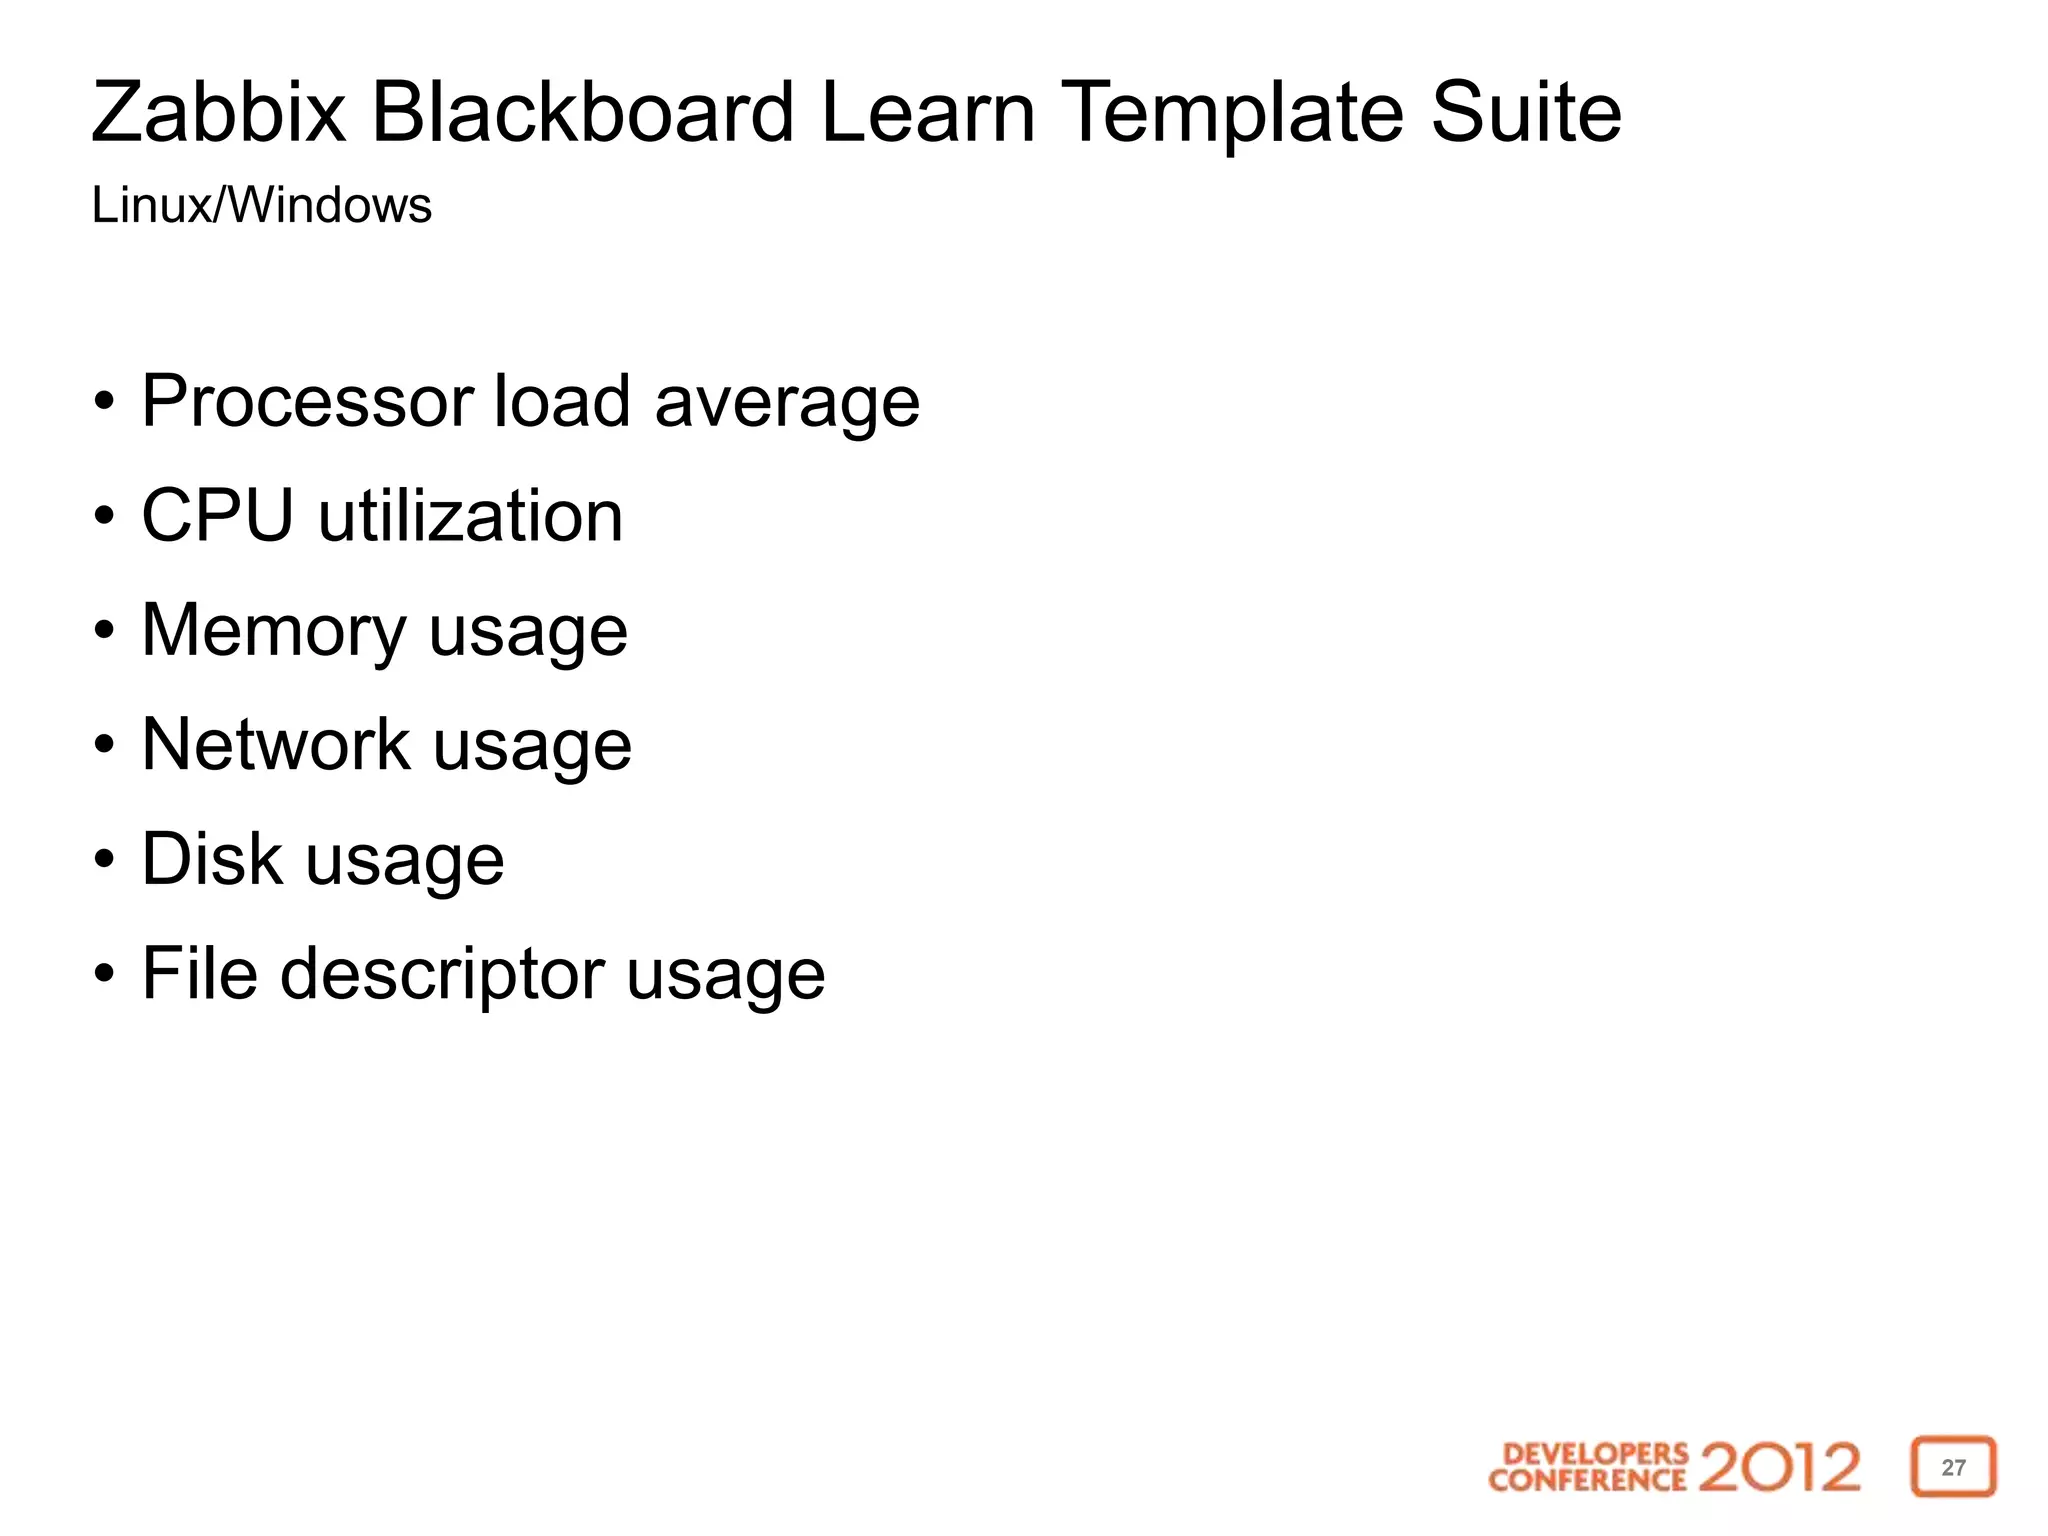
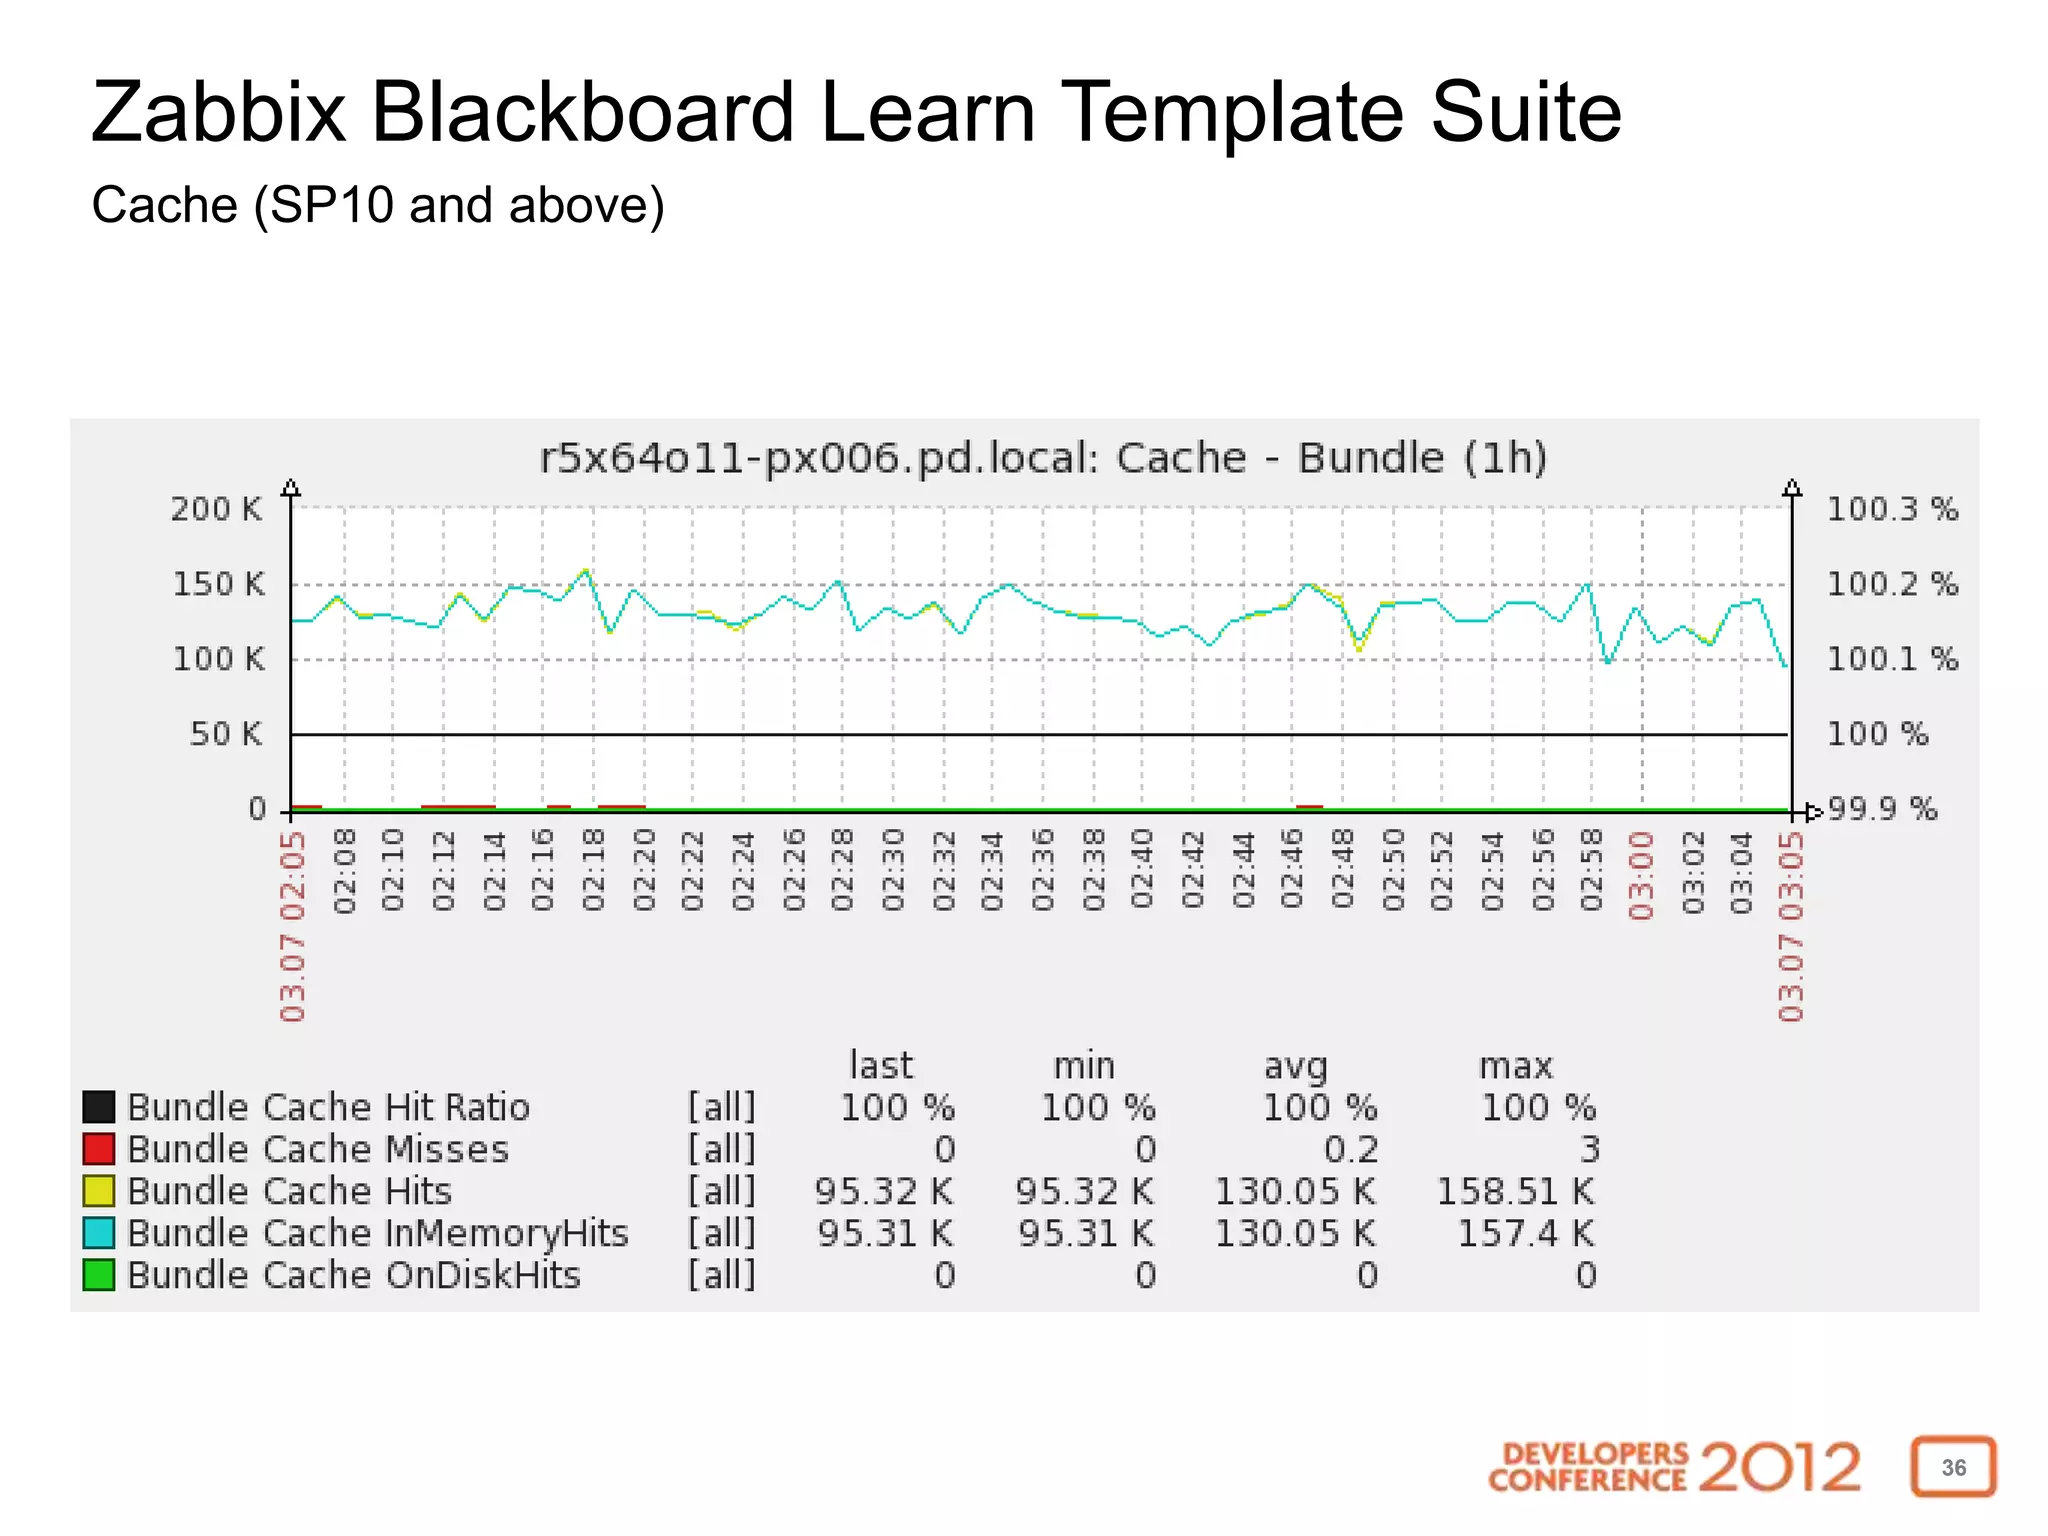
How to Turn the Lights
on Your Blackboard
Learn with Zabbix
Noriaki Tatsumi
Manager, Performance Engineering
Blackboard, Inc.
What’s Zabbix?
http://www.zabbix.com/


• Distributed monitoring solution
• GNU General Public License (GPL) version 2
• Alerts, advanced monitoring, trend analysis, data
  visualization, actions, RC, JSON API
• Stores data away from production
  • MySQL
  • PostgreSQL
  • SQLite
  • Oracle / IBM DB2


                                                      2
What can Zabbix do for you?


                              3
Cannot replace J.A.R.V.I.S. for Ironman


                                          4
Collect service quality metrics


• Uptime
• Response time
• Failure rate


                                  5
Notify you when there’s an issue


• Be the first to know about down time
• Identify problems before the users report
• Get alerted for potential security attack


                                              6
Troubleshoot your environment


• Reduce/eliminate guess work during root cause
  analysis
• Minimize time to identify problem
• Measure improvement after introducing a fix


                                                  7
Plan sysadmin tasks


• Identify optimal maintenance window
• Hardware projection


                                        8
Measure success


• Institution goals (ex. user adoption)
• Brags


                                          9
Explore data


• Monitor anything!


                      10
Why Zabbix and not another monitor like Nagios?


• Requires smaller effort to setup
• Better UI monitoring and graphing capabilities
• Template based
• Built-in capability to monitor JMX, log files, Unix,
  Windows, SNMP, database, URL, and IPMI
• Easily extensible via agents, plugins, and APIs
• Other cool features like maps, screens, slide shows


                                                         11
Zabbix Custom Graph


                      12
Zabbix Custom Graph


                      13
Zabbix Custom Screens


                        14
Zabbix Status of Triggers


                            15
Zabbix Custom Dashboard


                          16
Zabbix Network Maps


                      17
How does Blackboard use Zabbix?


• Monitoring and trending operations and statistical data
  for SaaS solutions like SafeAssign
• Performance and scalability forensics
• Internal server infrastructure monitoring


                                                            18
Zabbix Blackboard Learn Template Suite


• Easy to install
• Requirements
 • Zabbix 2.0 and up
 • Zabbix Java Gateway
 • Extended Monitoring B2
• Available for download on edugarage
  http://tinyurl.com/bbzabbix


                                         19
Zabbix Blackboard Learn Template Suite


• Application
• Java
• Linux / Windows
• Tomcat
• Cache
• ActiveMQ


                                         20
Zabbix Blackboard Learn Template Suite
Application


• Statistics
  • Sessions (active, inactive)
  • Users &Courses (available, unavailable)
  • Assessment attempts / hour
  • Database connection pool usage
• Security
  • Config changes in conf/ folder & system registry database table
  • Creation of privileged accounts, Logins from unexpected terminal
  • Command-line authentication tool usage


                                                                       21
Zabbix Blackboard Learn Template Suite
Application - Sessions


                                         22
Zabbix Blackboard Learn Template Suite
Application - Security


                                         23
Zabbix Blackboard Learn Template Suite
Java


• Heap space memory usage
• Eden space memory usage
• Tenured space memory usage
• Survivor space memory usage
• Non-heap space memory usage
• GC collection count
• GC collection time
• Threads usage
• OutOfMemoryError, StackOverflowError
                                         24
Zabbix Blackboard Learn Template Suite
Java


                                         25
Zabbix Blackboard Learn Template Suite
Java


                                         26
Zabbix Blackboard Learn Template Suite
Linux/Windows


• Processor load average
• CPU utilization
• Memory usage
• Network usage
• Disk usage
• File descriptor usage


                                         27
Zabbix Blackboard Learn Template Suite
Linux – Processor Load Average


                                         28
Zabbix Blackboard Learn Template Suite
Linux – CPU Utilization


                                         29
Zabbix Blackboard Learn Template Suite
Linux – Disk IO


                                         30
Zabbix Blackboard Learn Template Suite
Linux – Memory


                                         31
Zabbix Blackboard Learn Template Suite
Tomcat


• Request processor
  • Average processing time
  • Requests per minute
  • Errors per minute
• Thread pool
  • Busy
  • Current
  • Max


                                         32
Zabbix Blackboard Learn Template Suite
Tomcat


                                         33
Zabbix Blackboard Learn Template Suite
Tomcat


                                         34
Zabbix Blackboard Learn Template Suite
Cache (SP10 and above)


• Hit ratio
• Misses
• Hits
• In memory hits
• On disk hits


                                         35
Zabbix Blackboard Learn Template Suite
Cache (SP10 and above)


                                         36
Zabbix Blackboard Learn Template Suite
ActiveMQ


• Broker
  • Consumer count
  • Message count
  • Memory usage
  • Enqueue/Dequque count
• Queue
  • Enqueue/Dequeue count
  • Consumer count
  • Producer count


                                         37
Zabbix Blackboard Learn Template Suite
Data sampling and retention


• Sampling interval
  • 30 ~ 3600 (1 hour)
• History (raw data)
  • 7 days ~ 14 days
• Trend (min, max, avg)
  • Stats: 5 years
  • Others: 3 months


                                         38
Zabbix Blackboard Learn Template Suite
Deployment


1. Download at http://tinyurl.com/bbzabbix
2. Install Monitoring Extension B2 for statistics and
   security data
3. Upload the templates via Zabbix GUI
4. Deploy agents using the provided script
5. Add hosts and apply the templates in Zabbix via GUI


                                                         39
Zabbix server deployment options


• Compile from source
• VMware / VirtualBox (.vmdk)
• Open virtualization format (.ovf)
• Live CD/DVD (.iso)
• Preload ISO
• USB stick / hard disk image
• Xen guest


                                      40
Zabbix Best Practices


• Define an objective for each item you’re monitoring
• Don’t sample data more than required
• Don’t keep history and trend data longer than
  necessary
• Use percentile line on charts where applicable
• Graph all functions (min, avg, max) to indicate outliers
• Don't create triggers that gets ignored
• Self monitor Zabbix server
• Have a maintenance and a backup/restore plan

                                                             41
Check out Zabbix!


• http://www.zabbix.com
• http://tinyurl.com/bbzabbix


                                42

Blackboard DevCon 2012 - How to Turn on the Lights to Your Blackboard Learn Environment with Zabbix

  • 1.
    How to Turnthe Lights on Your Blackboard Learn with Zabbix Noriaki Tatsumi Manager, Performance Engineering Blackboard, Inc.
  • 2.
    What’s Zabbix? http://www.zabbix.com/ • Distributedmonitoring solution • GNU General Public License (GPL) version 2 • Alerts, advanced monitoring, trend analysis, data visualization, actions, RC, JSON API • Stores data away from production • MySQL • PostgreSQL • SQLite • Oracle / IBM DB2 2
  • 3.
    What can Zabbixdo for you? 3
  • 4.
  • 5.
    Collect service qualitymetrics • Uptime • Response time • Failure rate 5
  • 6.
    Notify you whenthere’s an issue • Be the first to know about down time • Identify problems before the users report • Get alerted for potential security attack 6
  • 7.
    Troubleshoot your environment •Reduce/eliminate guess work during root cause analysis • Minimize time to identify problem • Measure improvement after introducing a fix 7
  • 8.
    Plan sysadmin tasks •Identify optimal maintenance window • Hardware projection 8
  • 9.
    Measure success • Institutiongoals (ex. user adoption) • Brags 9
  • 10.
  • 11.
    Why Zabbix andnot another monitor like Nagios? • Requires smaller effort to setup • Better UI monitoring and graphing capabilities • Template based • Built-in capability to monitor JMX, log files, Unix, Windows, SNMP, database, URL, and IPMI • Easily extensible via agents, plugins, and APIs • Other cool features like maps, screens, slide shows 11
  • 12.
  • 13.
  • 14.
  • 15.
    Zabbix Status ofTriggers 15
  • 16.
  • 17.
  • 18.
    How does Blackboarduse Zabbix? • Monitoring and trending operations and statistical data for SaaS solutions like SafeAssign • Performance and scalability forensics • Internal server infrastructure monitoring 18
  • 19.
    Zabbix Blackboard LearnTemplate Suite • Easy to install • Requirements • Zabbix 2.0 and up • Zabbix Java Gateway • Extended Monitoring B2 • Available for download on edugarage http://tinyurl.com/bbzabbix 19
  • 20.
    Zabbix Blackboard LearnTemplate Suite • Application • Java • Linux / Windows • Tomcat • Cache • ActiveMQ 20
  • 21.
    Zabbix Blackboard LearnTemplate Suite Application • Statistics • Sessions (active, inactive) • Users &Courses (available, unavailable) • Assessment attempts / hour • Database connection pool usage • Security • Config changes in conf/ folder & system registry database table • Creation of privileged accounts, Logins from unexpected terminal • Command-line authentication tool usage 21
  • 22.
    Zabbix Blackboard LearnTemplate Suite Application - Sessions 22
  • 23.
    Zabbix Blackboard LearnTemplate Suite Application - Security 23
  • 24.
    Zabbix Blackboard LearnTemplate Suite Java • Heap space memory usage • Eden space memory usage • Tenured space memory usage • Survivor space memory usage • Non-heap space memory usage • GC collection count • GC collection time • Threads usage • OutOfMemoryError, StackOverflowError 24
  • 25.
    Zabbix Blackboard LearnTemplate Suite Java 25
  • 26.
    Zabbix Blackboard LearnTemplate Suite Java 26
  • 27.
    Zabbix Blackboard LearnTemplate Suite Linux/Windows • Processor load average • CPU utilization • Memory usage • Network usage • Disk usage • File descriptor usage 27
  • 28.
    Zabbix Blackboard LearnTemplate Suite Linux – Processor Load Average 28
  • 29.
    Zabbix Blackboard LearnTemplate Suite Linux – CPU Utilization 29
  • 30.
    Zabbix Blackboard LearnTemplate Suite Linux – Disk IO 30
  • 31.
    Zabbix Blackboard LearnTemplate Suite Linux – Memory 31
  • 32.
    Zabbix Blackboard LearnTemplate Suite Tomcat • Request processor • Average processing time • Requests per minute • Errors per minute • Thread pool • Busy • Current • Max 32
  • 33.
    Zabbix Blackboard LearnTemplate Suite Tomcat 33
  • 34.
    Zabbix Blackboard LearnTemplate Suite Tomcat 34
  • 35.
    Zabbix Blackboard LearnTemplate Suite Cache (SP10 and above) • Hit ratio • Misses • Hits • In memory hits • On disk hits 35
  • 36.
    Zabbix Blackboard LearnTemplate Suite Cache (SP10 and above) 36
  • 37.
    Zabbix Blackboard LearnTemplate Suite ActiveMQ • Broker • Consumer count • Message count • Memory usage • Enqueue/Dequque count • Queue • Enqueue/Dequeue count • Consumer count • Producer count 37
  • 38.
    Zabbix Blackboard LearnTemplate Suite Data sampling and retention • Sampling interval • 30 ~ 3600 (1 hour) • History (raw data) • 7 days ~ 14 days • Trend (min, max, avg) • Stats: 5 years • Others: 3 months 38
  • 39.
    Zabbix Blackboard LearnTemplate Suite Deployment 1. Download at http://tinyurl.com/bbzabbix 2. Install Monitoring Extension B2 for statistics and security data 3. Upload the templates via Zabbix GUI 4. Deploy agents using the provided script 5. Add hosts and apply the templates in Zabbix via GUI 39
  • 40.
    Zabbix server deploymentoptions • Compile from source • VMware / VirtualBox (.vmdk) • Open virtualization format (.ovf) • Live CD/DVD (.iso) • Preload ISO • USB stick / hard disk image • Xen guest 40
  • 41.
    Zabbix Best Practices •Define an objective for each item you’re monitoring • Don’t sample data more than required • Don’t keep history and trend data longer than necessary • Use percentile line on charts where applicable • Graph all functions (min, avg, max) to indicate outliers • Don't create triggers that gets ignored • Self monitor Zabbix server • Have a maintenance and a backup/restore plan 41
  • 42.
    Check out Zabbix! •http://www.zabbix.com • http://tinyurl.com/bbzabbix 42