Downloaded 10 times
![Thank you! 1 st International Conference on Learning Analytics and Knowledge 2011 [email_address] 30/5 – 3/6 www.jtelsummerschool.eu PhD students: 18/3/2011 PhD advisors: 31/3/2011](https://image.slidesharecdn.com/lak2011palavitsinisetal-110629045824-phpapp01/75/Applying-Analytics-for-a-Learning-Portal-LAK-2011-20-2048.jpg)

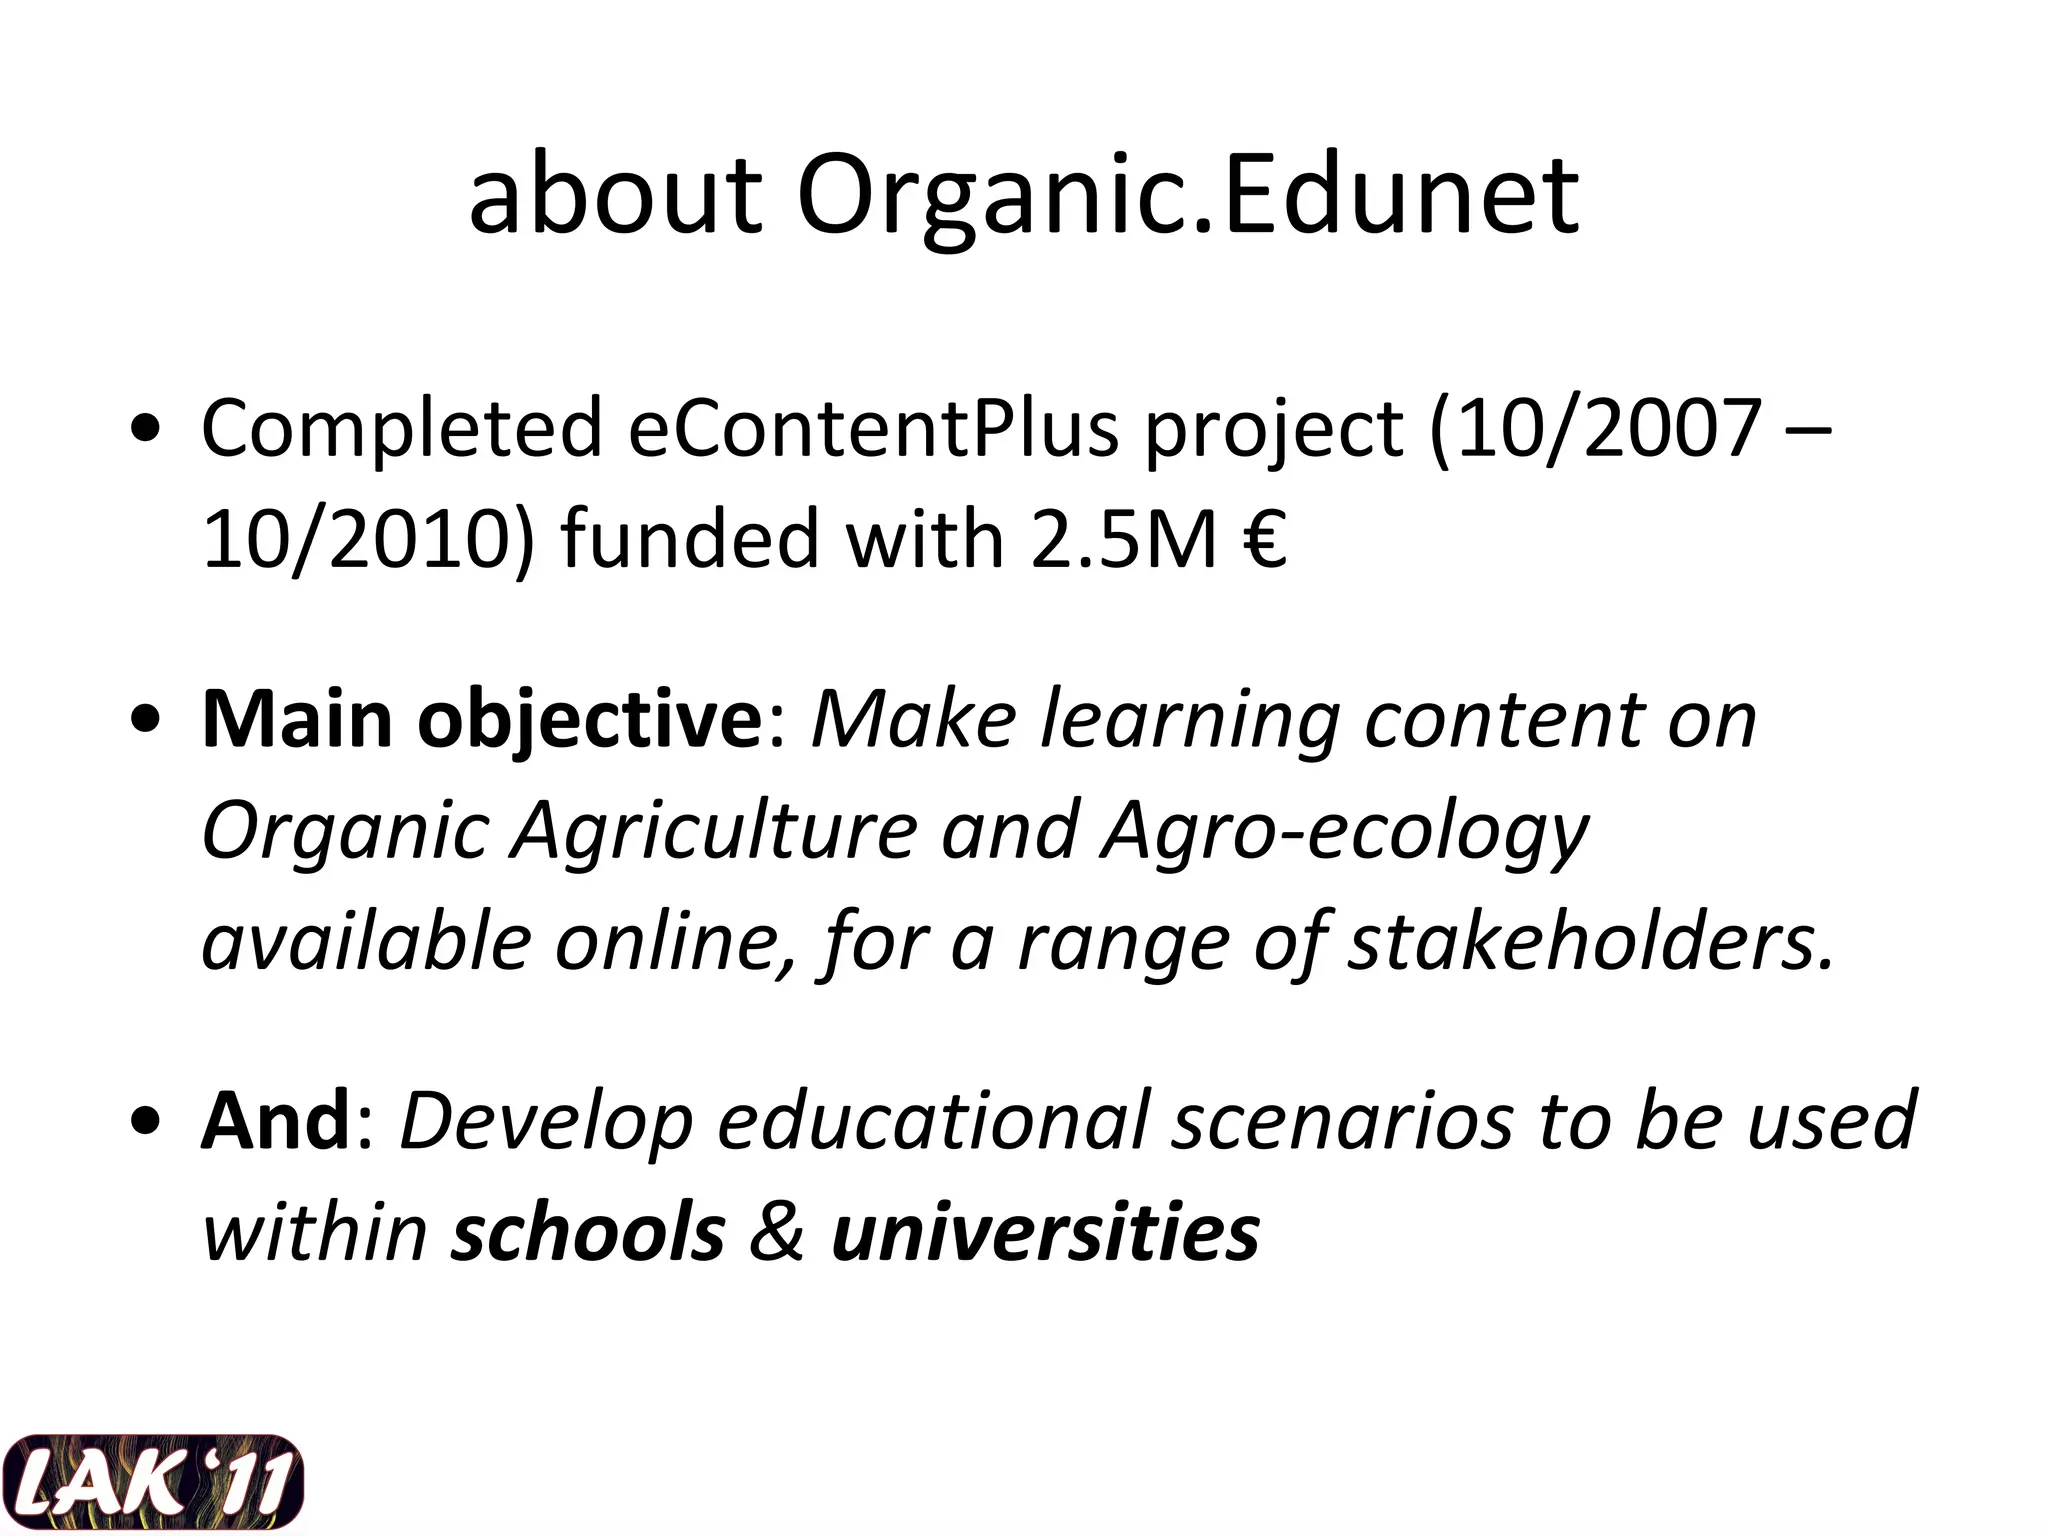
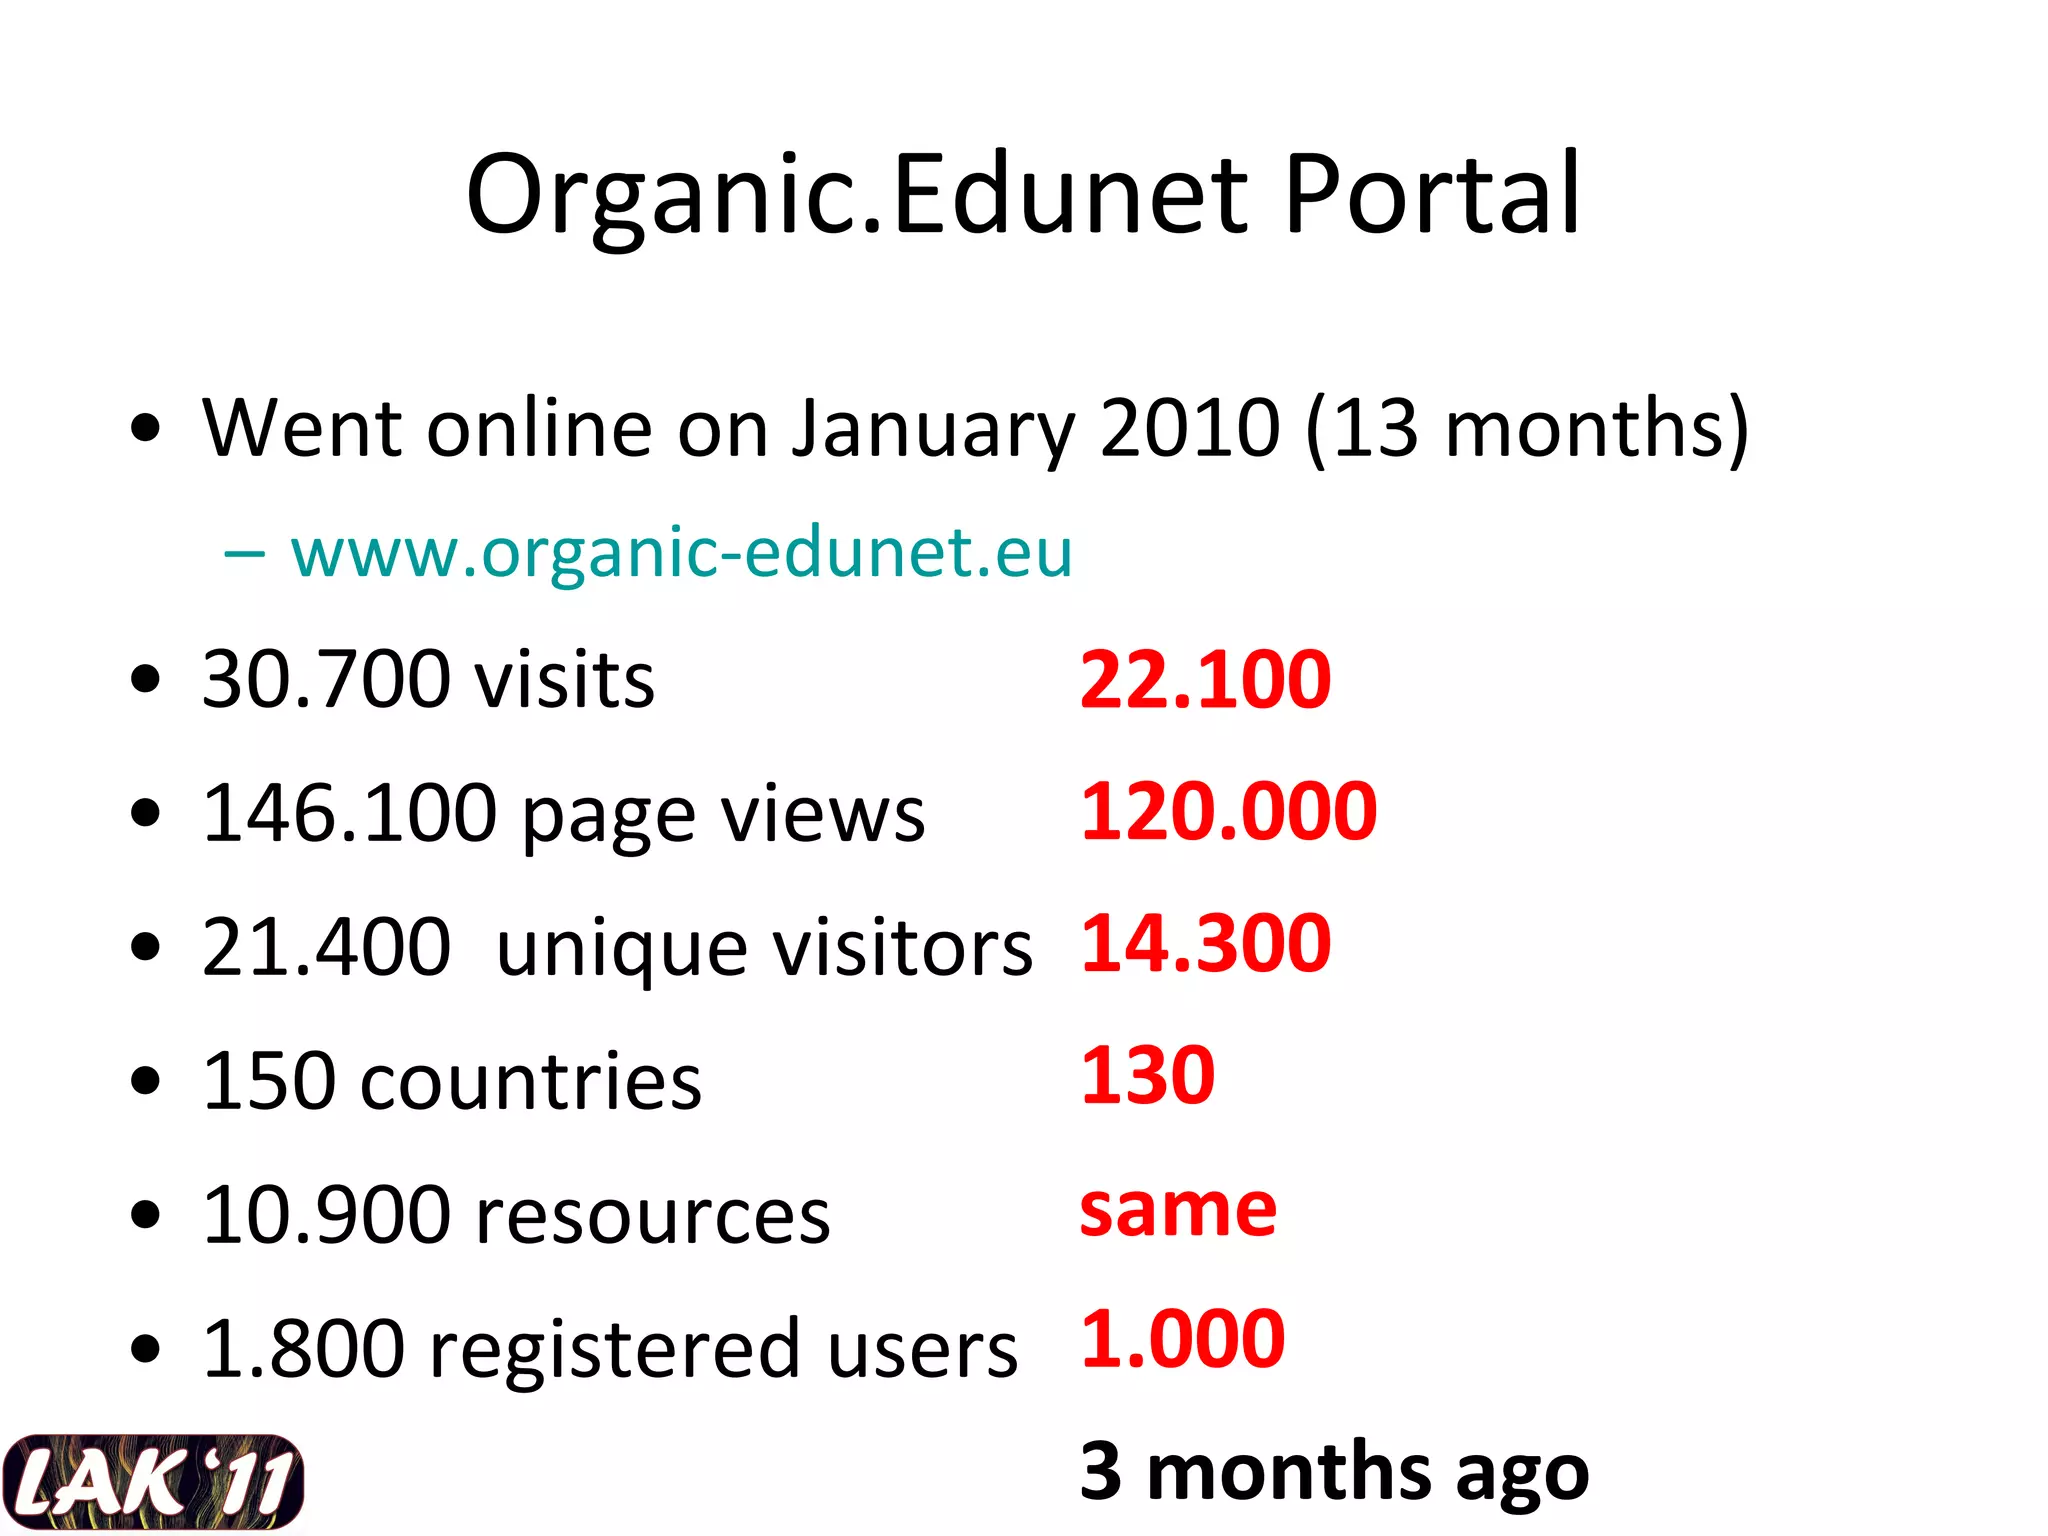
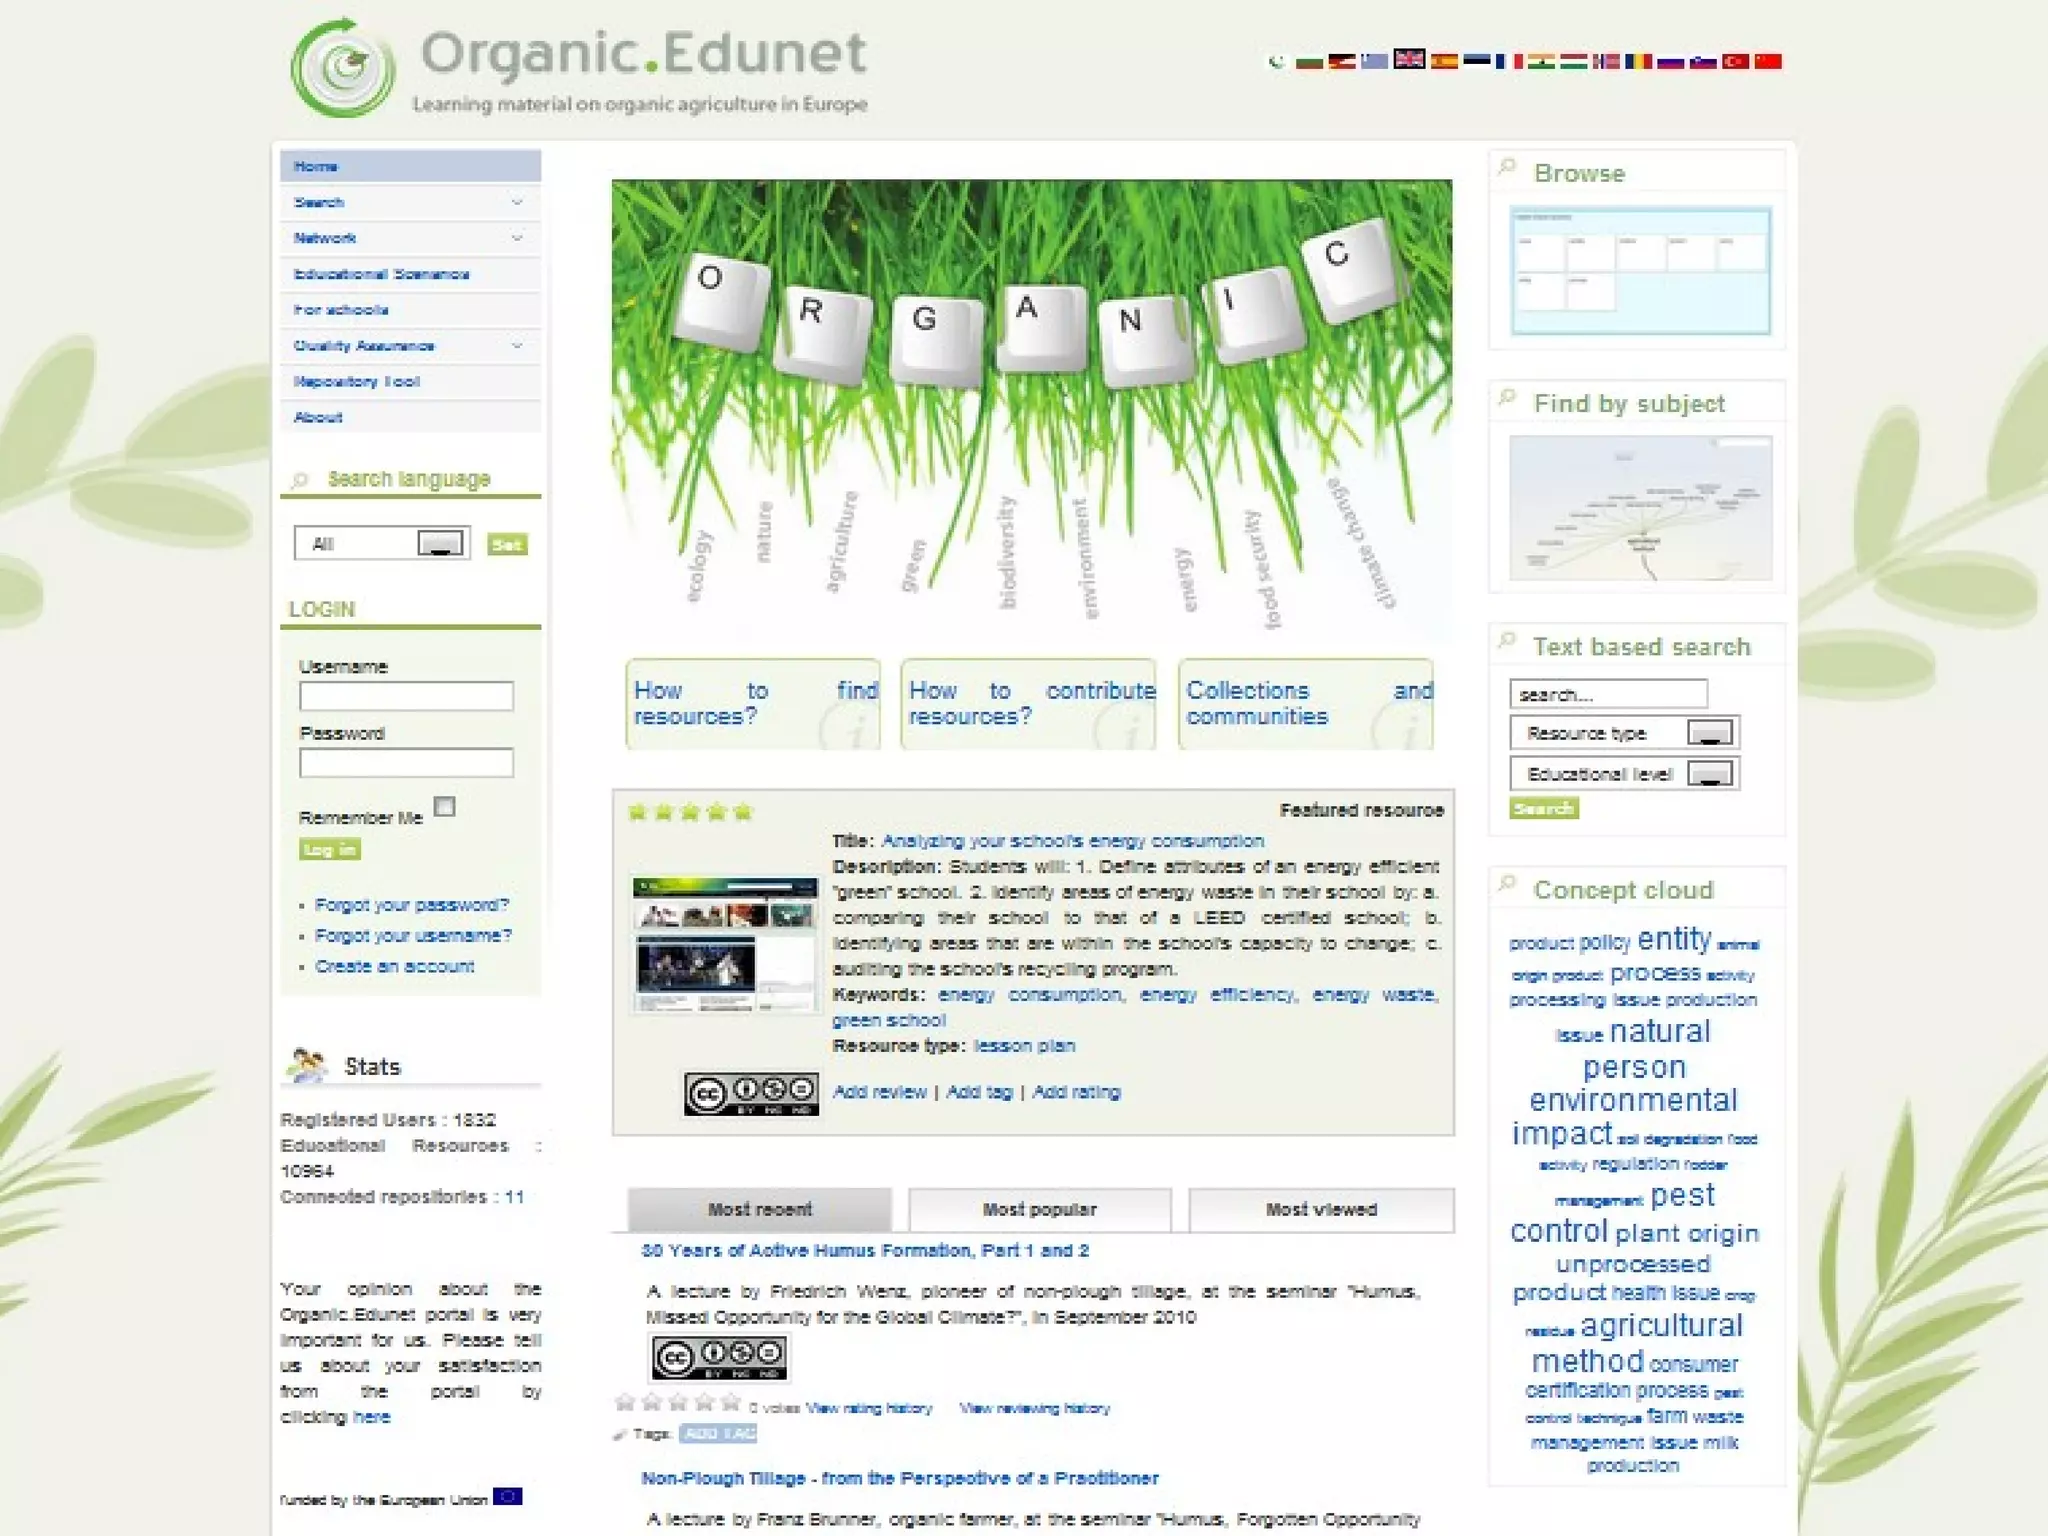
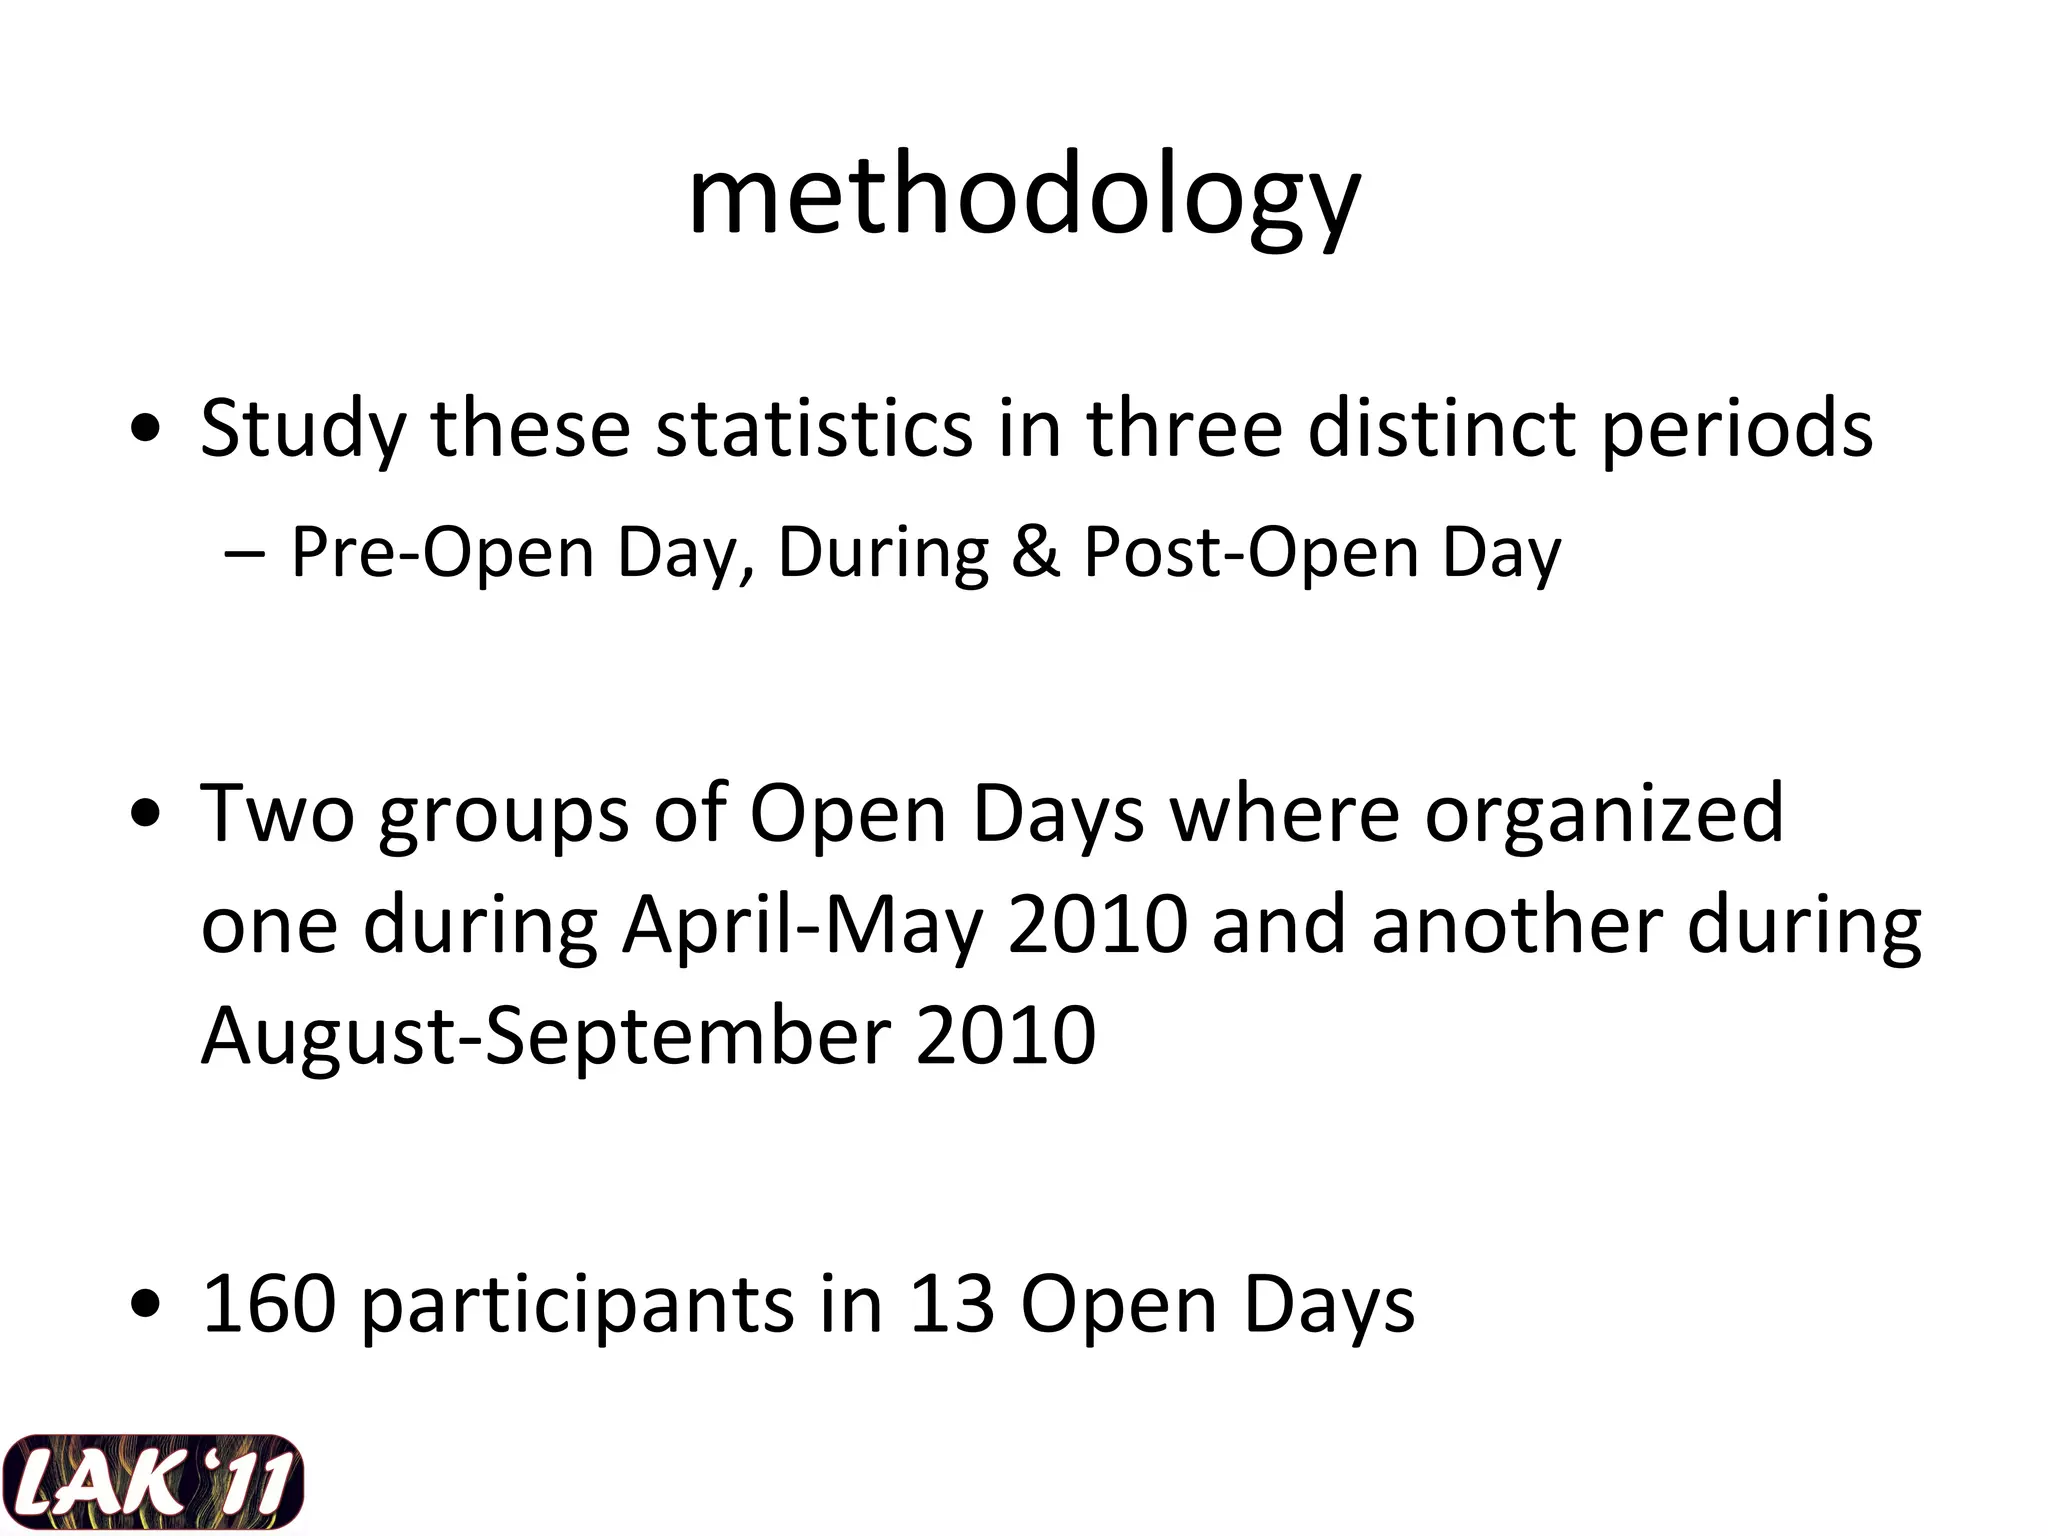
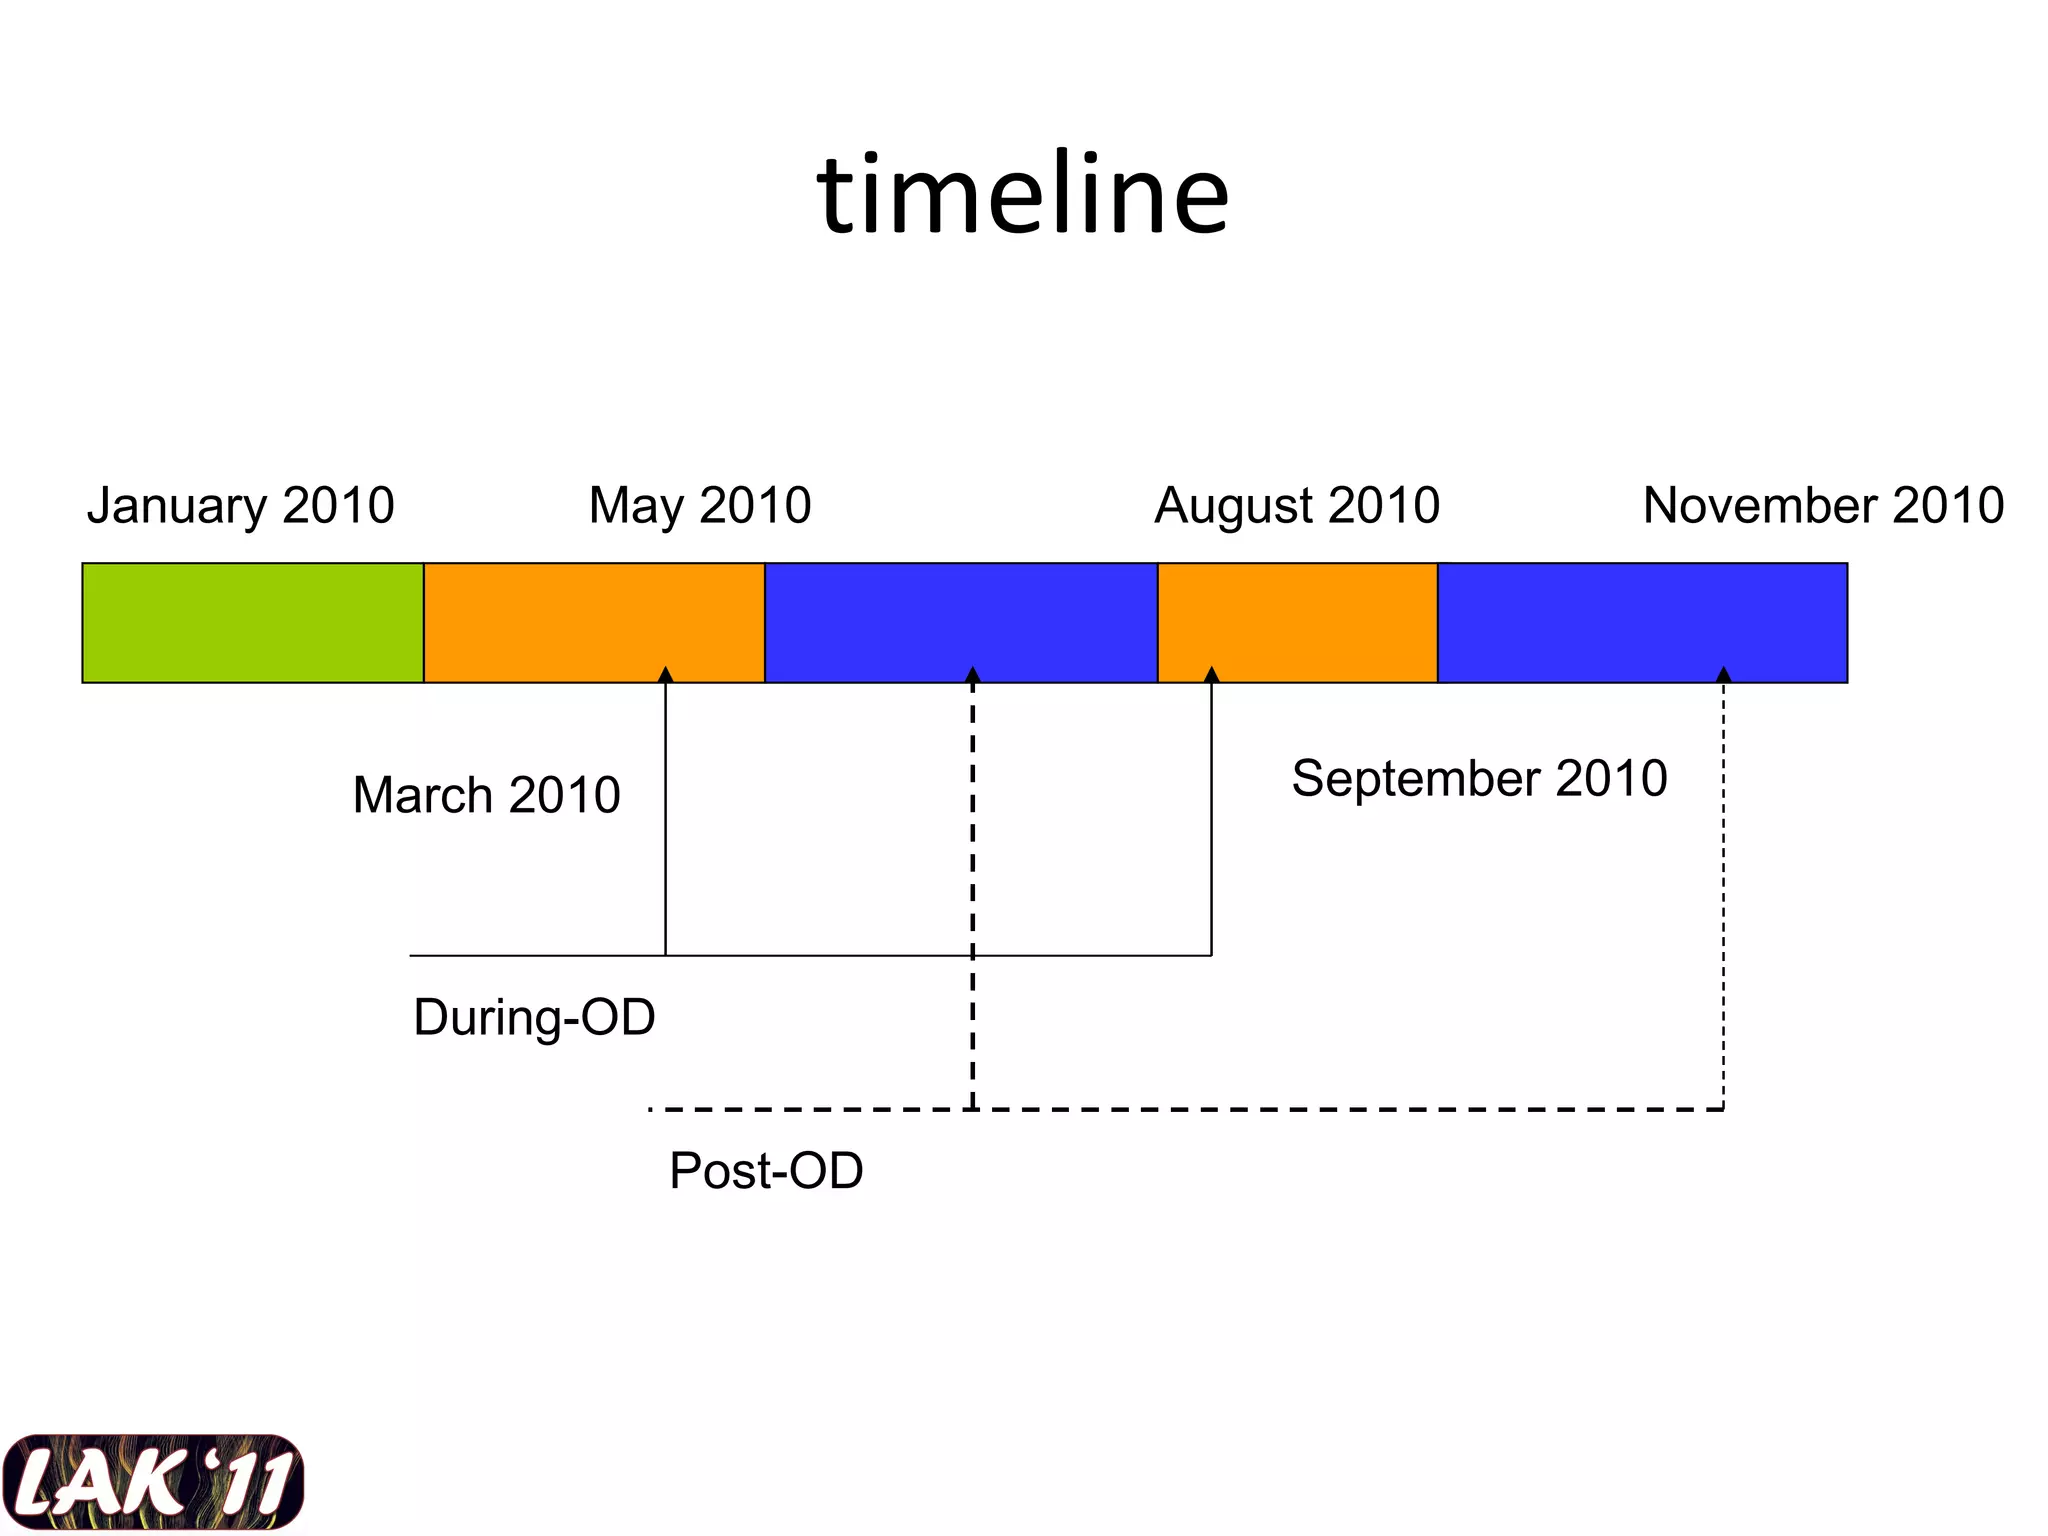
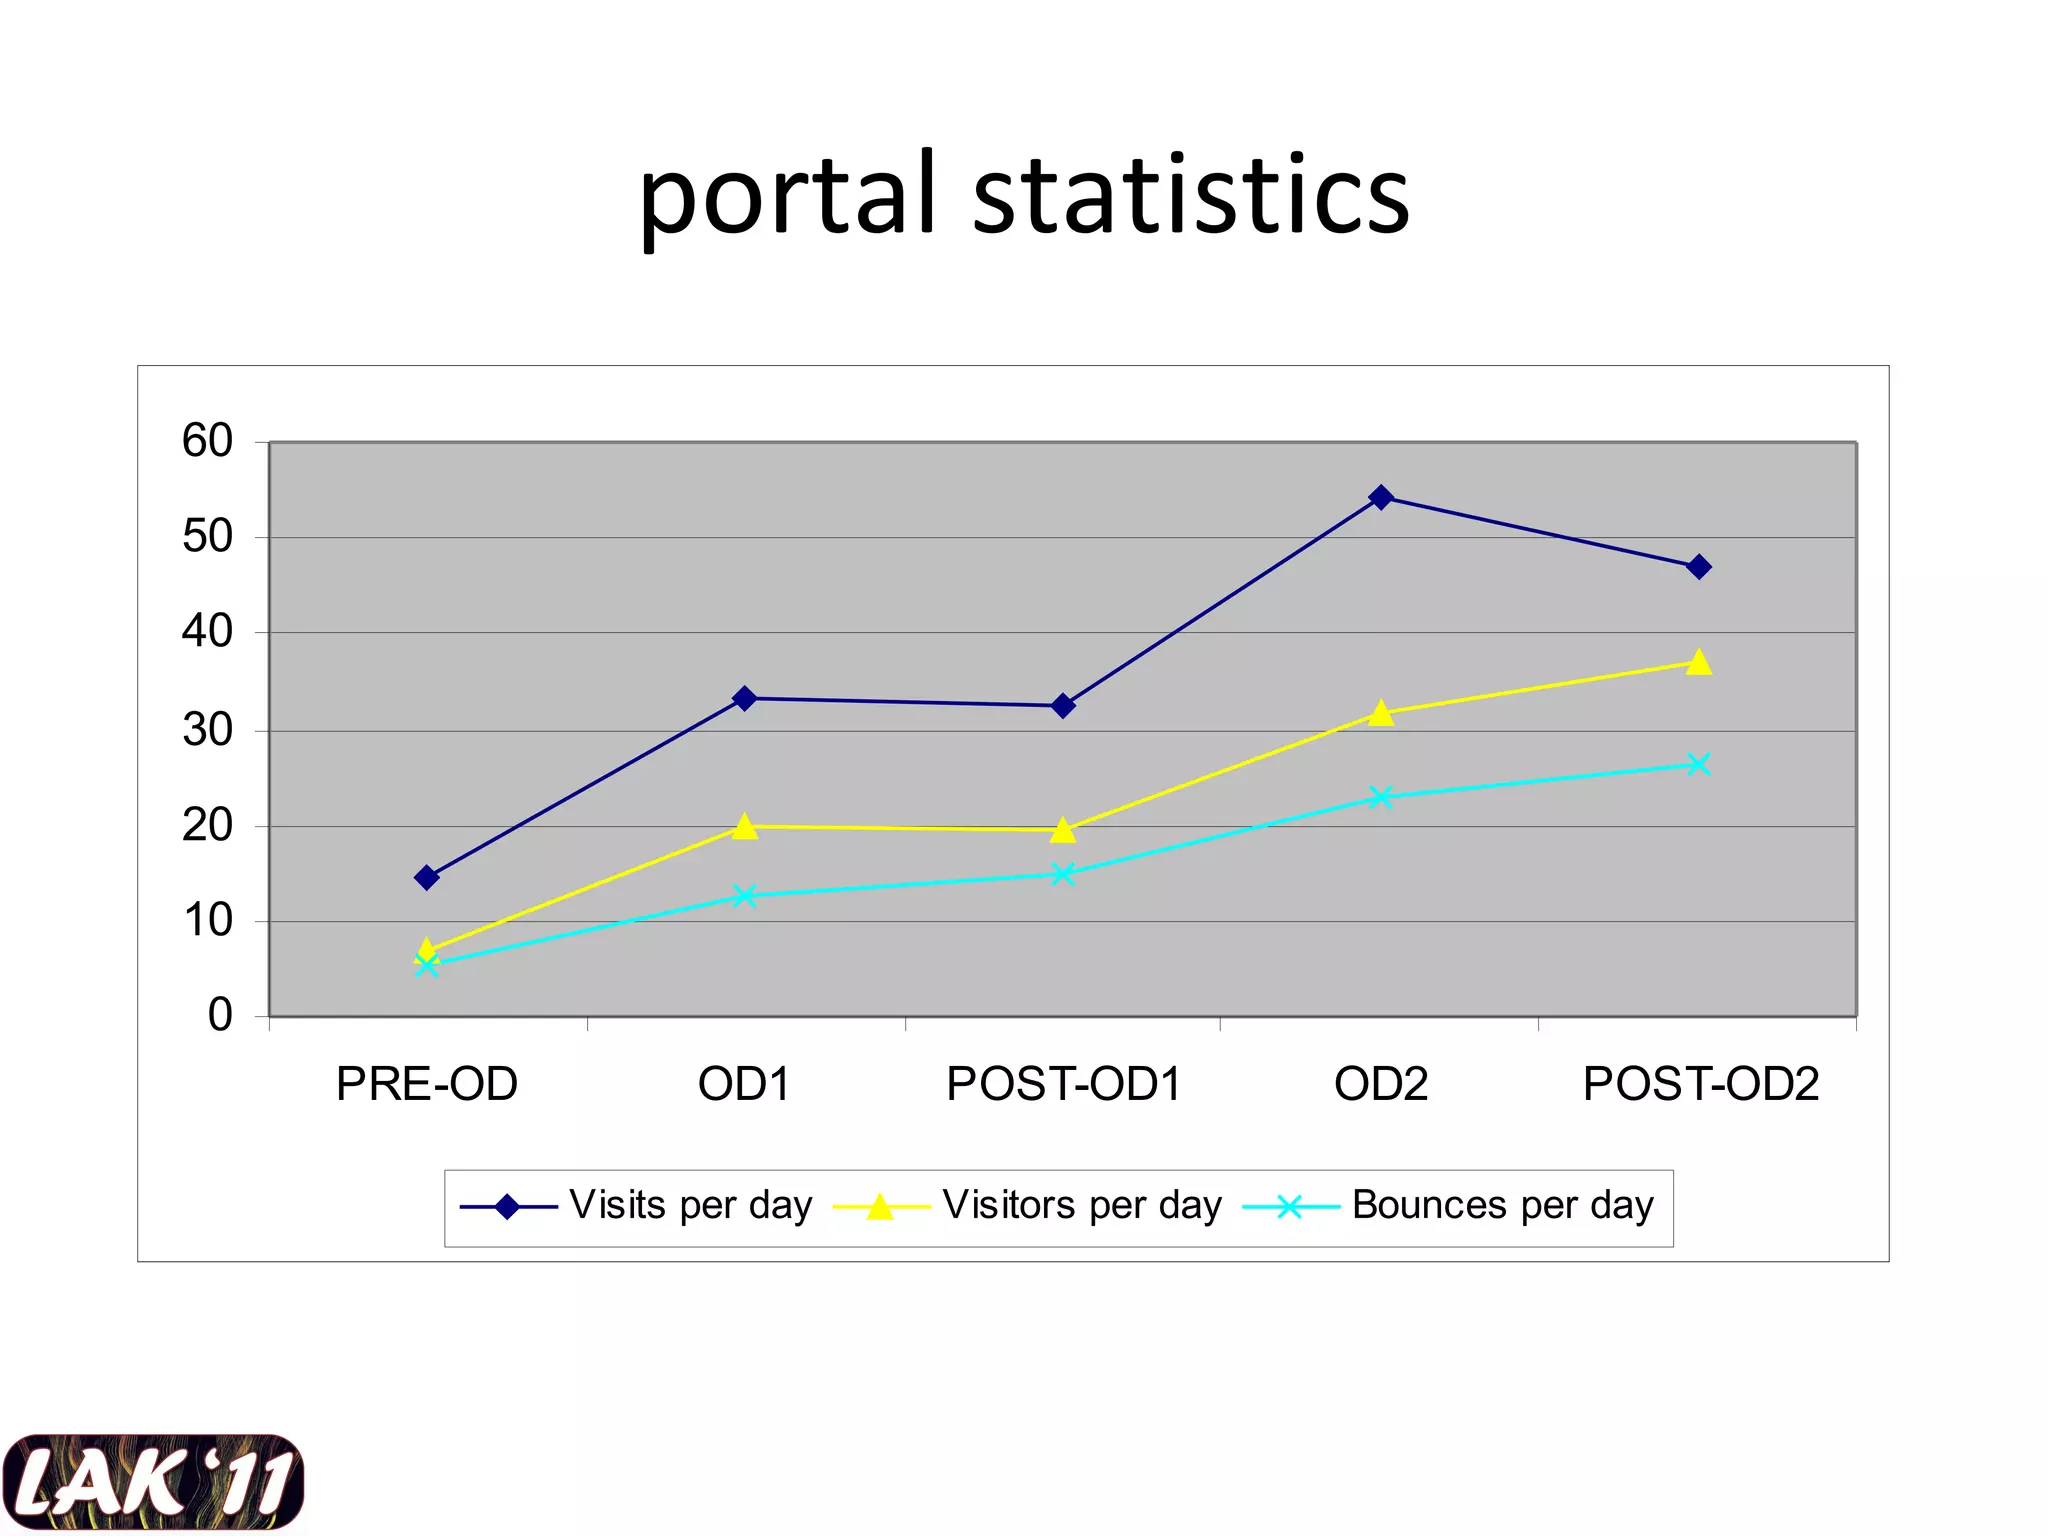
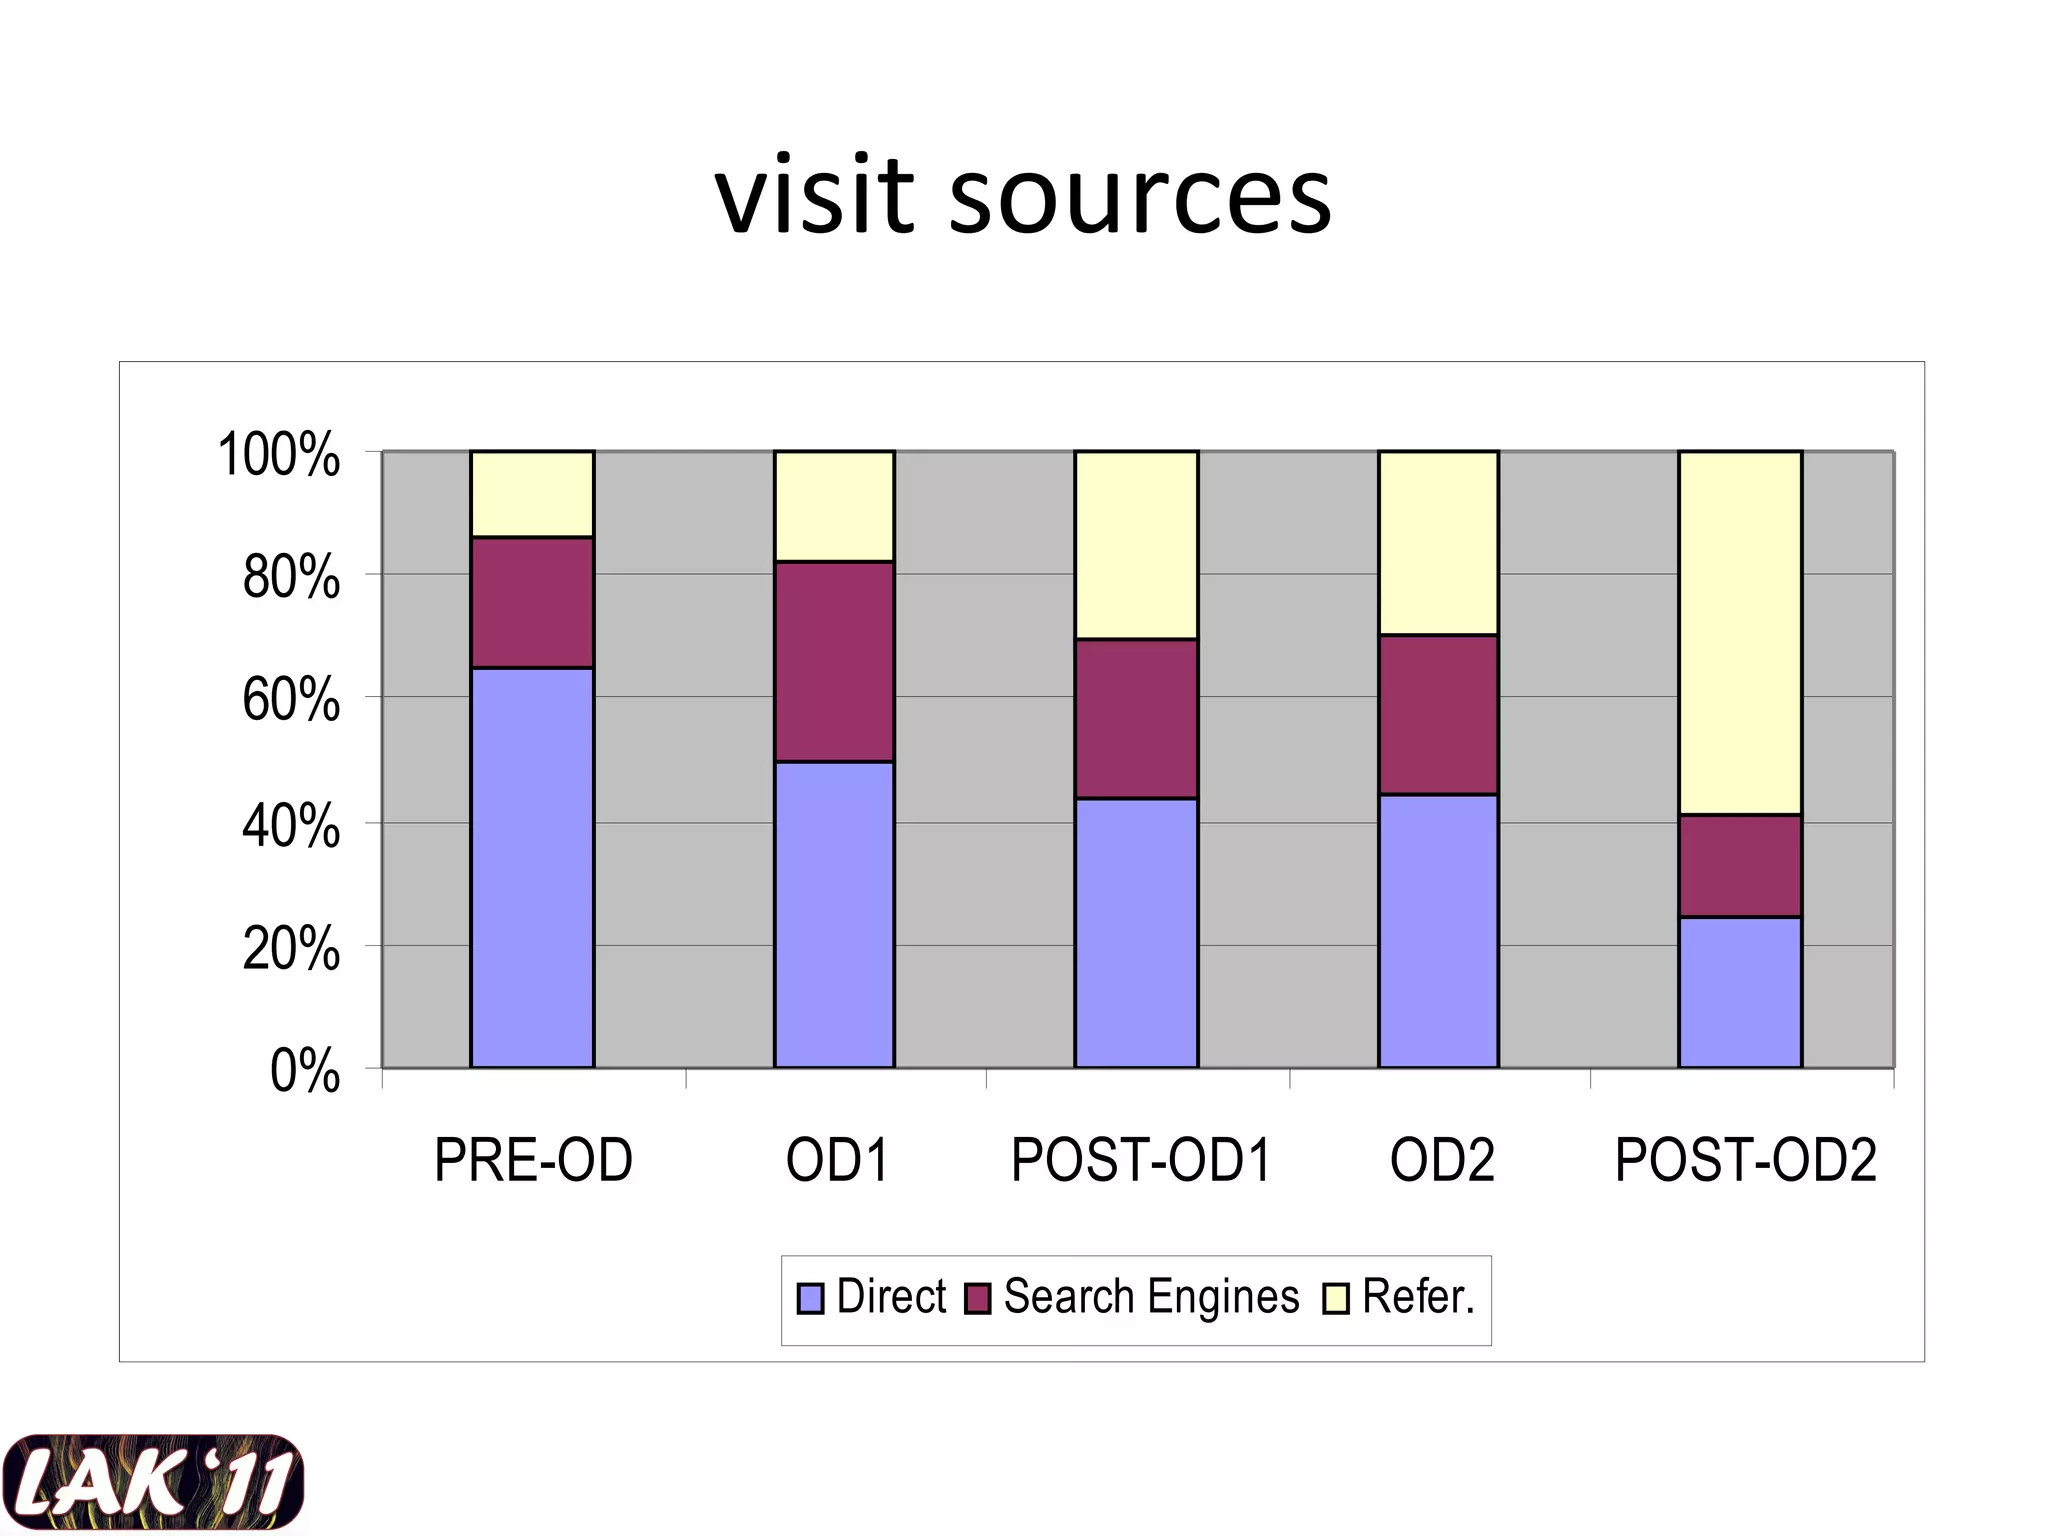
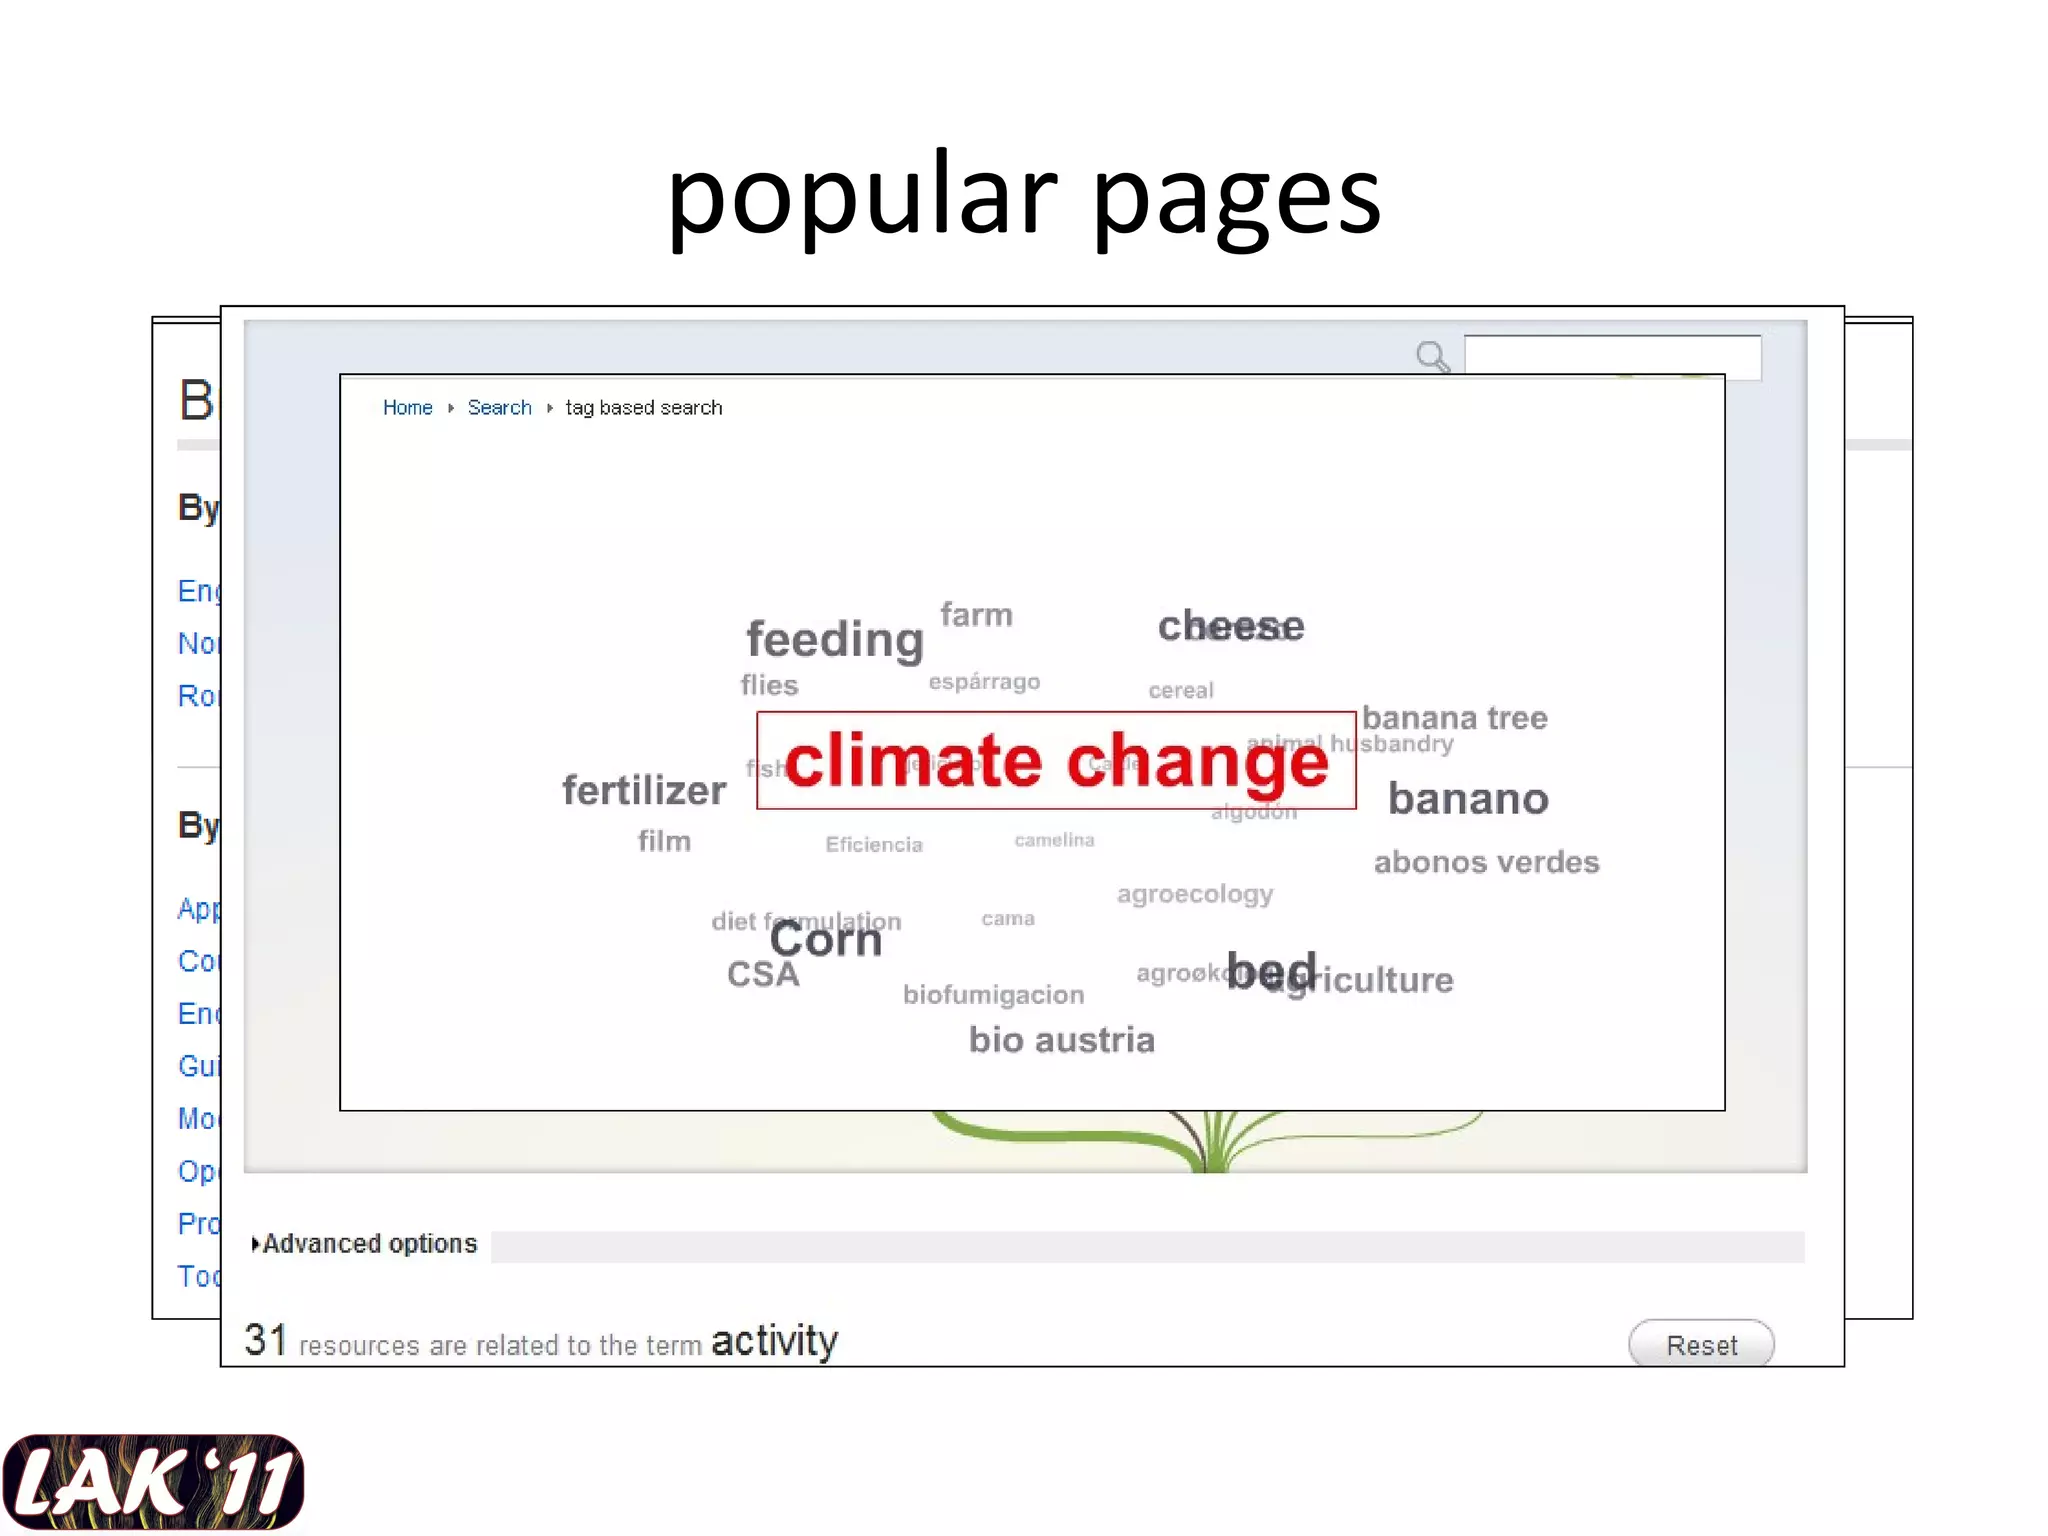
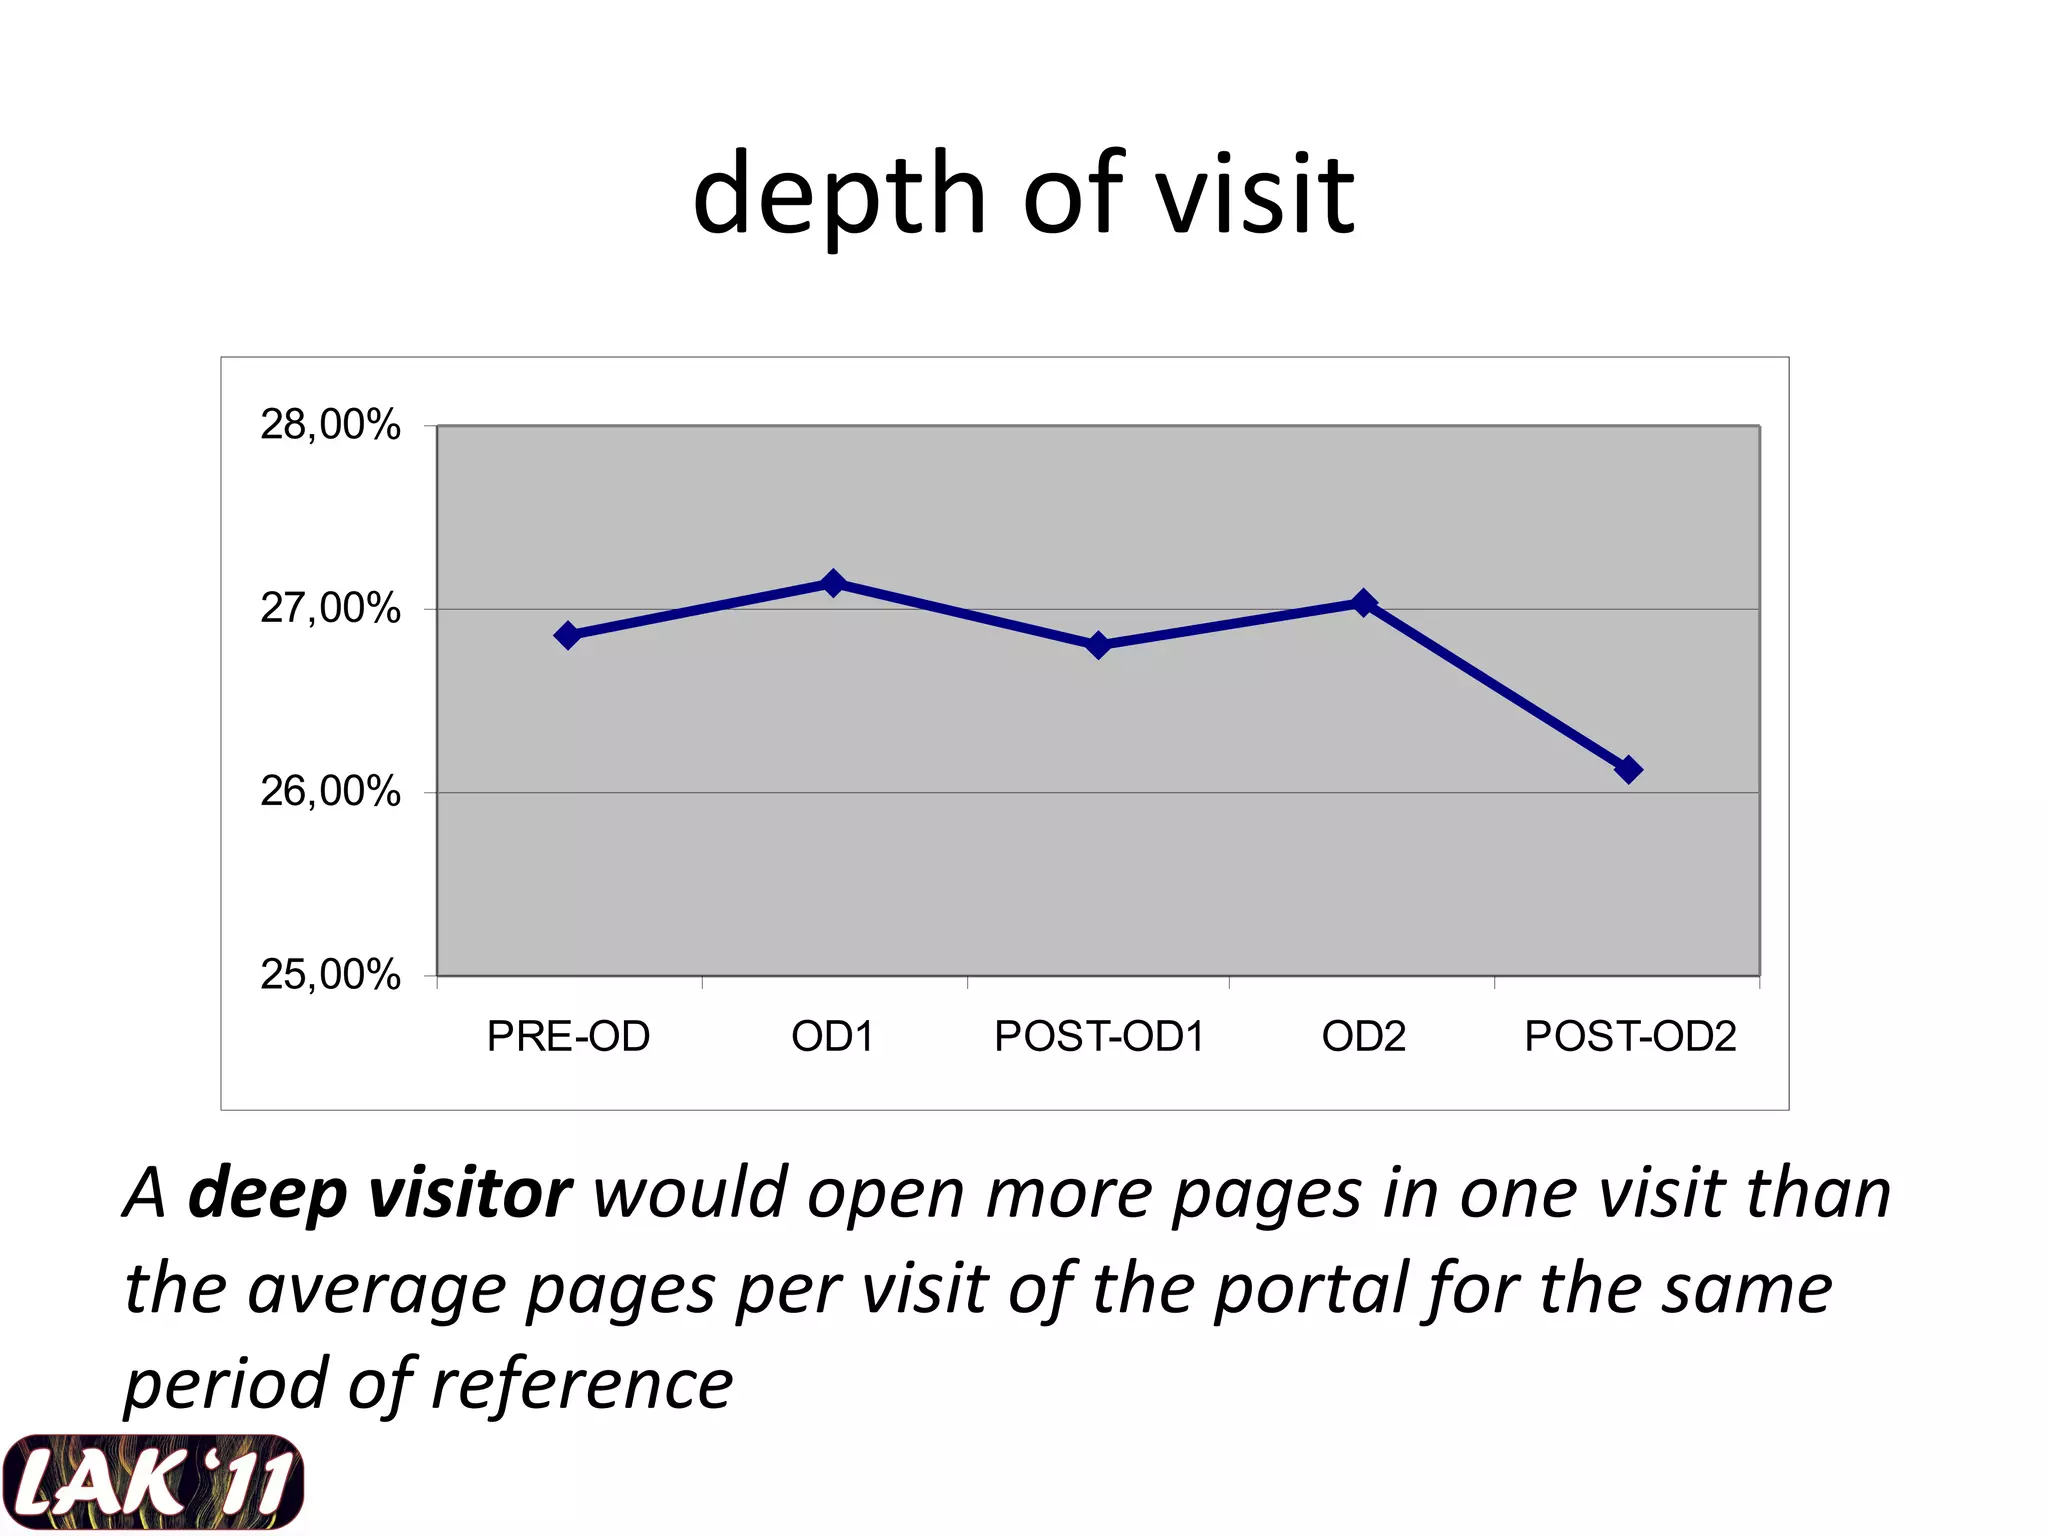
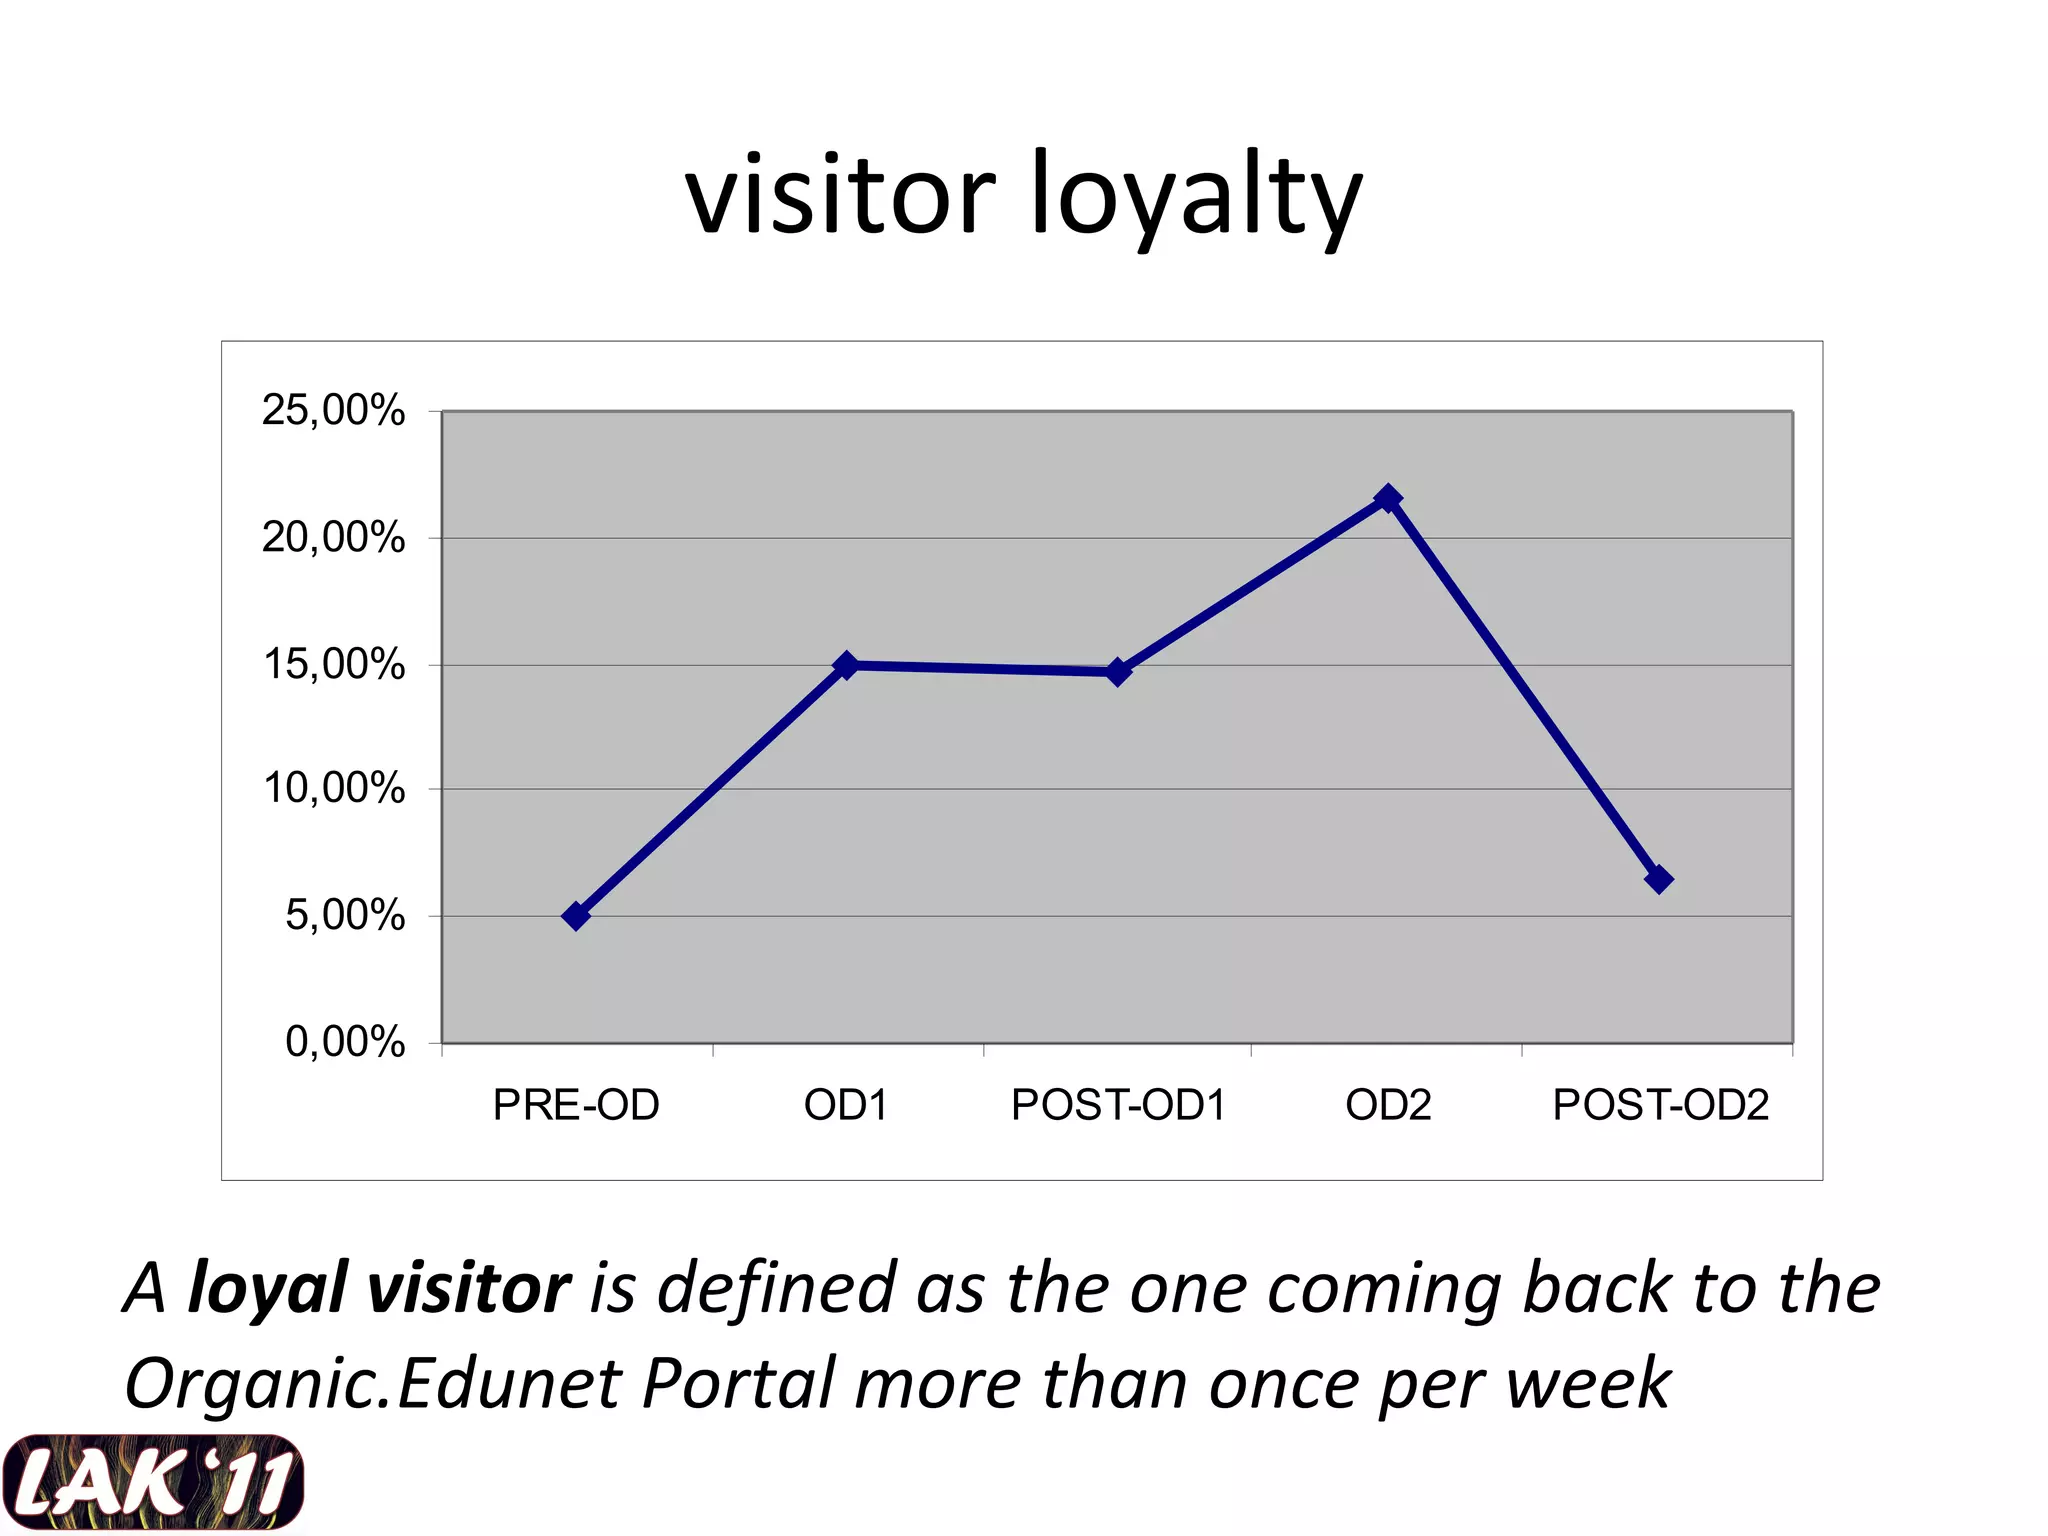
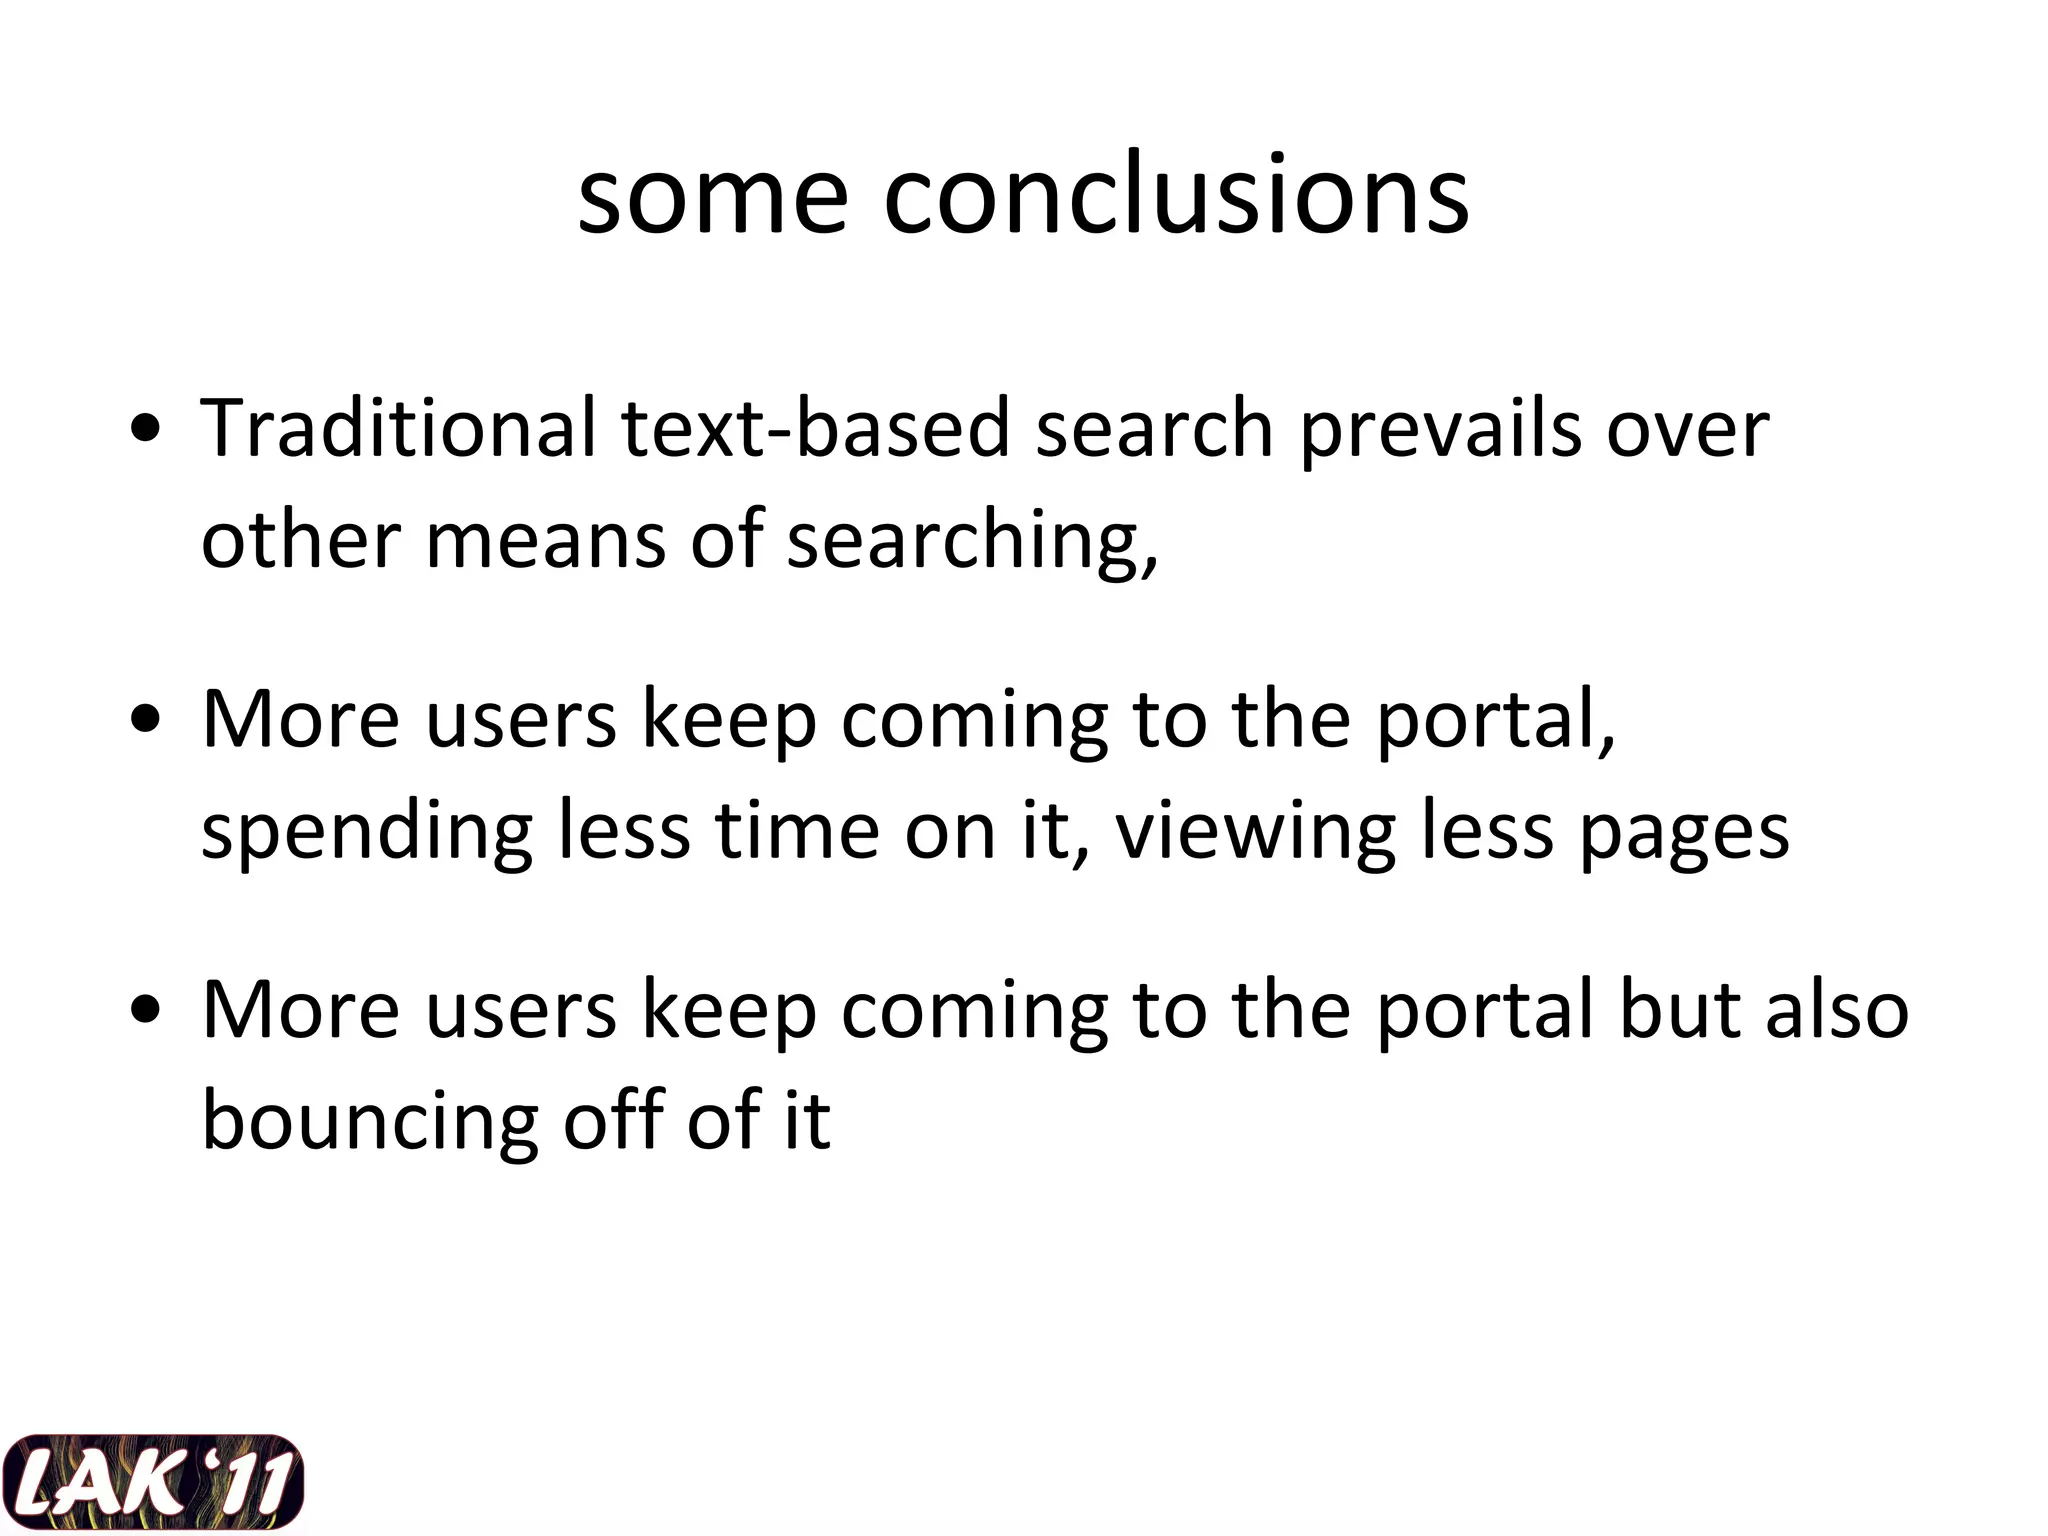
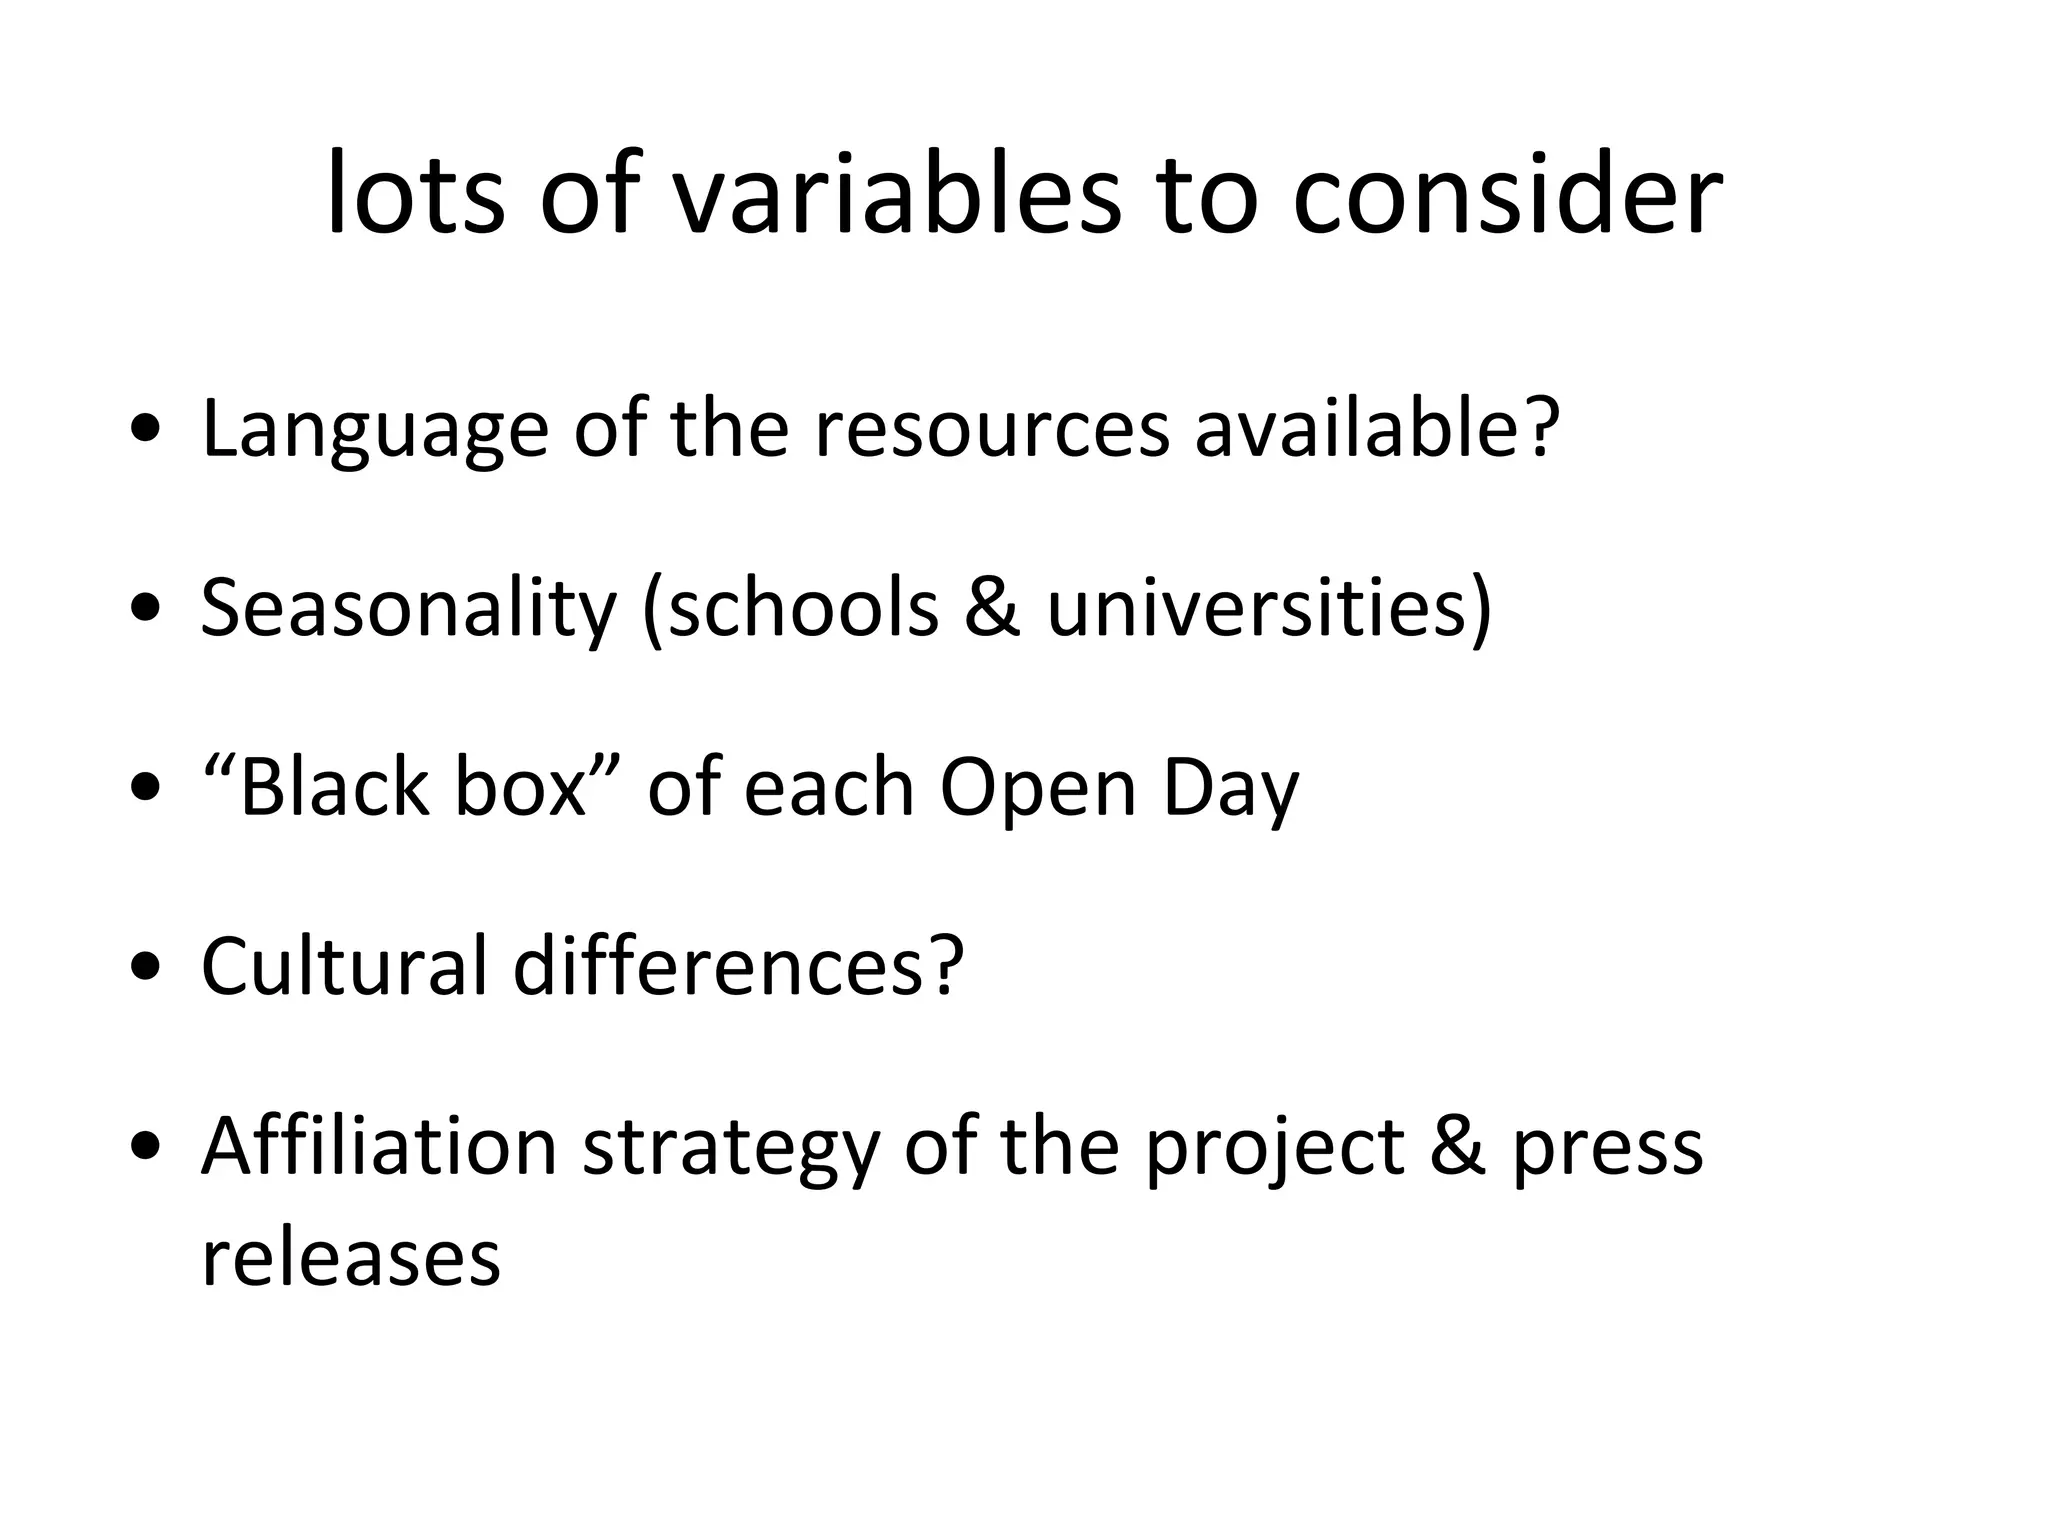
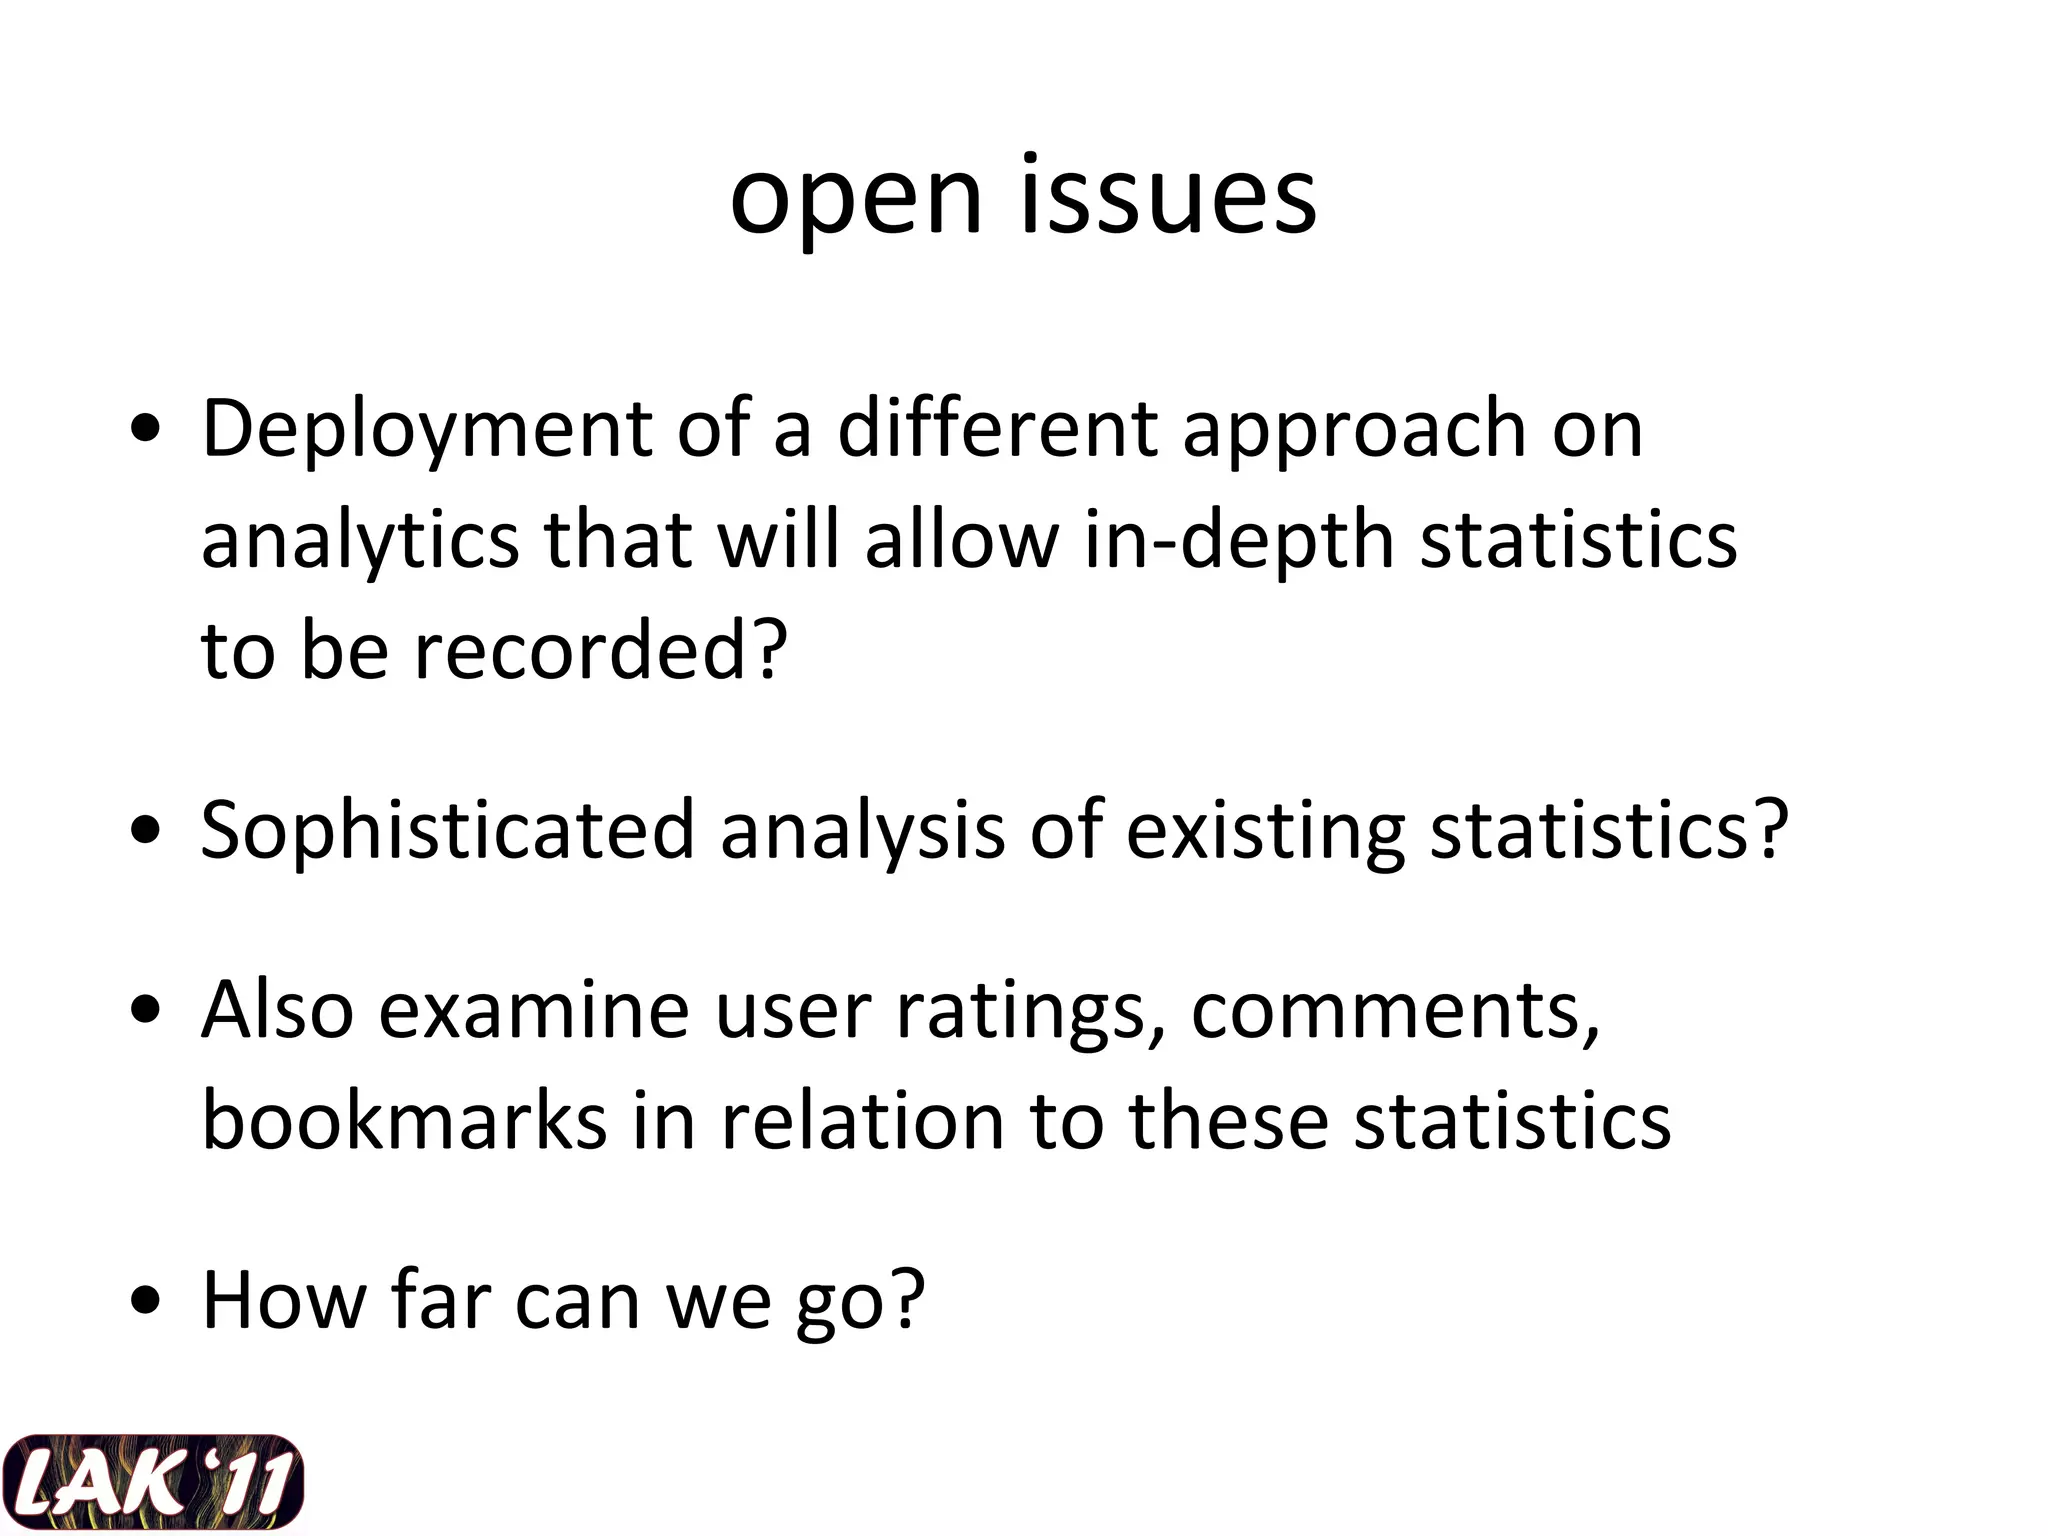
This document summarizes a case study on the use of analytics for the Organic.Edunet learning portal. The portal provides educational resources on organic agriculture and went online in January 2010. The study examined how usage statistics changed after a series of training events were held. It found that traditional text searches remained most popular, more users visited but spent less time on each visit, and more bounced off the site after the events. However, many variables could be influencing portal usage. Further sophisticated analysis of existing statistics and additional data like user ratings was recommended.


![Αξιολόγηση Μαθησιακών Αντικειμένων και Σφραγίδες Ποιότητας [Εργαστήρια ΕΕΛ/ΛΑΚ]](https://cdn.slidesharecdn.com/ss_thumbnails/lori-badges-quality-eellak-181215-151218142440-thumbnail.jpg?width=640&height=640&fit=bounds)


![[Lean 101] Solution and Unique Value Proposition](https://cdn.slidesharecdn.com/ss_thumbnails/lean-101module600withbadge-151104125934-lva1-app6892-thumbnail.jpg?width=640&height=640&fit=bounds)
![[Lean 101] Channels & Metrics - Reaching and Measuring](https://cdn.slidesharecdn.com/ss_thumbnails/lean-101module500withbadge-151104125932-lva1-app6891-thumbnail.jpg?width=640&height=640&fit=bounds)
![[Lean 101] Costs & Revenues - Breaking even or Breaking bad???](https://cdn.slidesharecdn.com/ss_thumbnails/lean-101module400withbadge-151104125820-lva1-app6892-thumbnail.jpg?width=640&height=640&fit=bounds)
![[Lean 101] Learn, Adapt & Pivot](https://cdn.slidesharecdn.com/ss_thumbnails/lean-101module300withbadge-151104125558-lva1-app6892-thumbnail.jpg?width=640&height=640&fit=bounds)
![[Lean 101] Bootstrapping & Getting Out of the Building](https://cdn.slidesharecdn.com/ss_thumbnails/lean-101module200withbadge-151104125427-lva1-app6892-thumbnail.jpg?width=640&height=640&fit=bounds)
![[Lean 101] Introduction to Lean - Preparing a Lean Canvas](https://cdn.slidesharecdn.com/ss_thumbnails/lean-101module100withbadge-151104125029-lva1-app6891-thumbnail.jpg?width=640&height=640&fit=bounds)


